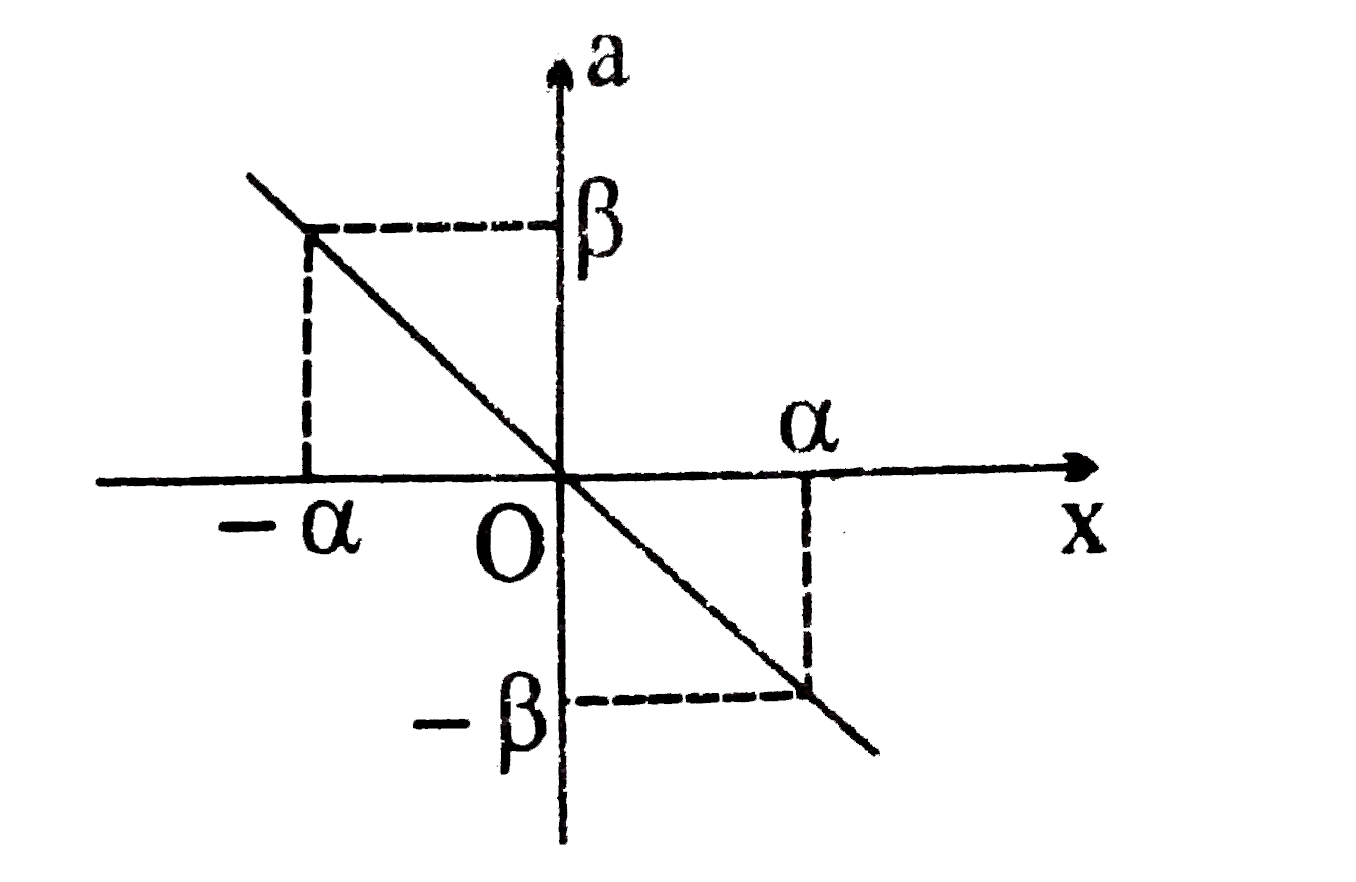
The acceleration-displacement graph of a particle executing simple harmonic motion is shown in the figure. The frequency of oscillation is
The correct Answer is:A
Step by step video & image solution for The acceleration-displacement graph of a particle executing simple harmonic motion is shown in the figure. The frequency of oscillation is by Physics experts to help you in doubts & scoring excellent marks in Class 12 exams.
Updated on:21/07/2023Topper's Solved these Questions
Similar Questions
Knowledge Check
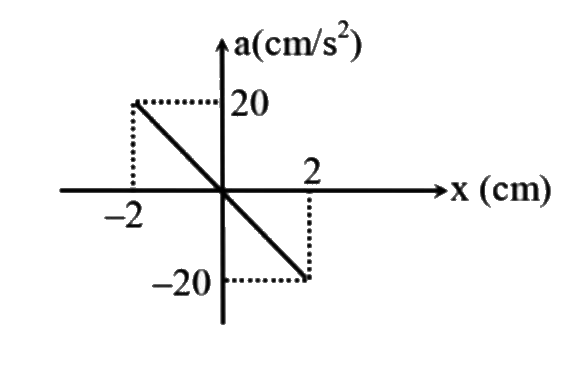
The acceleration displacement graph of a particle executing simple harmonic motion is shown in figure. The time period of simple harmonic motion is
A4π√3sB2π√3sCThe given graph doesn't represent simple harmonic motionDinformation is insufficientThe velocity of a particle executing simple harmonic motion is
Aω2√A2+x2Bω√A2−x2Cω√A2+x2Dω2√A2−x2While a particle executes linear simple harmonic motion
Aits linear velocity and acceleration pass through their maximum and minimum values once in each oscillation.BIts linear velocity and acceleration pass through their maximum and minimum values twice in each oscillation.Cits linear velocity and acceleration pass through their maximum and minimum values four times in each oscillation.Dits linear velocity and acceleration always attain their peak values simlataneaously.
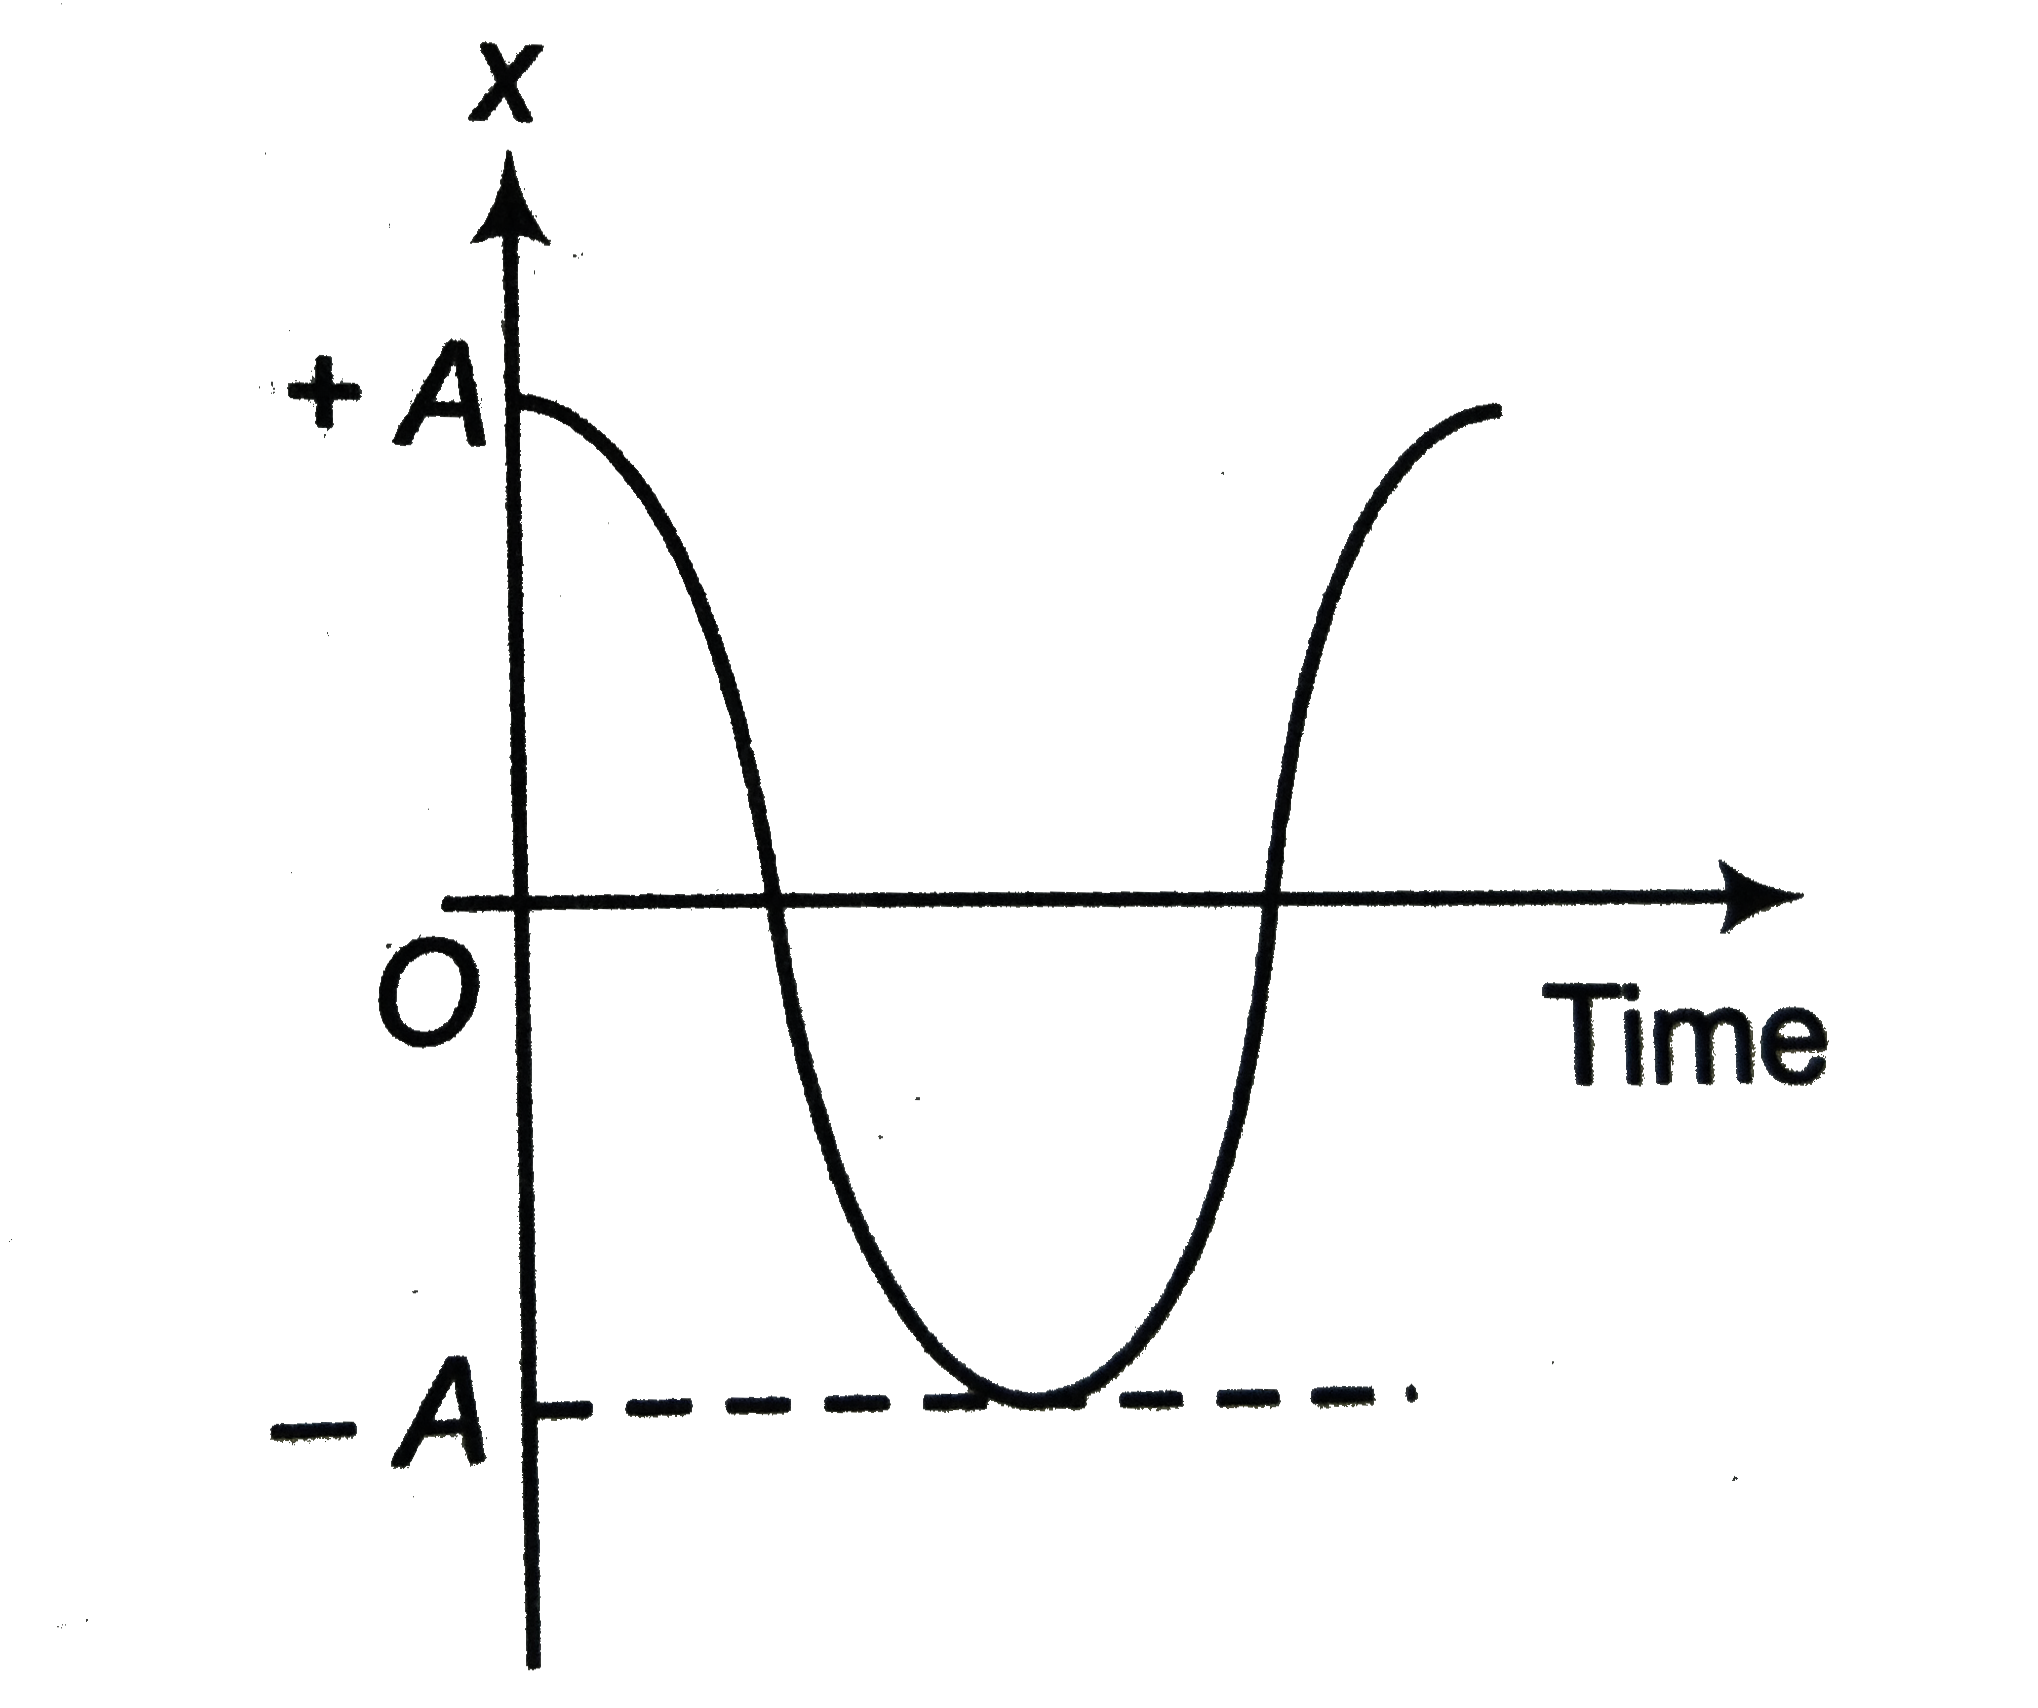
The displacement-time graph of a particle executing simple harmonic motion is shown in the figure
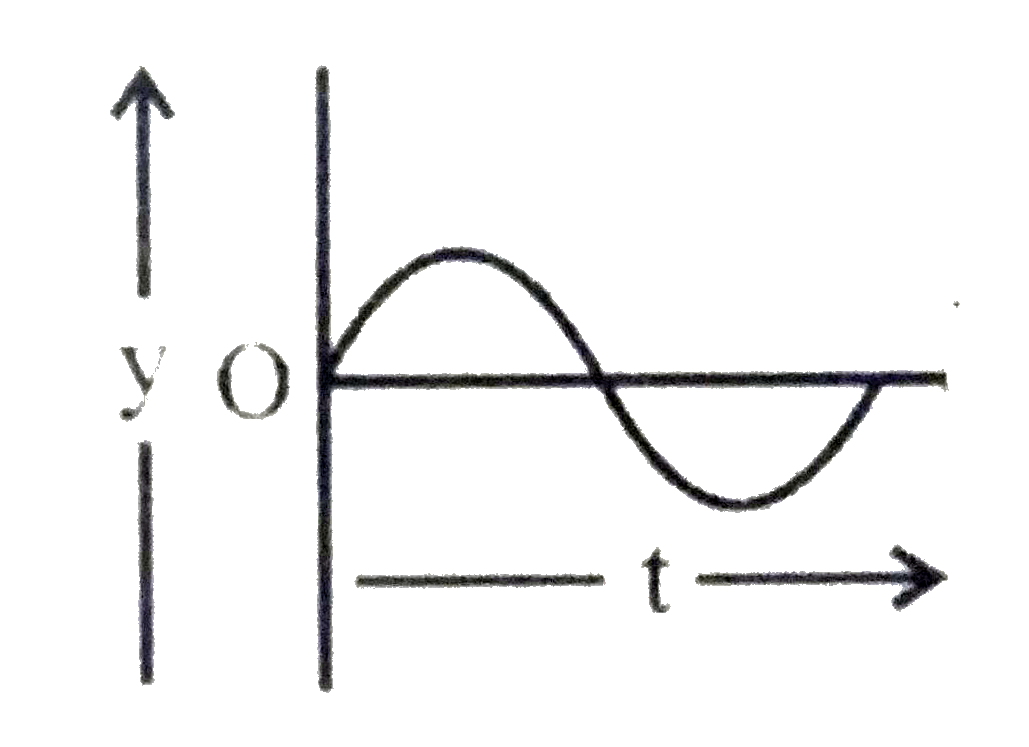
Which one of the following graphs is the correct forcetime graph for the motion of the particle ?
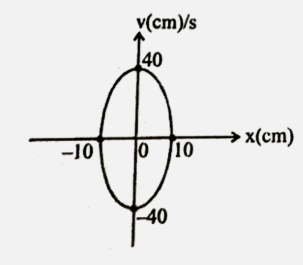
View SolutionThe plot of velocity (v) versus displacement (x) of a particle executing simple harmonic motion is shown in figure. The time period of oscillation of particle is :-
View SolutionThe phase of a particle executing simple harmonic motion is π2 when it has
View SolutionAcceleration-displacement graph of a particle executing SHM Is as shown in given figure. The time period of its oscillation is: (in sec)

View SolutionThe displacement - time (x−t) graph of a particle executing simple harmonic motion is shown in figure. The correct variation of net force F action on the particle as a function of time is
View Solution
