Study carefully the following pie-chart of global mango production and write a short paragraph comparing the production shares in about 120 words .

Mango is one of the most popular fruits in the world-consumed most commonly worldwide, and the most cultivated fruit in the tropical world, with over 2,000 varieties. Mango is commonly known as the king of fruits. According to a recent study, India grows more mangoes than all other fruits combined, 40% of its growth is in India which makes it the leading country in production. China is the second largest producer of mangoes with 12% of production under its control. Then comes Thailand with 7% of total production of mango fruit. Fourth in this study is Pakistan with 5% of mango production under its control. Mexico stands on the fifth but not the last position with 4% of production which is very close to that of Pakistan. Rest of the 32% production of mango falls under the category ofothers.
Topper's Solved these Questions
- FEBRUARY 2015BOOK - GURUKUL PUBLICATION - MAHARASHTRA PREVIOUS YEAR PAPERSCHAPTER - FEBRUARY 2015EXERCISE - SECTION - C
3 Videos
- FEBRUARY 2014BOOK - GURUKUL PUBLICATION - MAHARASHTRA PREVIOUS YEAR PAPERSCHAPTER - FEBRUARY 2014EXERCISE - Section -D
12 Videos
- FEBRUARY 2016BOOK - GURUKUL PUBLICATION - MAHARASHTRA PREVIOUS YEAR PAPERSCHAPTER - FEBRUARY 2016EXERCISE - SECTION-D
8 Videos
Similar Questions
Knowledge Check
Study the graph carefully and answer the following questions.
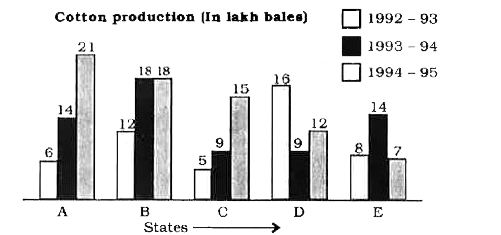
The production of State D in 1993-94 is how many times its production in 1994-95 ?A1.33B0.75C0.56D1.77Study the chart carefully and answer the questions
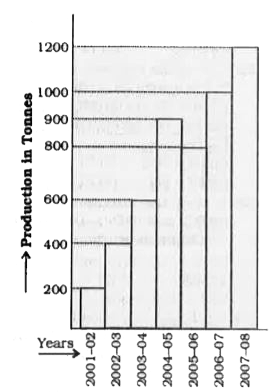
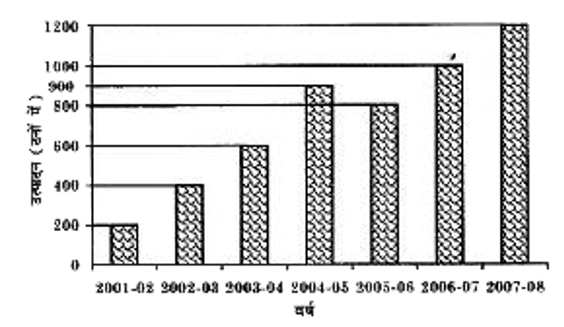
The chart shows production of an item (in tonnes) during certain years .
The production from 2003-04 to 2007-08 increased byA125%B50%C75%D100%Study the chart carefully and answer the questions
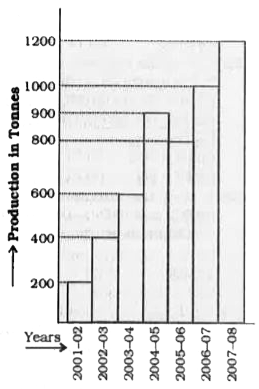
The chart shows production of an item (in tonnes) during certain years .
The production decreased from 2004-05 to 2205-06 byA1119%B819%C919%D1019%
Direction: Study the data carefully and answer the following questions. Following is the production data by 4 persons during 2 months.
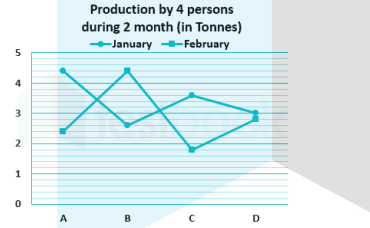
Production by A in January in what % more than production by B in January (Approx)?
View SolutionStudy the chart carefully and answer the questions.
The chart shows production of an item (in tones) during certain years.
The production from 2003-04 to 2007-08 increased by.
-
View SolutionWrite a short note on the following in about 30 words:
(ii) Manufacturing:
View SolutionStudy the chart carefully and answer the questions
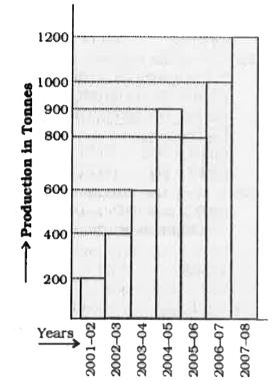
The chart shows production of an item (in tonnes) during certain years .
The production in 2006-2007 in comparison to the production in 2002-03 increased by
View SolutionStudy the following pie chart and answer the question that follows
The pie chart shows company XYZ expenditure on various heads for Q3 2015.

If the company the spent a total of Rs 120 lakhs crores on the various heads, then how much was spent on loan interest
View Solution

