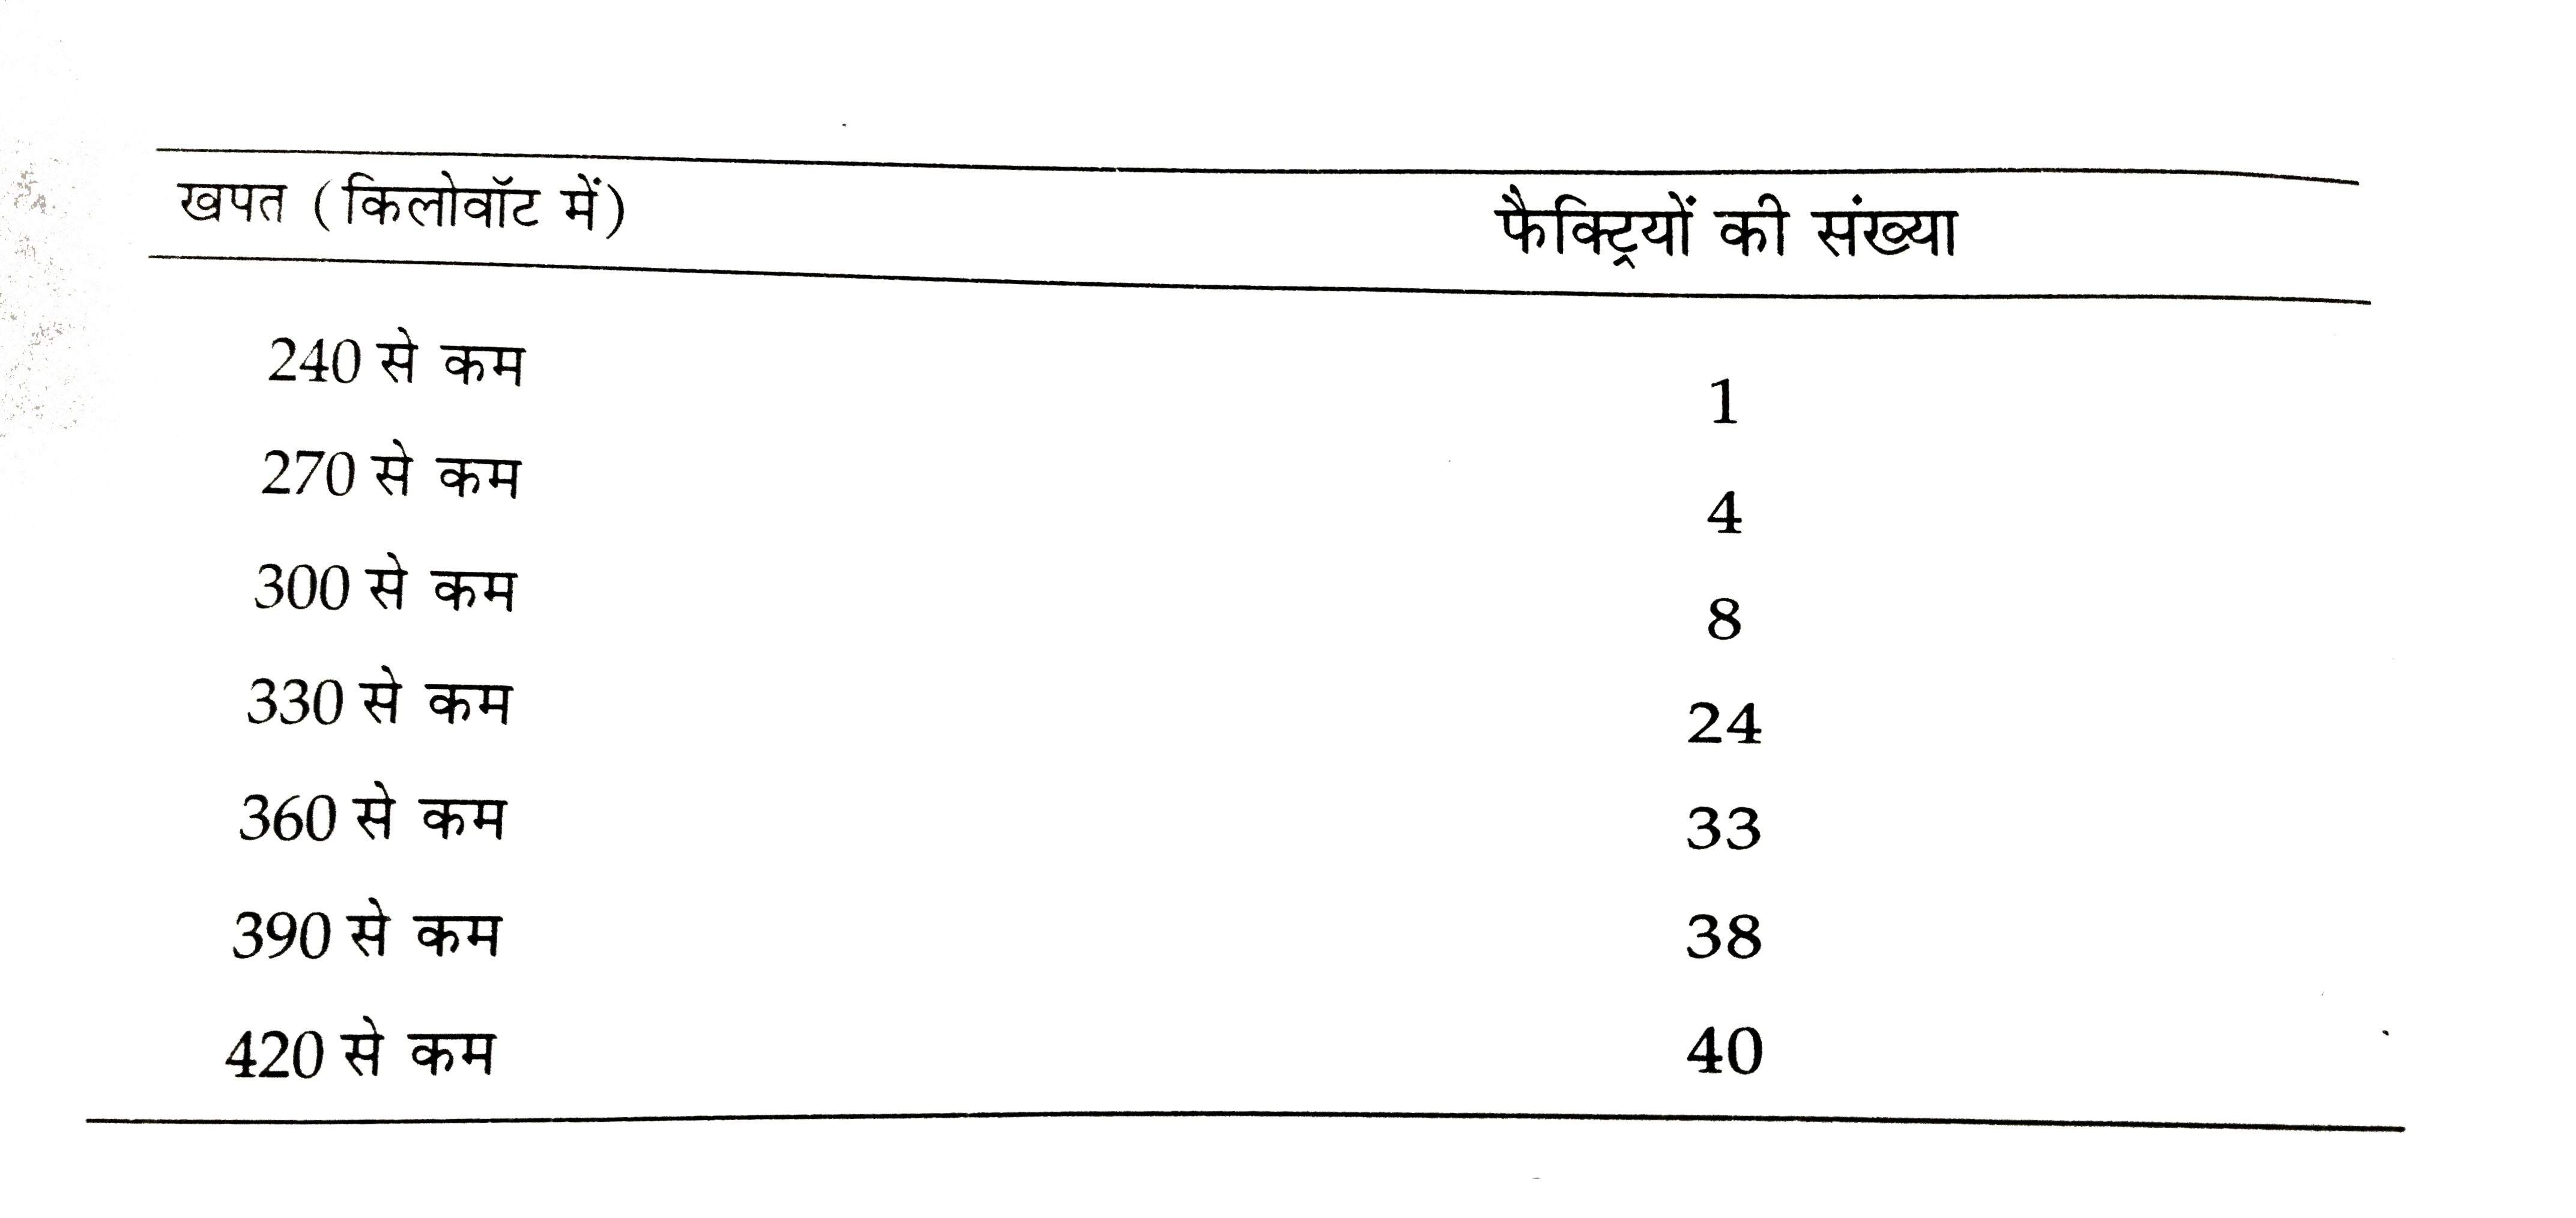
निम्नलिखित संचयी बारम्बारता बंटन सारणी एक औधोगिक क्षेत्र में 40 फैक्ट्रियों की दैनिक विधुत खपत ( किलो वाट में ) को प्रदर्शित है :

इस एक बारम्बारता बंटन सारणी के रूप में प्रस्तुत कीजिये |
The correct Answer is:(##RDSHINMATIXC22E02008_A01##)
Step by step video solution for निम्नलिखित संचयी बारम्बारता बंटन सारणी एक औधोगिक क्षेत्र में 40 फैक्ट्रियों की दैनिक विधुत खपत ( किलो वाट में ) को प्रदर्शित है : इस एक बारम्बारता बंटन सारणी के रूप में प्रस्तुत कीजिये | by Maths experts to help you in doubts & scoring excellent marks in Class 9 exams.
Updated on:21/07/2023Topper's Solved these Questions
- सांखि्यिकीय आँकड़ों का सारणीयनBOOK - RD SHARMACHAPTER - सांखि्यिकीय आँकड़ों का सारणीयनEXERCISE - बहु विकल्पीय प्रश्न
10 Videos
- सांखि्यिकीय आँकड़ों का सारणीयनBOOK - RD SHARMACHAPTER - सांखि्यिकीय आँकड़ों का सारणीयनEXERCISE - प्रश्नावली 22.1
55 Videos
- सर्वांगसम त्रिभुजेंBOOK - RD SHARMACHAPTER - सर्वांगसम त्रिभुजेंEXERCISE - बहु विकल्पीय प्रश्न
17 Videos
- सैंपल प्रश्नपत्र BOOK - RD SHARMACHAPTER - सैंपल प्रश्नपत्र EXERCISE - भाग - D
1 Videos
Similar Questions
प्रेक्षणो के सग्रह में से उच्चतम एव न्यूनतम प्रेक्षणो के अन्तर को कहते है ?
View Solutionनिम्नलिखित पदों के अर्थ समझाइये:
विचर
View Solutionयदि ΔABC≅ΔLKMहों, तो ΔLKMकी कौन सी भुजा ΔABCकी भुजा BC के एक बराबर होगी ?
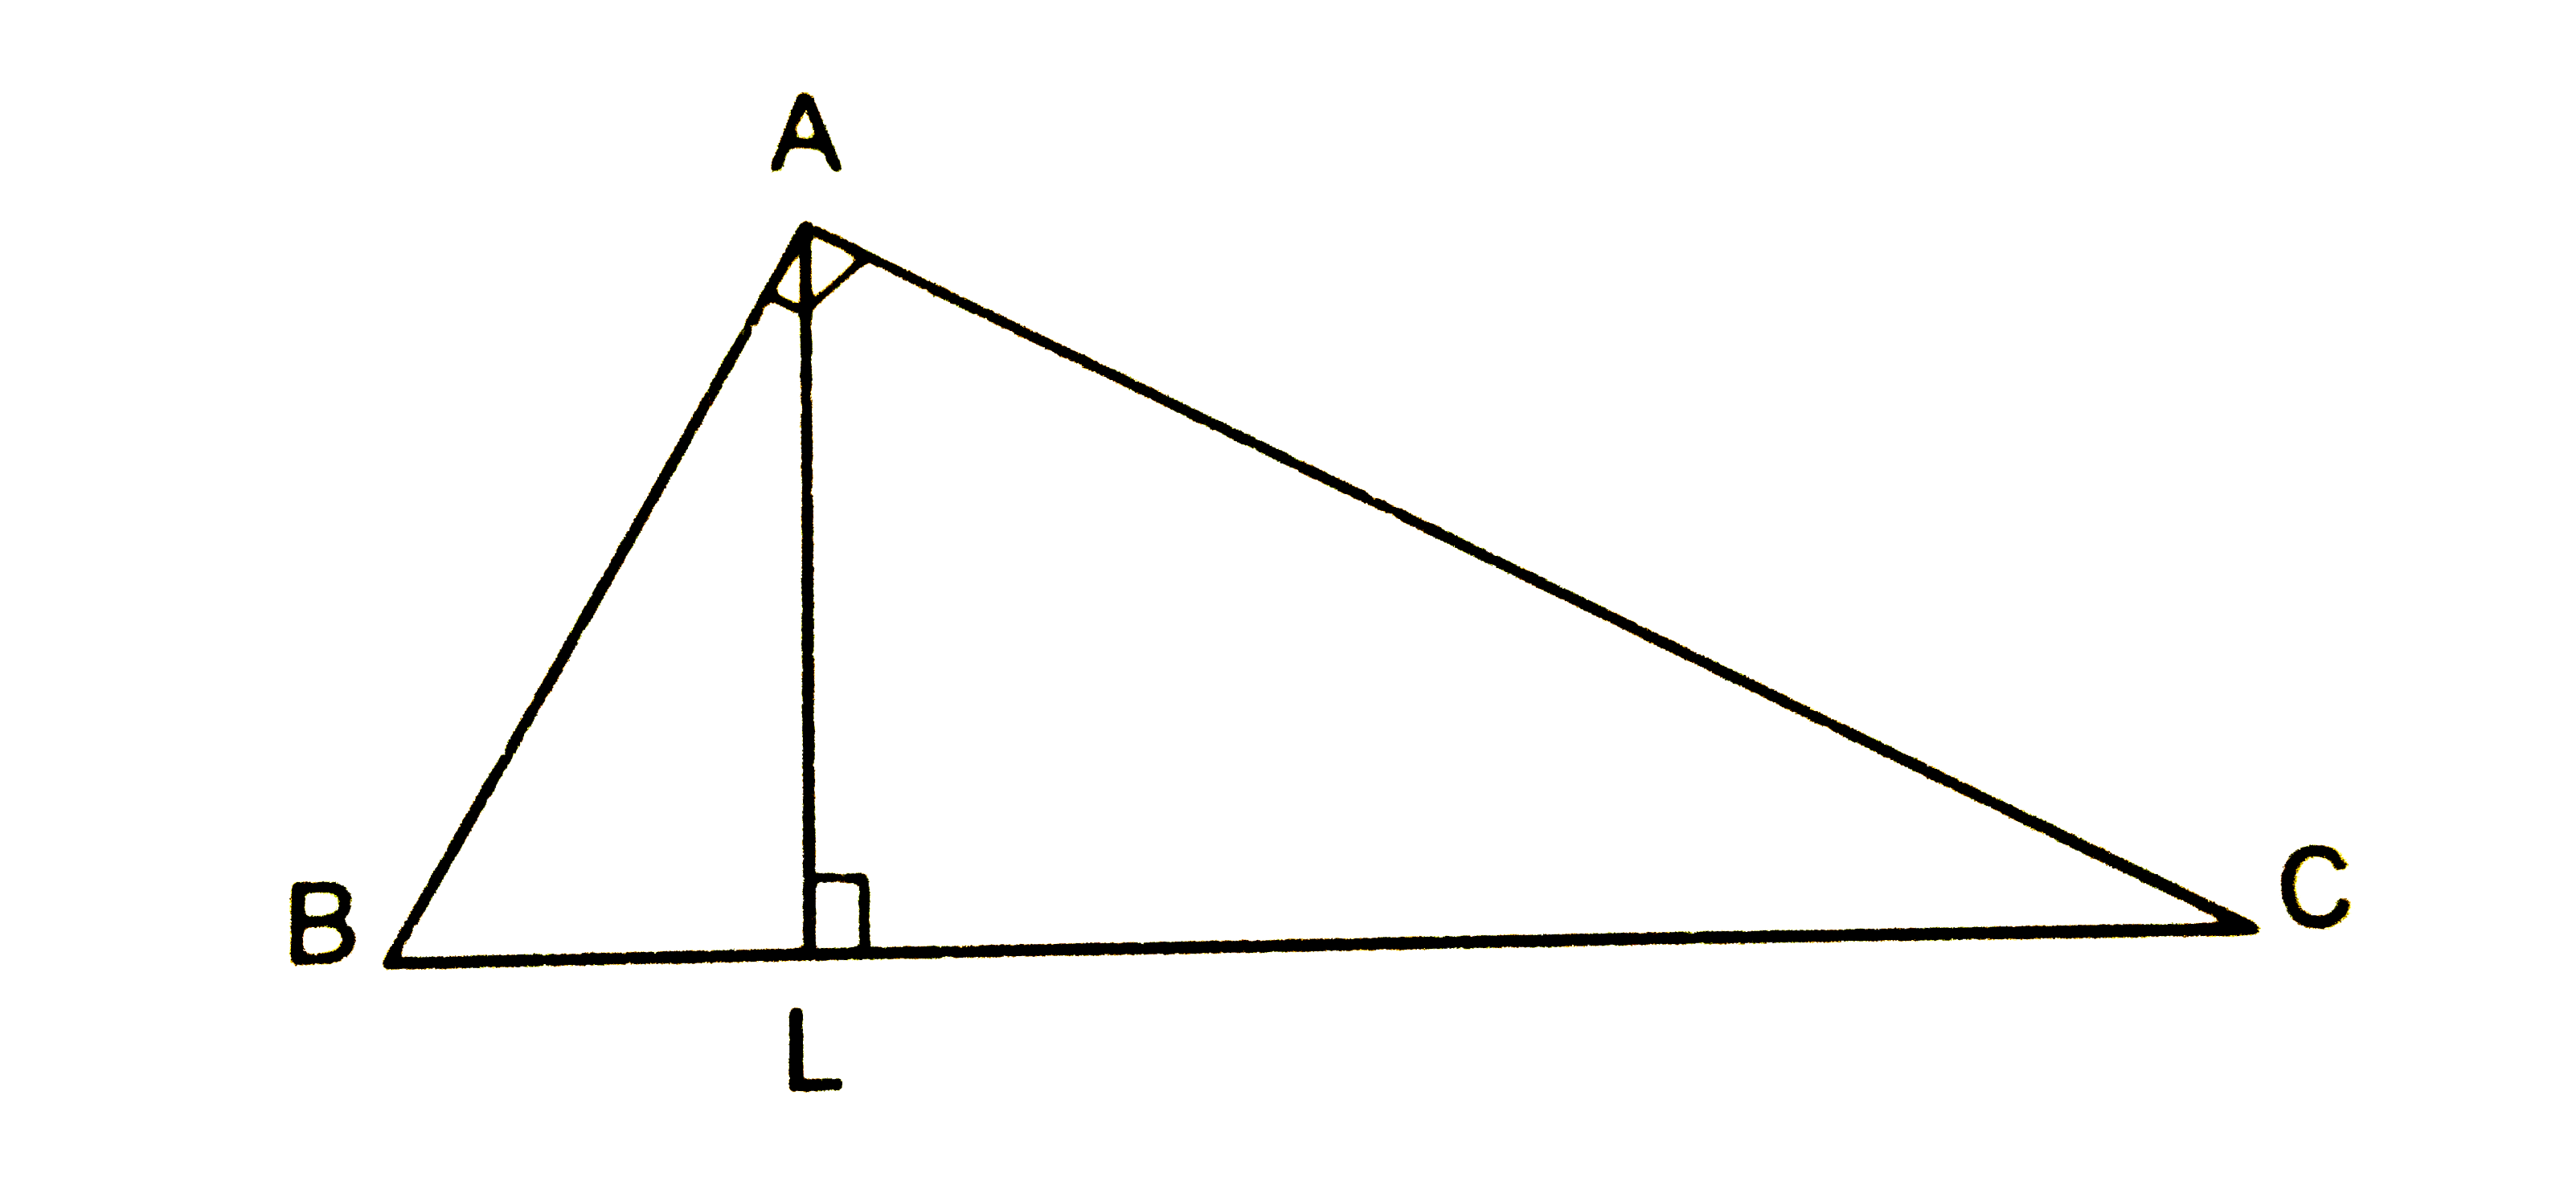
View Solutionचित्र में, त्रिभुज ABC में ∠A समकोण है तथा AL भुजा BC पर लम्ब है । सिद्ध कीजिए कि ∠BAL=∠ACB है ।

View SolutionHow many lines of symmetry does the above figure have ?
View SolutionWhich of the following are correct chain isomers of butane ? (i)
View SolutionDetermine the point of symmetry of a regular hexagon.
View SolutionDtermine the images of the following figure about the given line :
View SolutionMatch the following Column A to Column B

View SolutionMatch the following Column A to Column B

View SolutionMatch the following Column A to Column B

View SolutionThe inequation represented by the graph given below is :
View SolutionThe inequation that best describes the graph given below is _________
View SolutionThe inequation that best describes the following graph is _________
View SolutionWhich inequations represent the shaded region in the given figure
View Solutionयदि किसी x∈R के लिए 20 विधार्थियो द्वारा एक परीक्षा में प्राप्त अंको का बारम्बारता बंटन है

तो अंको का माध्य है
View Solution
