The given plot shows the variation of U, the potential energy of interaction between two particles with the distance separating them r,
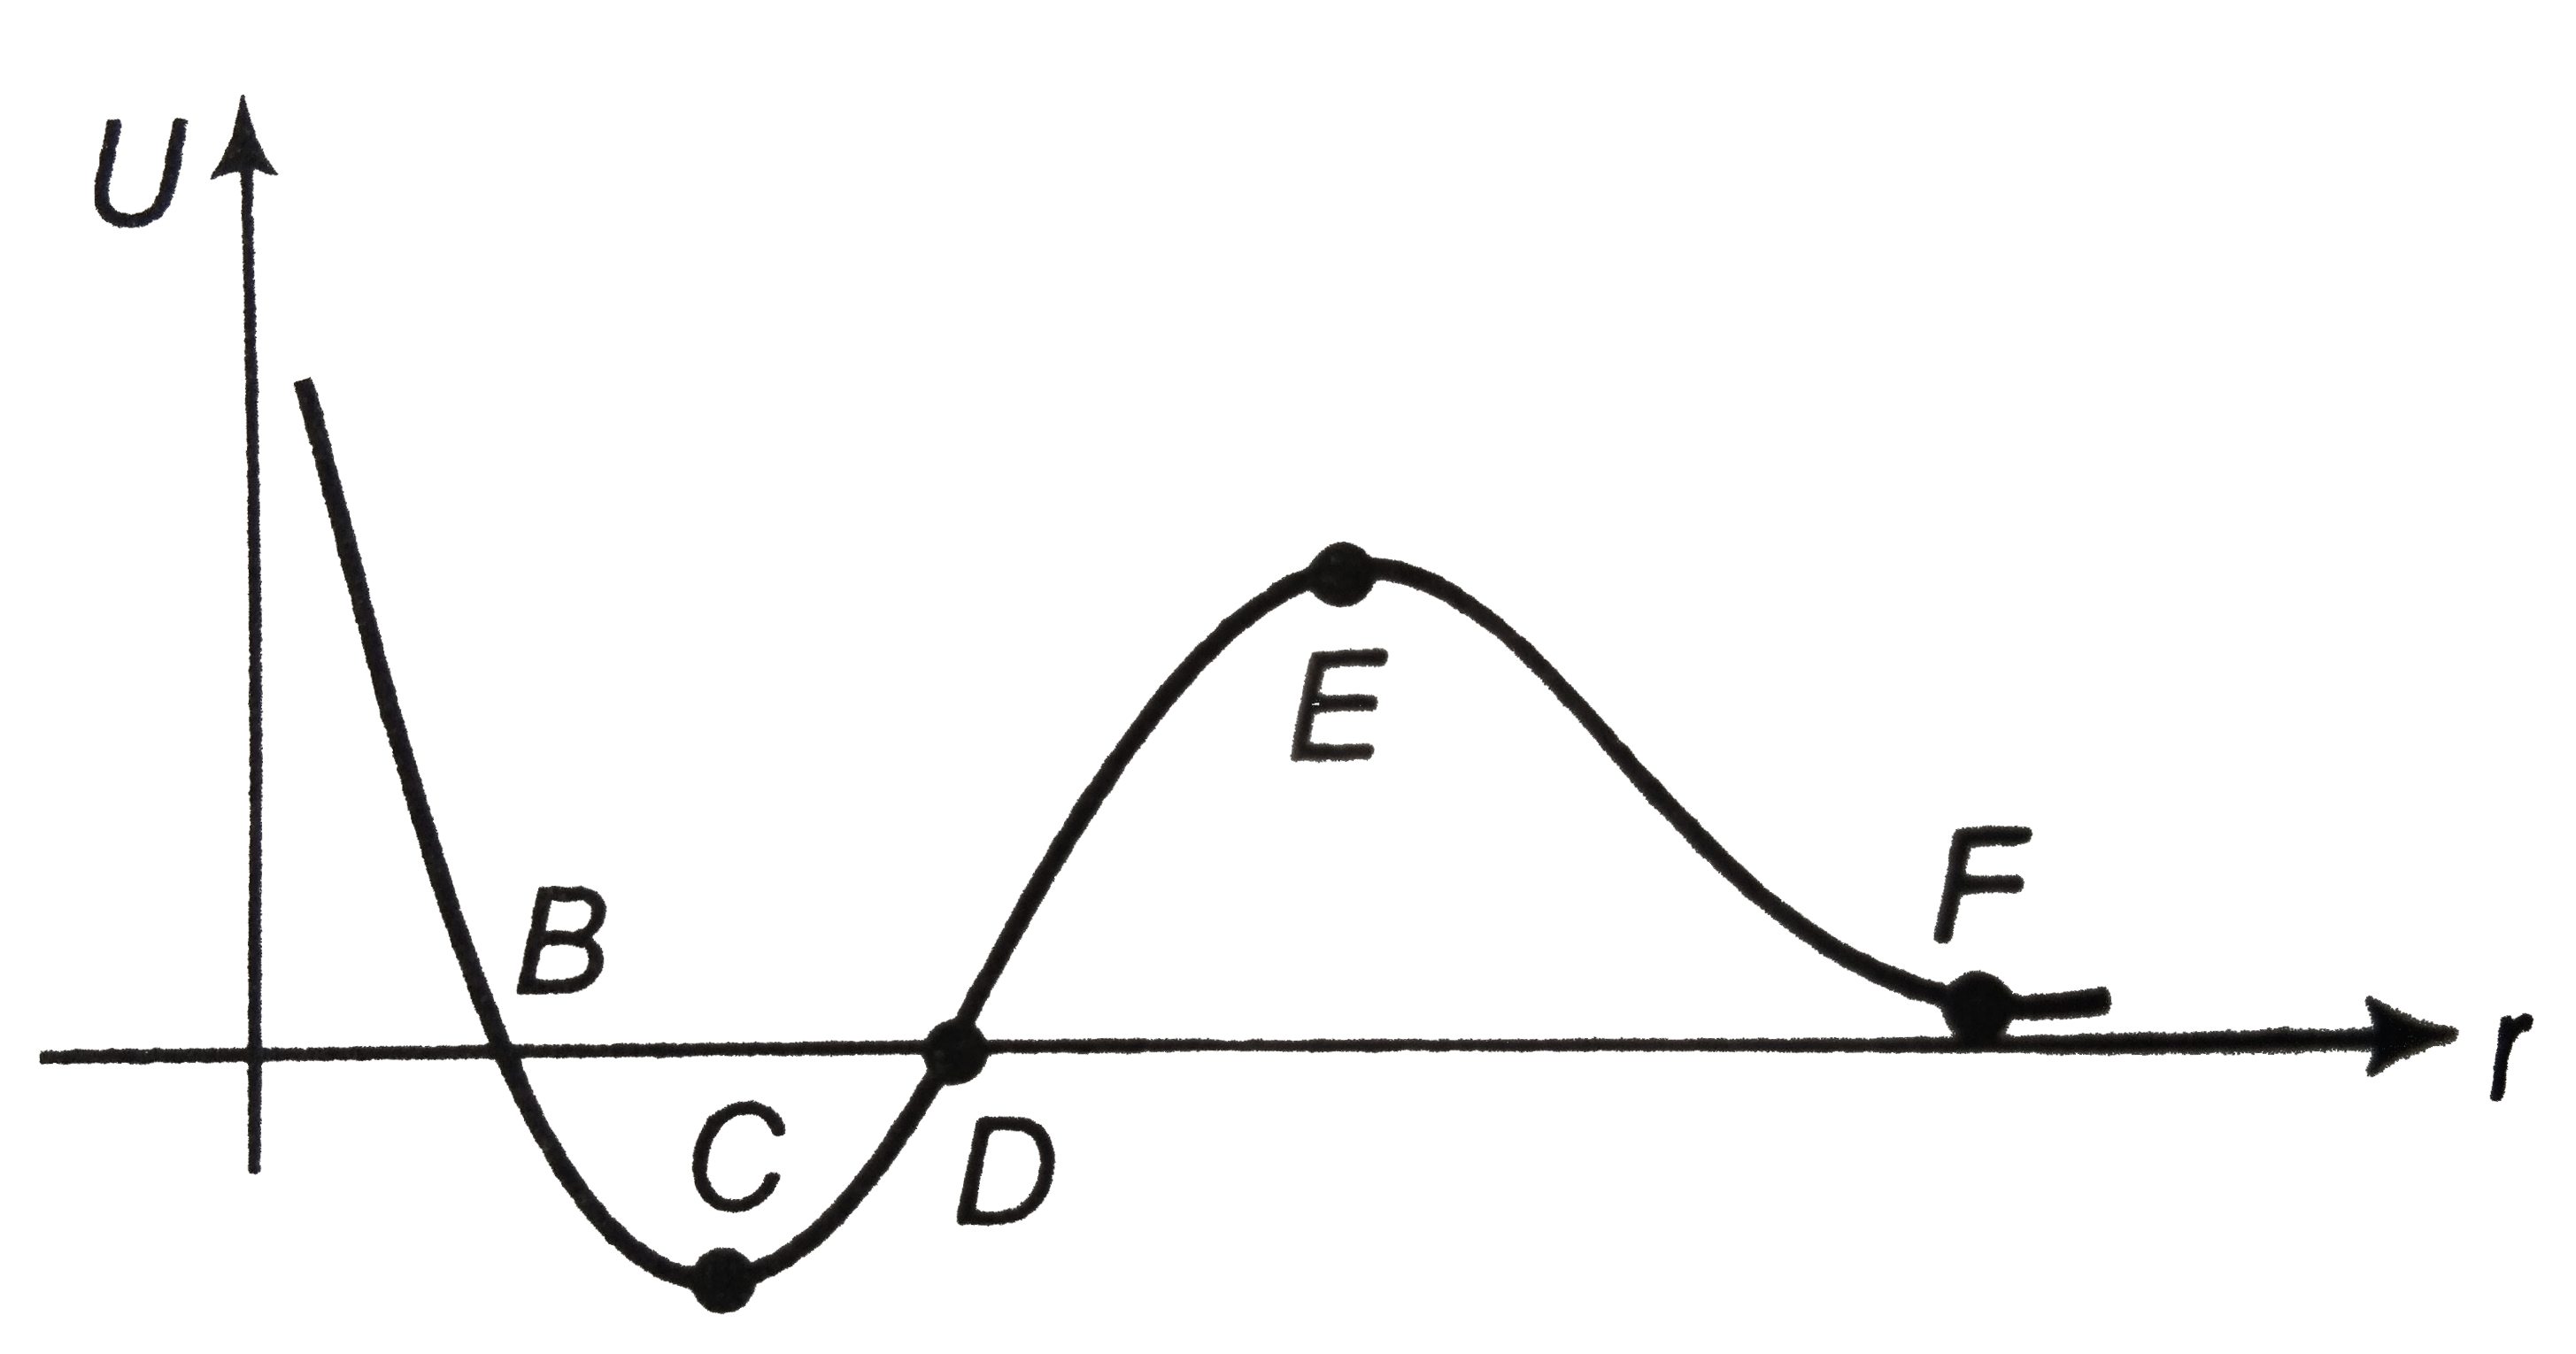
B and D are equilibrium points
C is a point of stable equilibrium
The force of stable equilibrium between the two particles is attracive between points C and D and repulsive between D and E .
The force of interaction between particles is repulsive between points E and F.
The correct Answer is:C
At C, potential energy is minimum. So, it is stable equilibrium position.
F=−dUdr=−(Slope of U-graph)
Negative force means attraction and positive force means repulsion.
Similar Questions
Knowledge Check
- Question 1 - Select One
Electric potential energy V between two charges varies with distance (r) between them as
AV∝rBV∝1rCV∝r2DV∝1r2 - Question 2 - Select One
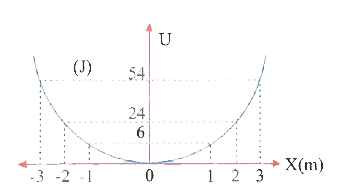
Figure given below shows the variation of potential energy function U(x), corresponding to a particle lying in a one dimensional force field. The force acting on the particle at x = 2 m is:
 A−12NB−24NC−16ND−8N
 - Question 3 - Select One or More
The following plot shows the variation of potential energy (U) of a system versus position (x). From the graph we can interpret that :
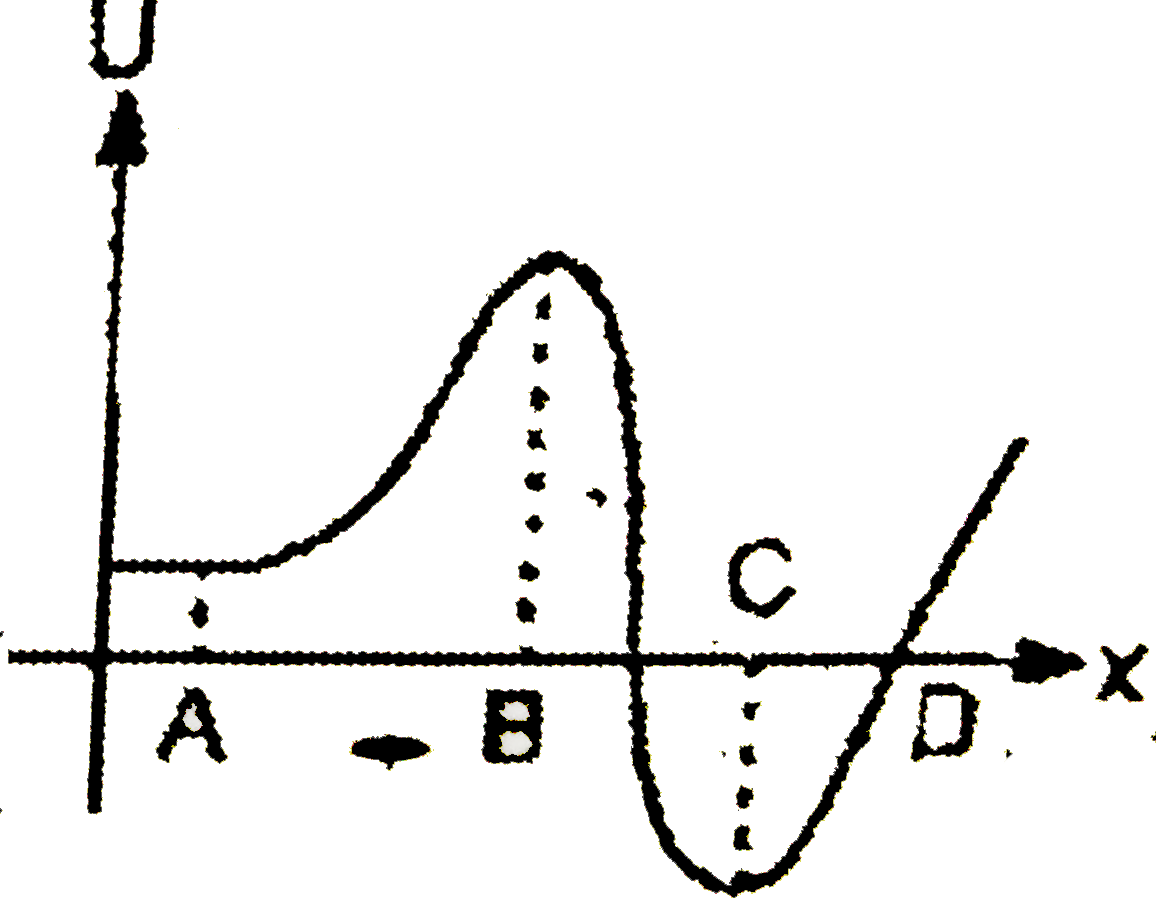 APoint D is position of neutral equilibriumBPoint B is position of unstable equilibriumCPoint C is position of stable equilibriumDPoint A is position of neutral equilibrium
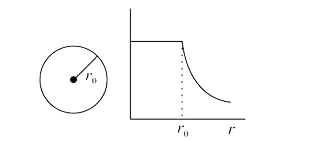
The given graph shows variation (with distance r from centre) of:
 View Solution
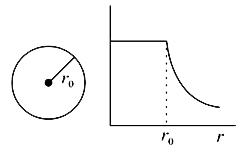
The given graph shows variation (with distance r from centre) of:
 View Solution
(a) Draw a plot showing the variation of potential energy of a pair of nucleons as a function of their separation. Mark the regions where the nuclear force is (i) attractive, and (ii) repulsive.
(b) In the nuclear reaction
n+ 23592U→ a54Xe+ 97bSr+2n determine the values of ‘a’ and ‘b’.View SolutionDraw a graph showing the variation of potential energy between a pair of nucleons as a function of their separation. Indicate the regions in which the nuclear force is (i) attractive, (ii) repulsive.
View SolutionVariation in force between two charges and their distance is given by:
View Solution

