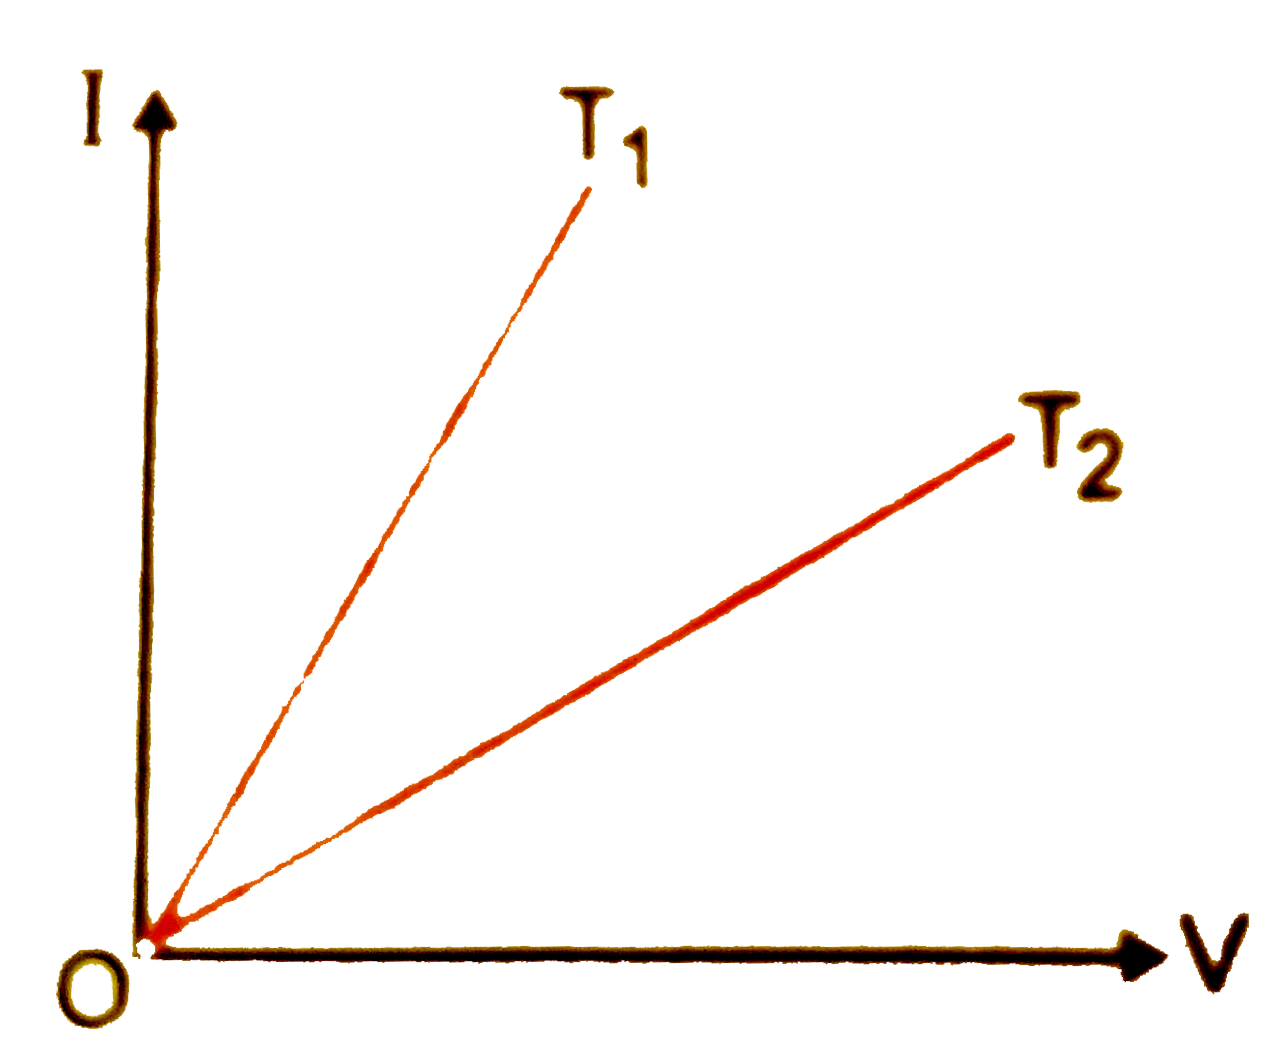
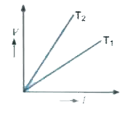
The current voltage graphs for a given metalic wire two different temperature T1 and T2 are shown in figure The temperature T2 is greater than T1. Is this statement true or false?
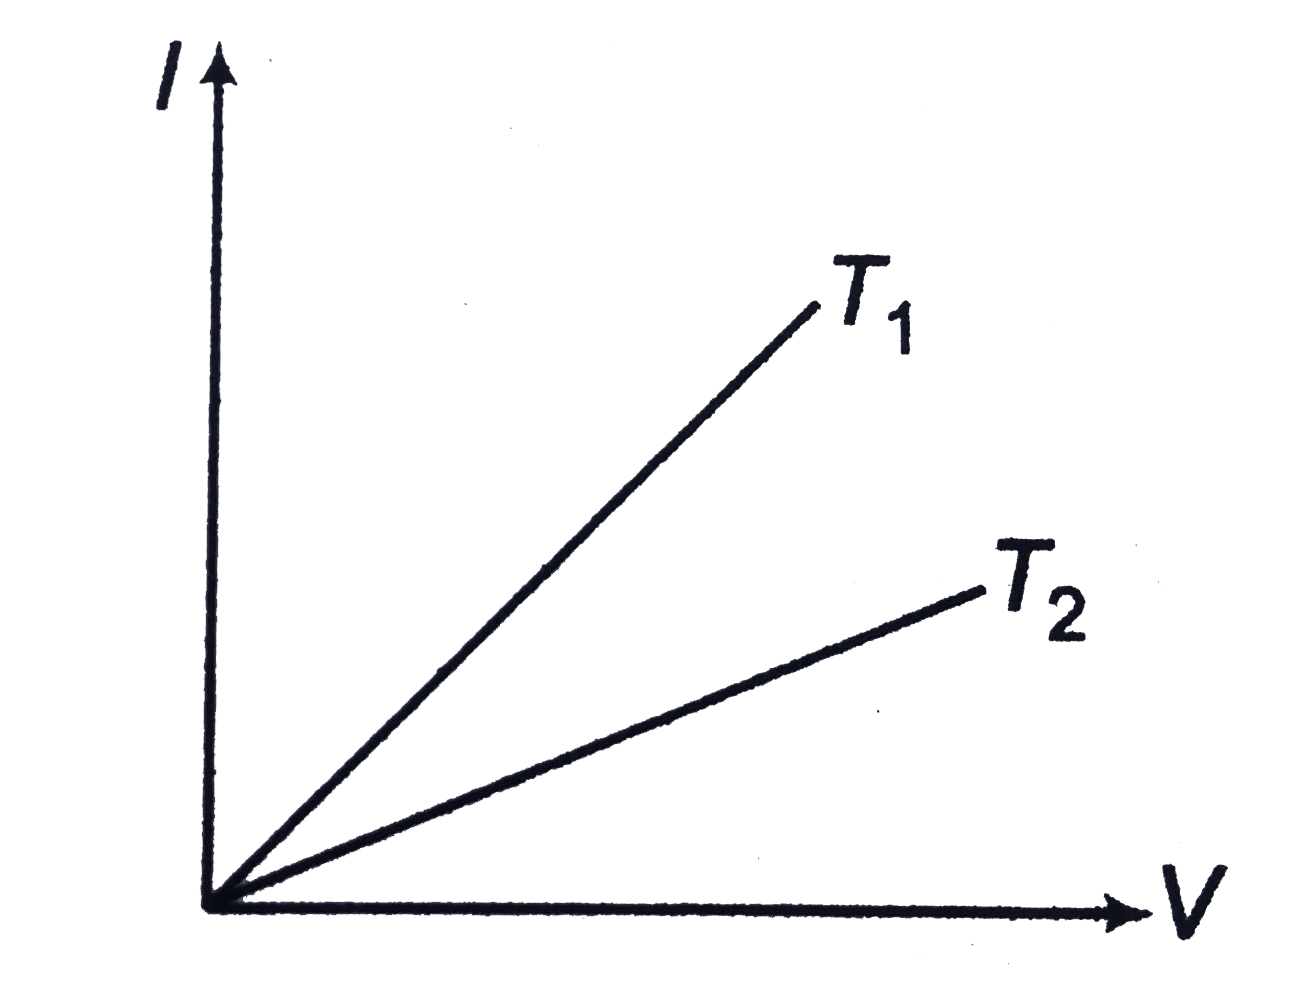
IV=Slope of given graph=1R
or R=1Slope⇒(slope)T2<(slope)T1→1(Slope)T2>1((Slope))T1
Resistant of as metallic wire increases with increase in temperature.
or RT2>RT1orT2>T1
Therefore the statement is true.
Topper's Solved these Questions
- BOOK - DC PANDEYCHAPTER - CURRENT ELECTRICITYEXERCISE - Example Type 12videos
CURRENT ELECTRICITY
- BOOK - DC PANDEYCHAPTER - CURRENT ELECTRICITYEXERCISE - Example Type 21videos
CURRENT ELECTRICITY
- BOOK - DC PANDEYCHAPTER - COMMUNICATION SYSTEMEXERCISE - Subjective11videos
COMMUNICATION SYSTEM
- BOOK - DC PANDEYCHAPTER - ELECTROMAGNETIC INDUCTIONEXERCISE - Medical entrances gallery25videos
ELECTROMAGNETIC INDUCTION
Similar Questions
The current - voltage graphs for a given metallic wire at two different temperatures T1andT2 are shown in the figure.
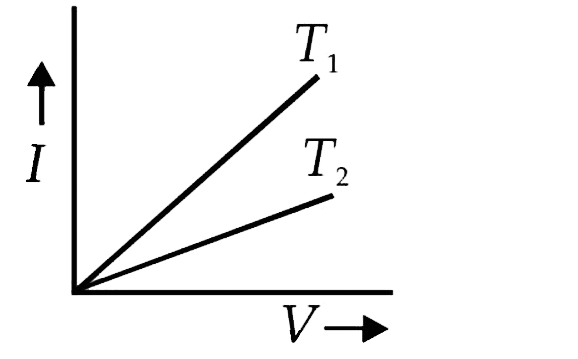
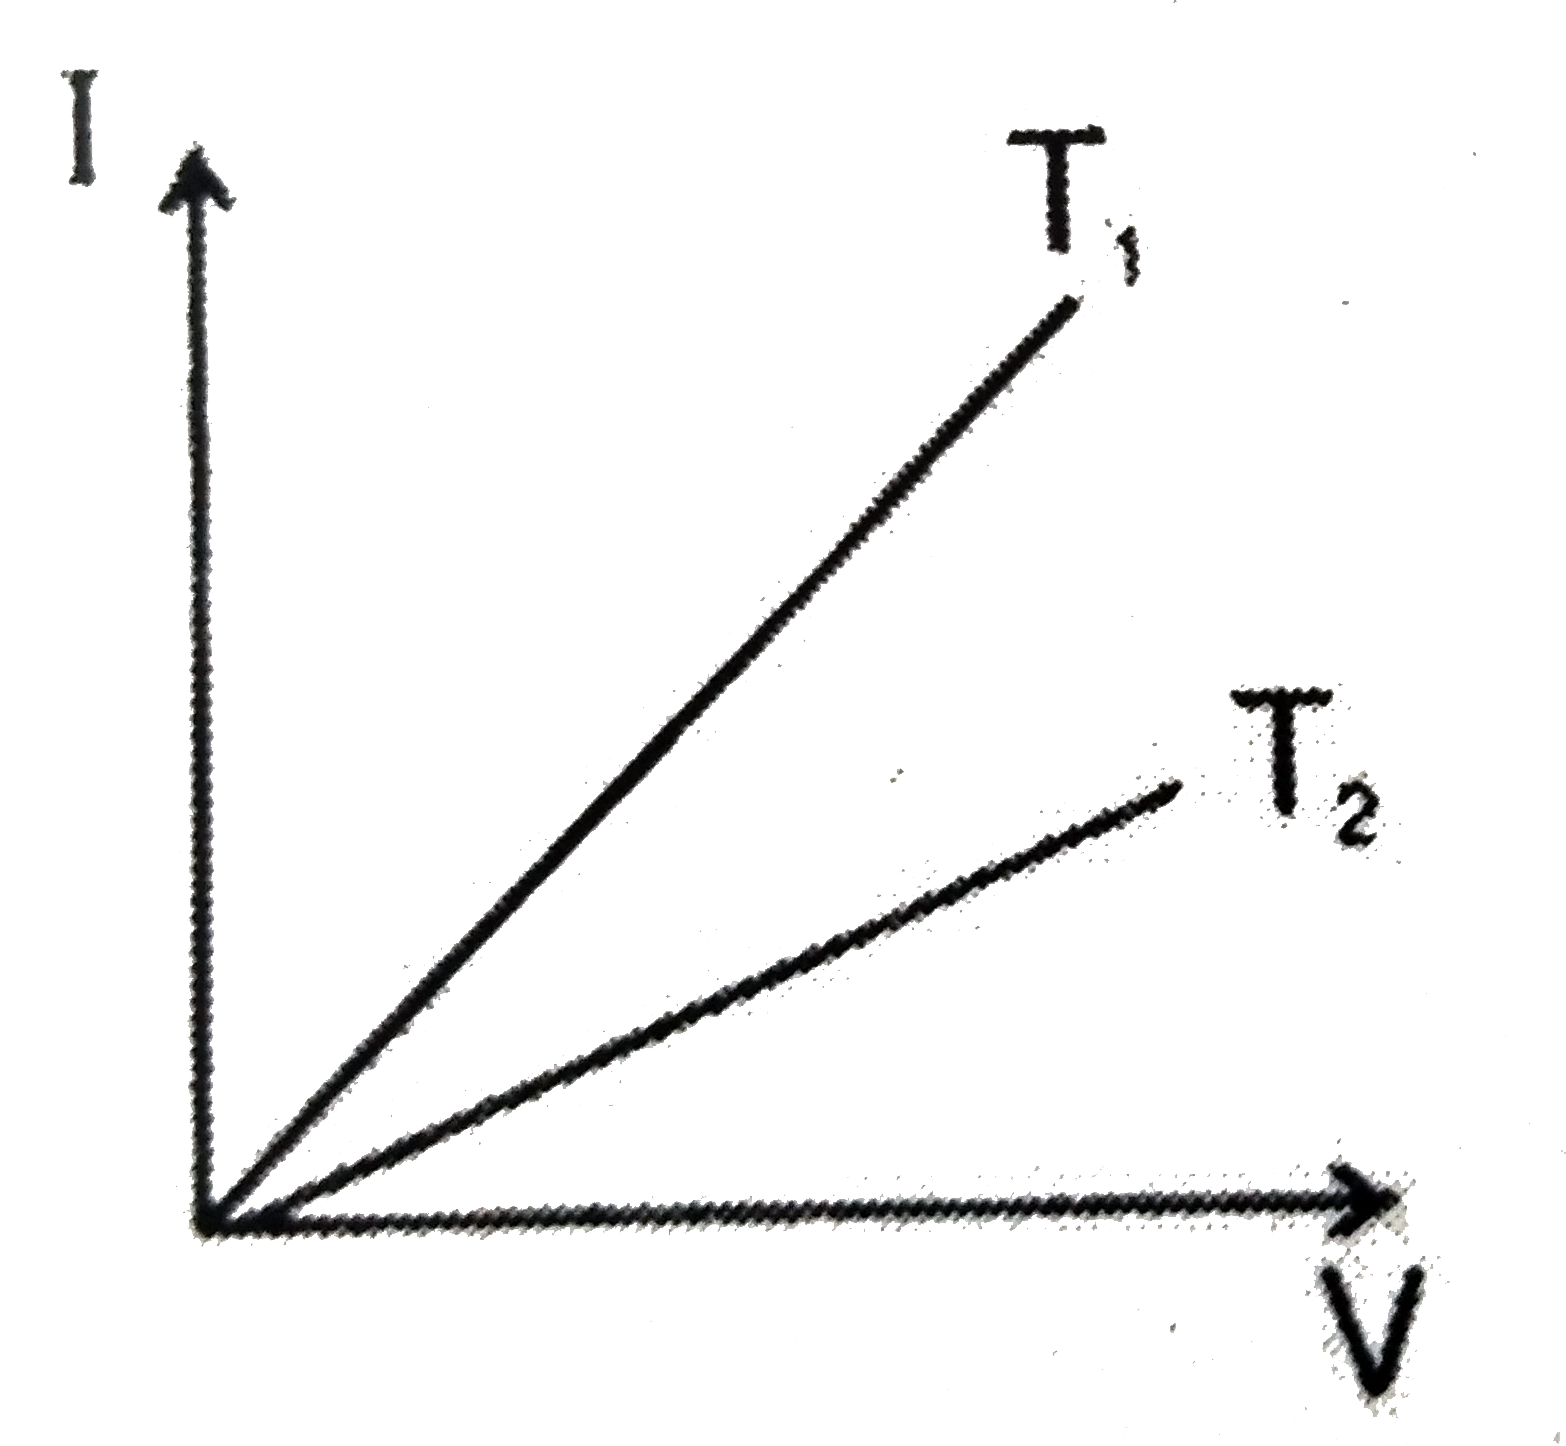
The temperature T2 is greater than T1.View SolutionThe current-coltage graphs for a given metallic wire at two differenct tempeature T1 and T2 are shown in the figure. Which one is higher, T1 or T2
 View Solution
Knowledge Check
- Question 1 - Select One
The current (I) and voltage (V) graphs for a given metallic wire at two different temperature (T1) and (T2) are shown in fig. It is concluded that
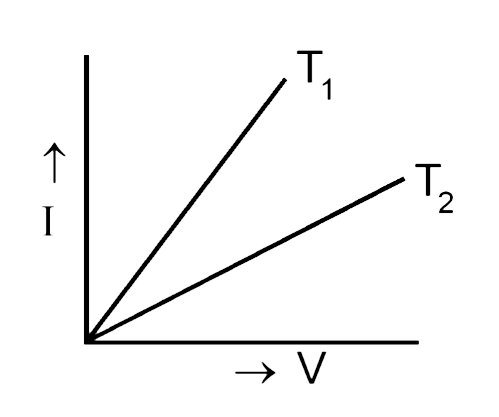 AT1=T2BT1>T2CT1<T2DNone of these
 - Question 2 - Select One
The current (I) and voltage (V) graphs for a given metallic wire at two different temperature (T1) and (T2) are shown in fig. It is concluded that
 AT1>T2BT1<T2CT1=T2DT1=2T2
 - Question 3 - Select One
The current I and voltage V variations for a given metallic wire at tow different temperature T1andT2 are shown in the figure. Then which one of the following is correct
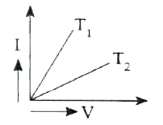 AT1>T2BT1<T2CT1=T2DT1=2T2
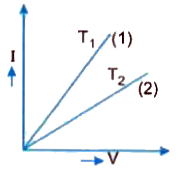
V- I graph for a metallic wire at two different temperature T1 and T2 is shown in figure. Which of the two temperature is higher and why?
 View Solution
I-V graph for a given metallic wire at two temperatures T1 and T2 is as shown in Fig. Which of the two temperatures is lower and why?
 View Solution
I-V graph for a metallie wire at two different tempearture, T1andT2 is as shown in the figure. Which of the two temperatures is lower and why ?
 View Solution
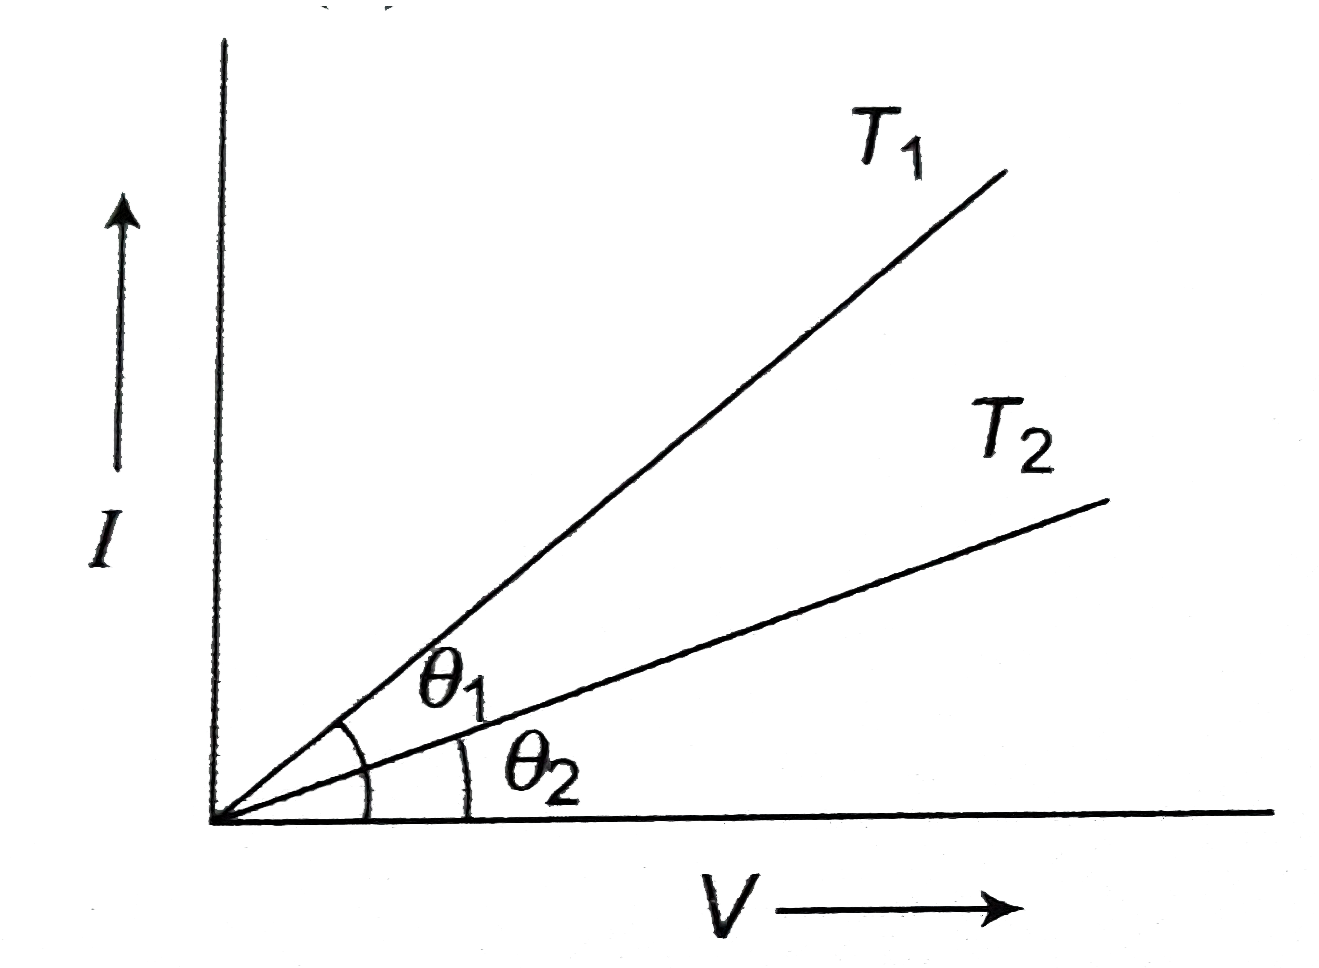
The current-voltage graph for a given speciment at two different temperatures T1 and T2 are shown in the figure. Is the specimen ohmic ?
(b) At which temperature resistance is greater ?
( c) Which temperature is higher ?
 .View Solution
The voltage-current (V-I) graph of a metallic conductor at two different temperature T1 and T2 is shown in figure. At which temperature is the resistance higher?
 View Solution

