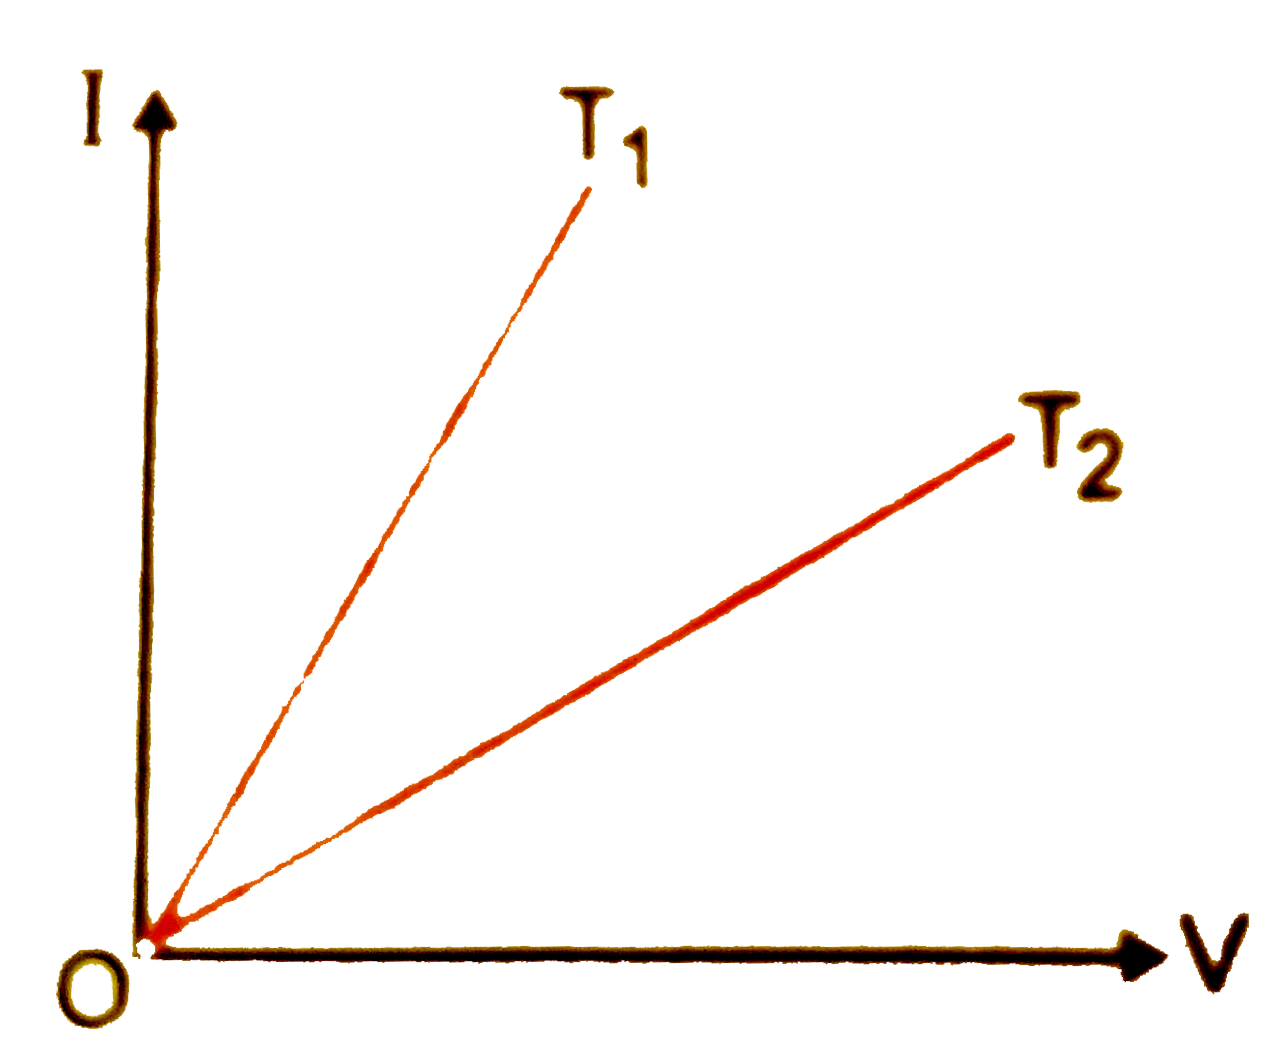
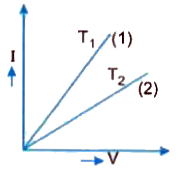
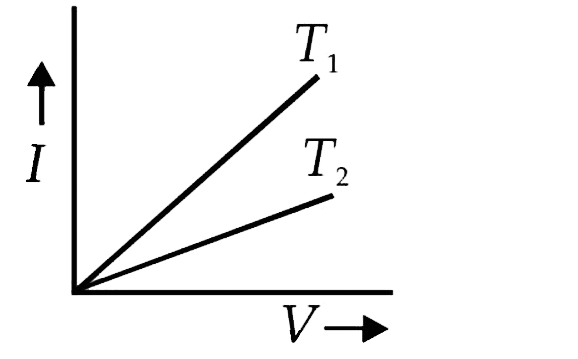
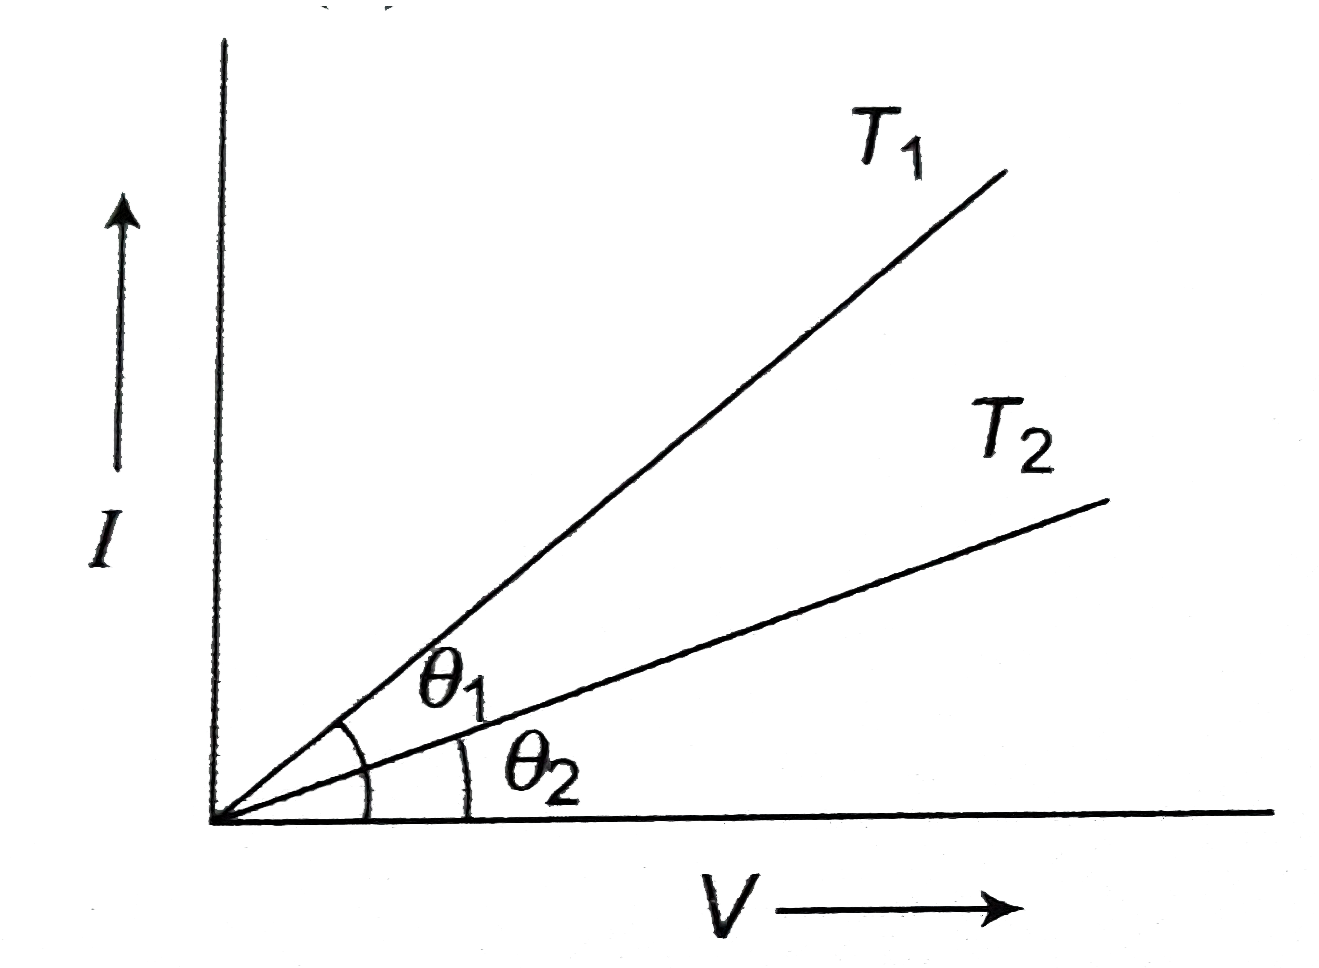
I-V graph for a metallie wire at two different tempearture, T1andT2 is as shown in the figure. Which of the two temperatures is lower and why ?

V=IR
For given voltage 1α1R
Resistance increase with increase of temperature and temperature is inversely proportional to voltage
T1<T2
Topper's Solved these Questions
- BOOK - XII BOARDS PREVIOUS YEARCHAPTER - XII BOARDSEXERCISE - section B5videos
XII BOARDS
- BOOK - XII BOARDS PREVIOUS YEARCHAPTER - XII BOARDSEXERCISE - section C10videos
XII BOARDS
- BOOK - XII BOARDS PREVIOUS YEARCHAPTER - XII BOARDSEXERCISE - [SET - III, DELHI BOARD]6videos
XII BOARDS
- BOOK - XII BOARDS PREVIOUS YEARCHAPTER - SAMPLE PAPER 2019EXERCISE - SECTION D6videos
SAMPLE PAPER 2019
Similar Questions
Knowledge Check
- Question 1 - Select One
The current (I) and voltage (V) graphs for a given metallic wire at two different temperature (T1) and (T2) are shown in fig. It is concluded that
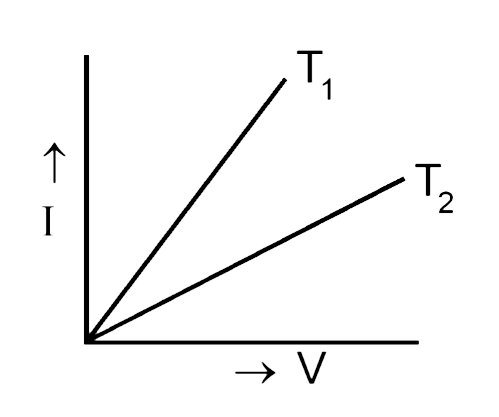 AT1=T2BT1>T2CT1<T2DNone of these
 - Question 2 - Select One
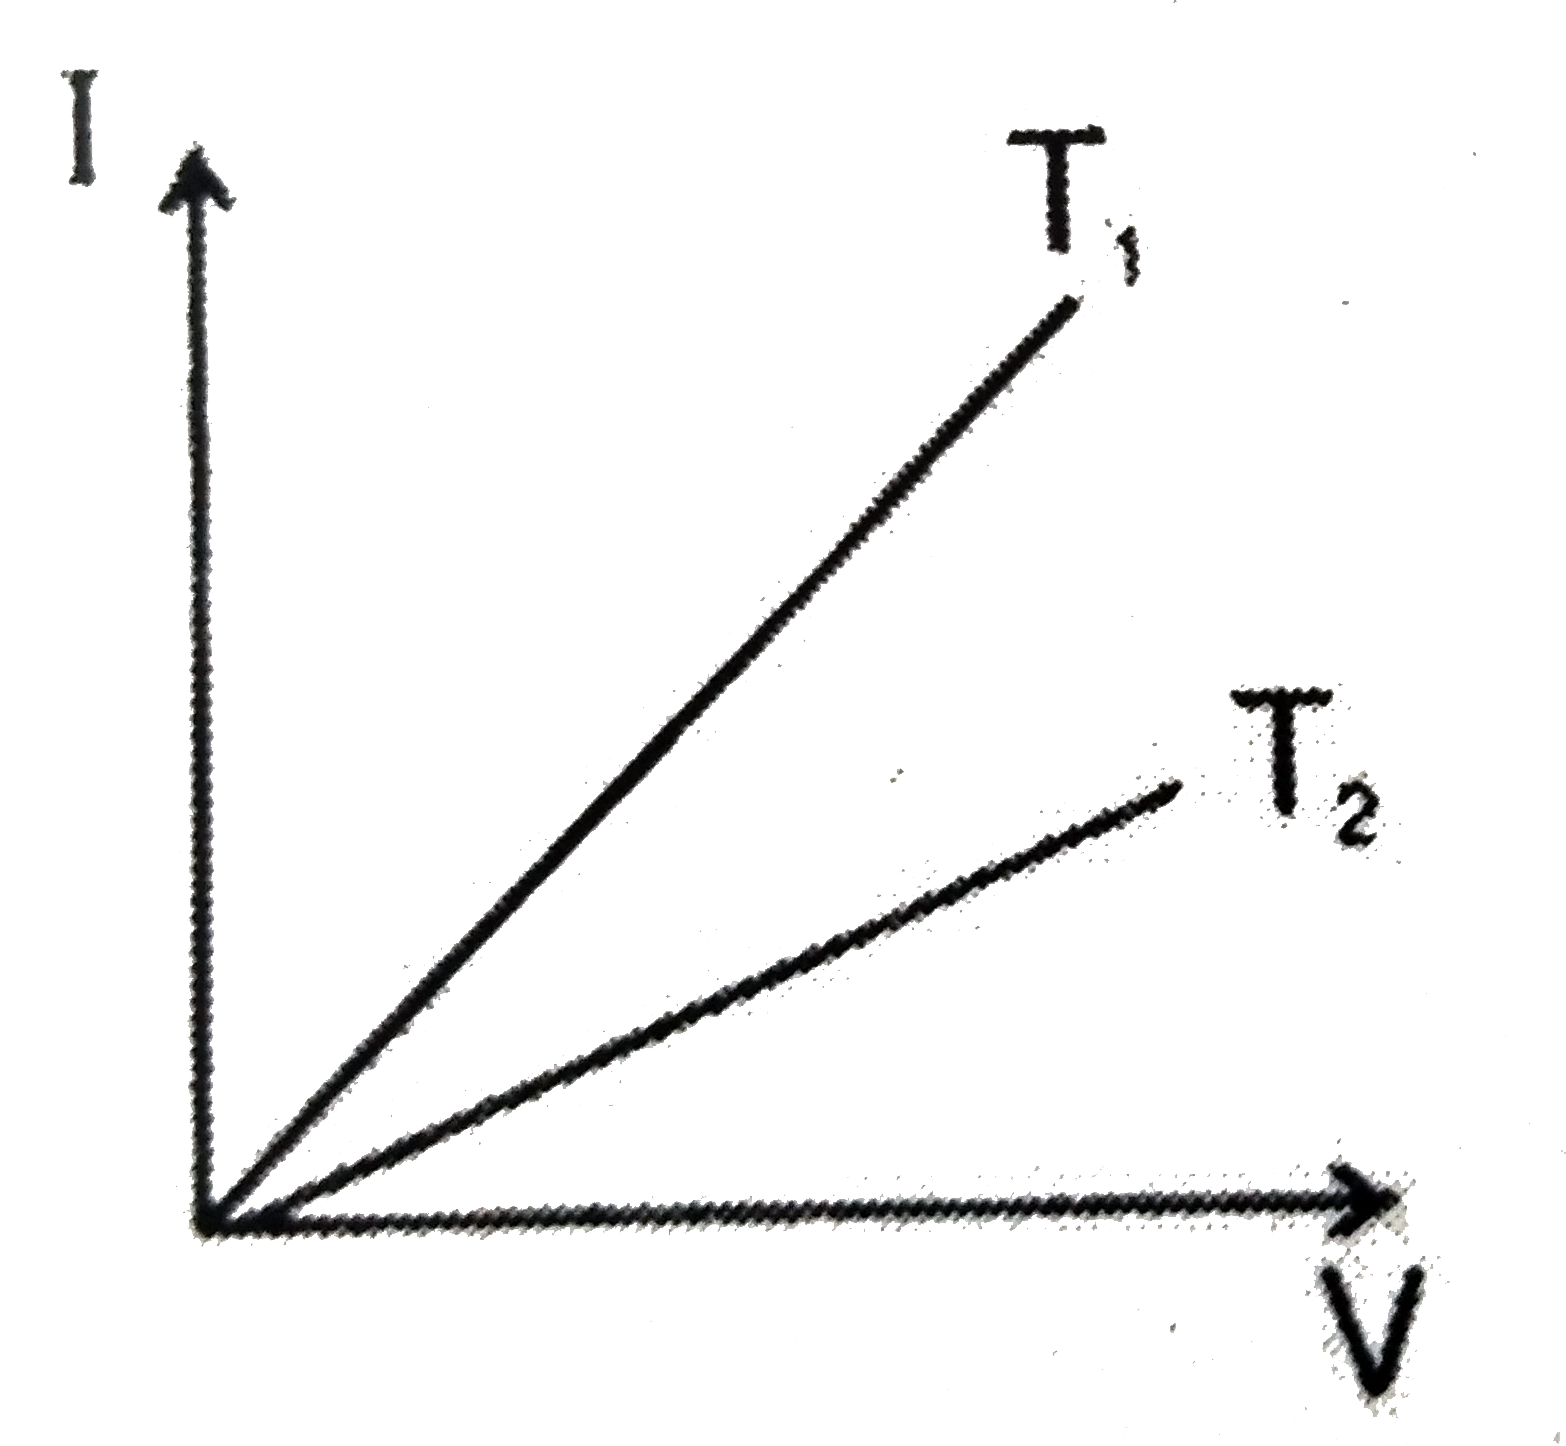
The current I and voltage V variations for a given metallic wire at tow different temperature T1andT2 are shown in the figure. Then which one of the following is correct
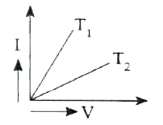 AT1>T2BT1<T2CT1=T2DT1=2T2
 - Question 3 - Select One
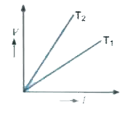
The voltage V and current I v graphs for a conductor at two different temperatures T1andT2 are shown in the figure. The relation between T1andT2 is
 AT1>T2BT1<T2CT1=T2DT1=1T2
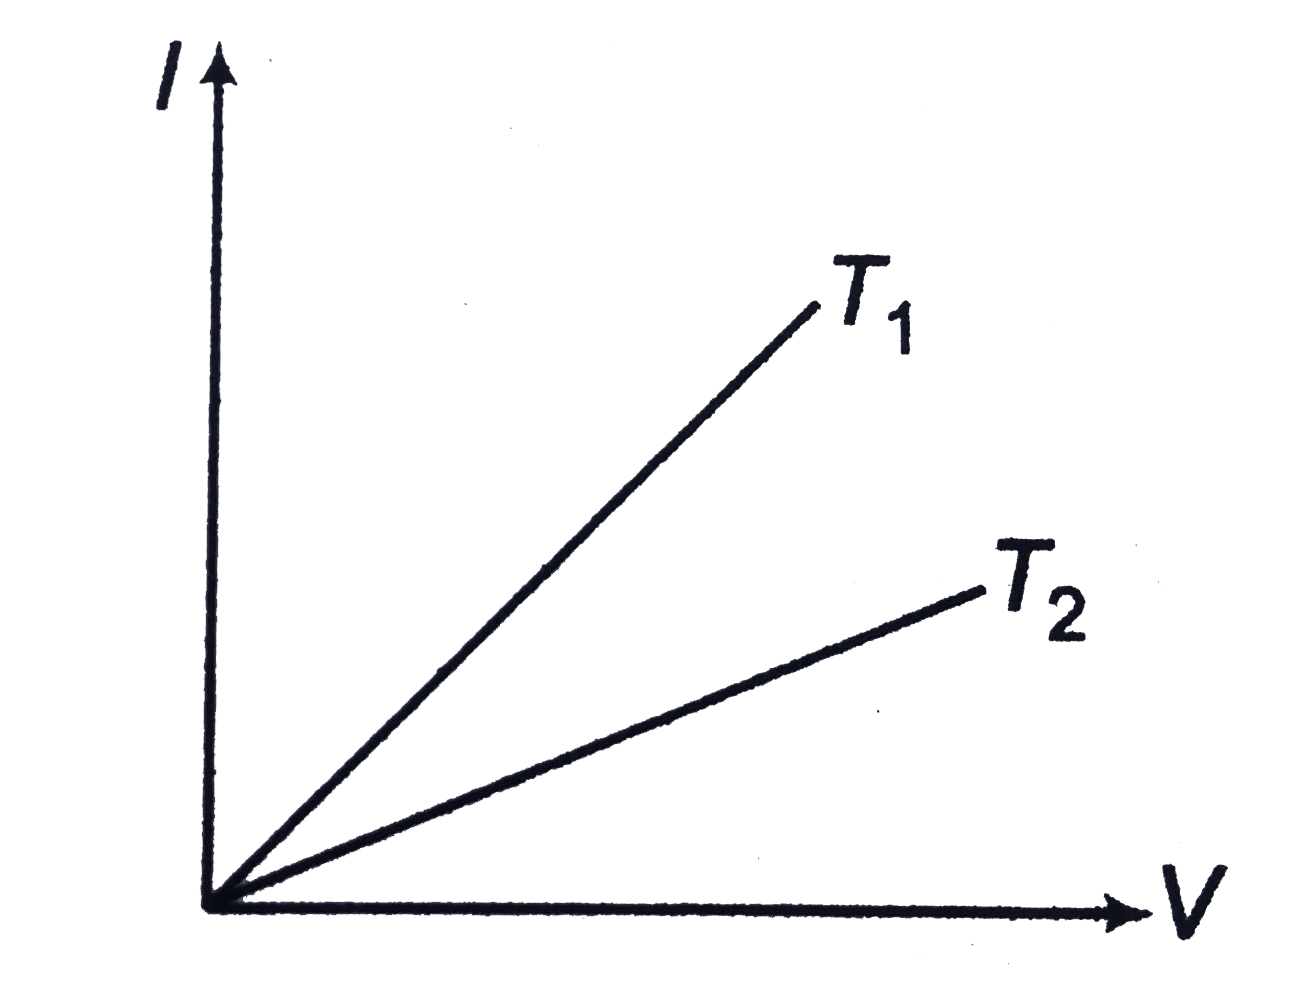
The current - voltage graphs for a given metallic wire at two different temperatures T1andT2 are shown in the figure.
The temperature T2 is greater than T1.View SolutionThe voltage-current (V-I) graph of a metallic conductor at two different temperature T1 and T2 is shown in figure. At which temperature is the resistance higher?
 View Solution
The current-coltage graphs for a given metallic wire at two differenct tempeature T1 and T2 are shown in the figure. Which one is higher, T1 or T2
 View Solution
The current voltage graphs for a given metalic wire two different temperature T1 and T2 are shown in figure The temperature T2 is greater than T1. Is this statement true or false?
 View Solution
The current-voltage graph for a given speciment at two different temperatures T1 and T2 are shown in the figure. Is the specimen ohmic ?
(b) At which temperature resistance is greater ?
( c) Which temperature is higher ?
 .View Solution


