Identify the graph which correctly reperesents the variation of capacitive reactance XC with frequency
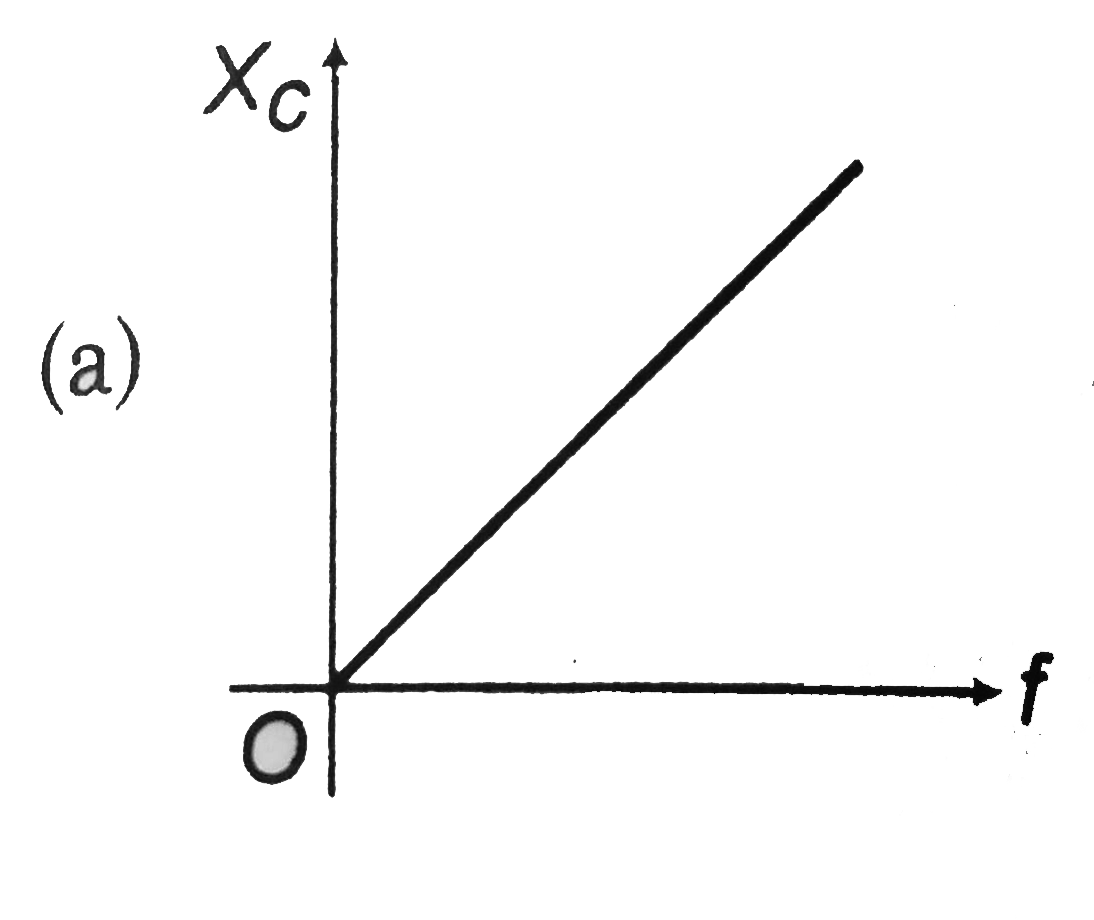
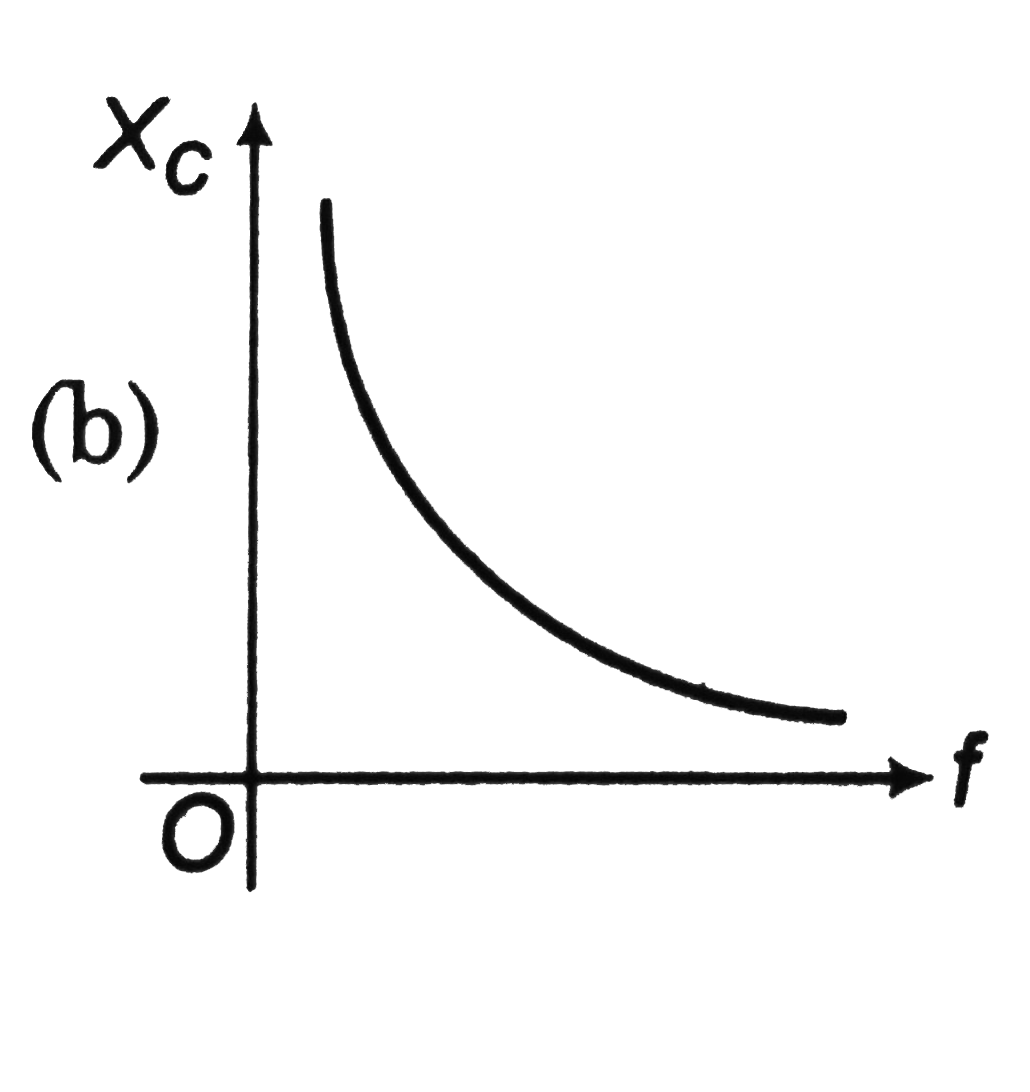
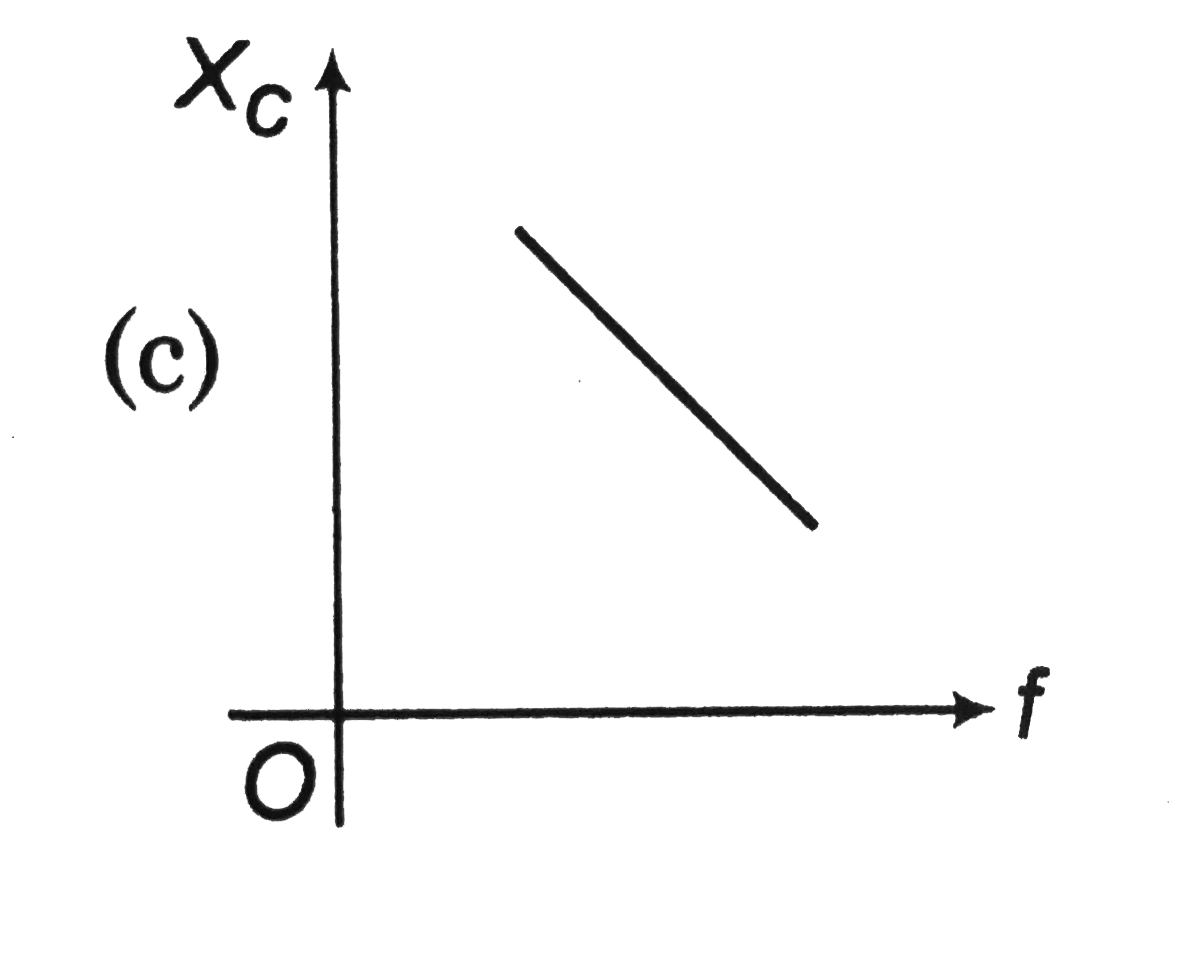
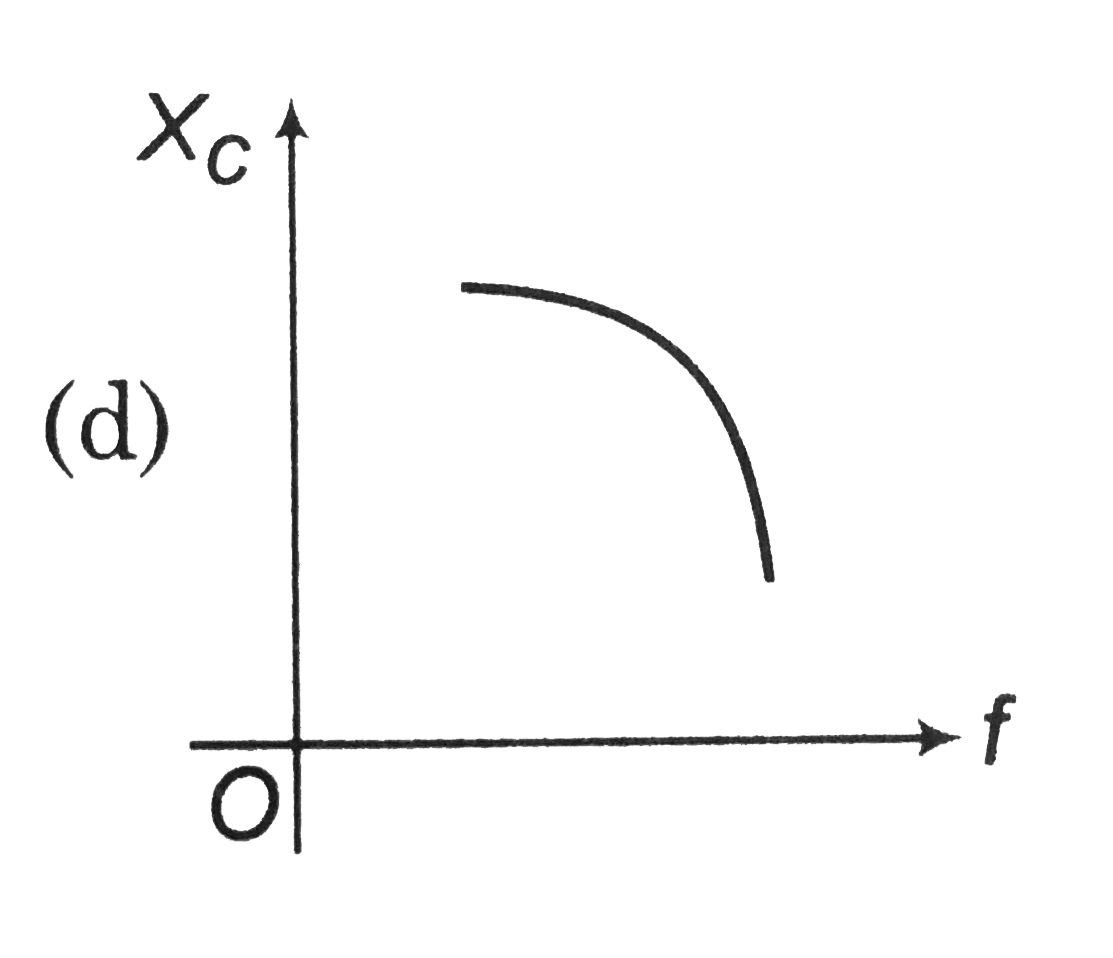
The correct Answer is:B
XC=1ωC=12πfC or XC∝1f
i.e. XC versus f graph is a rectangular hyperbola.
Topper's Solved these Questions
- BOOK - DC PANDEYCHAPTER - ALTERNATING CURRENTEXERCISE - Level - 1 Subjective6videos
ALTERNATING CURRENT
- BOOK - DC PANDEYCHAPTER - ALTERNATING CURRENTEXERCISE - Level- 2 Single Correct18videos
ALTERNATING CURRENT
- BOOK - DC PANDEYCHAPTER - ALTERNATING CURRENTEXERCISE - Level 1 Assertion-Reason11videos
ALTERNATING CURRENT
- BOOK - DC PANDEYCHAPTER - ATOMSEXERCISE - MEDICAL ENTRANCES GALLERY42videos
ATOMS
Similar Questions
What is the value of capacitive reactance (XC) in DC circuits ?
View SolutionExplain the term 'capacitive reactance'.Show graphically the variation of capacitive reactance with frequency of the applied alternating voltage.
An a.c. voltage E=E0sinωt is applied a across a pure capacitor C.Show mathematically that the current flowing through it leads the applied voltage by a phase angle of π/2View Solution
Knowledge Check
- Question 1 - Select One
Identify the graph which correctly represent the Moseley's law-
A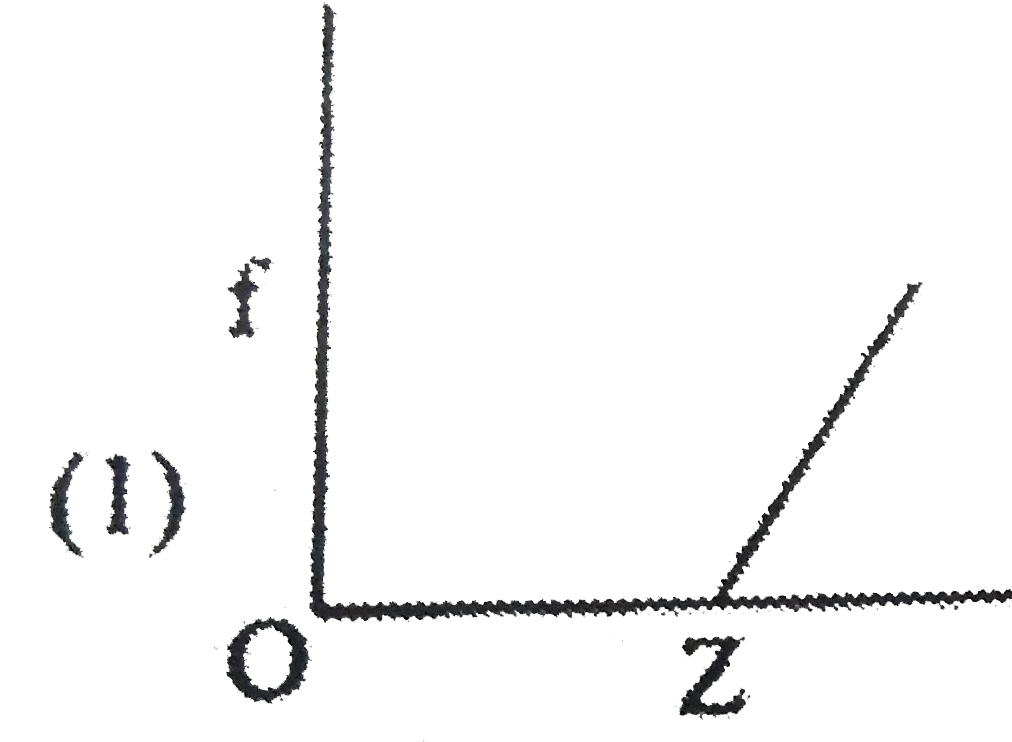 B
B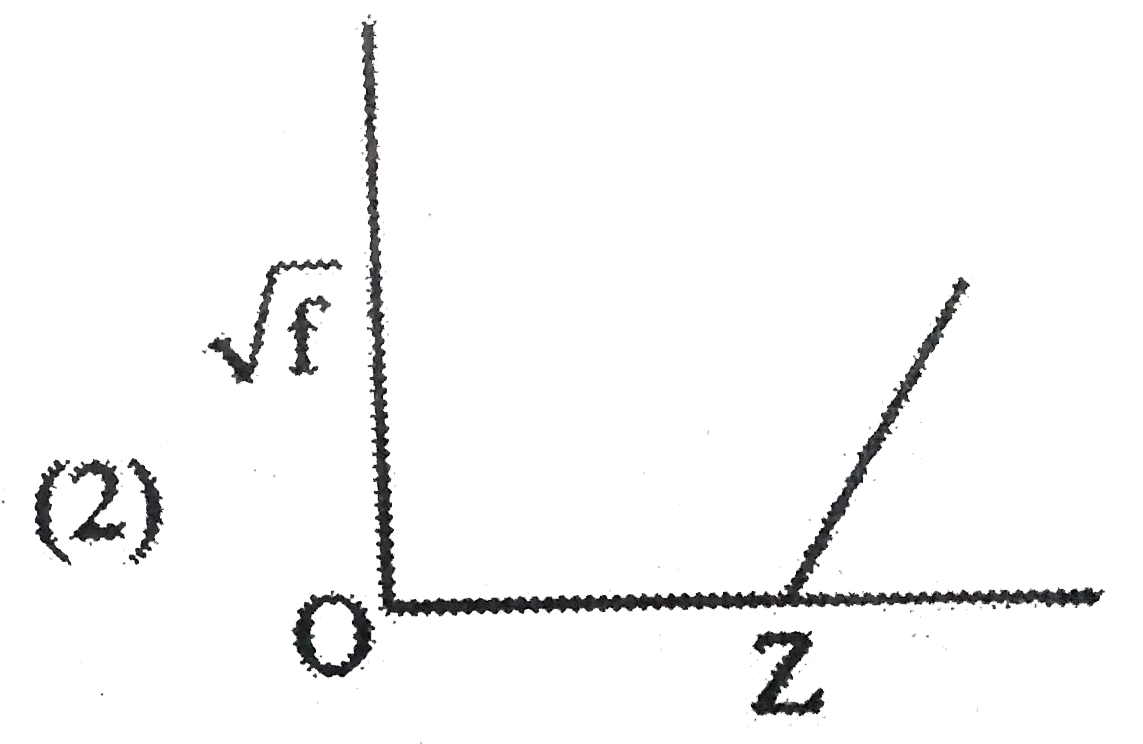 C
C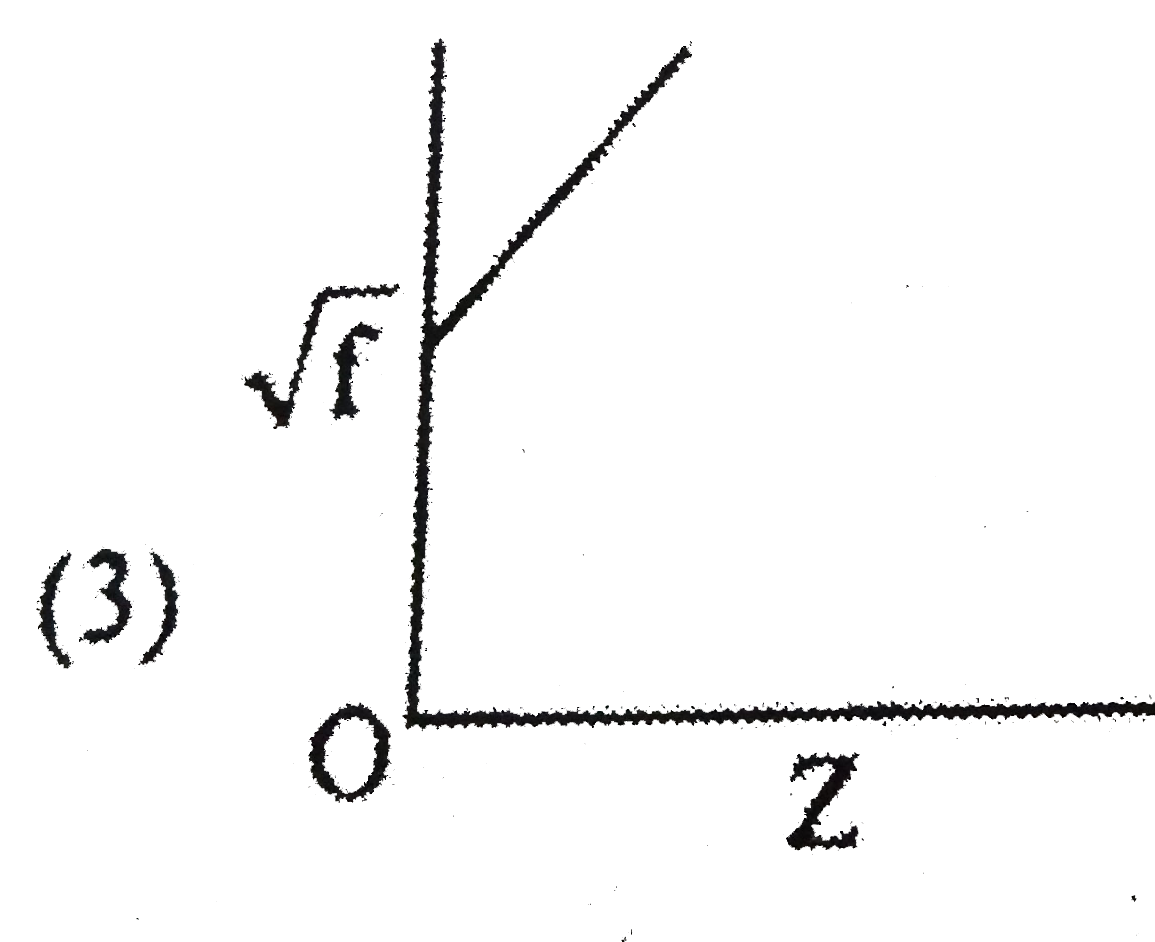 D
D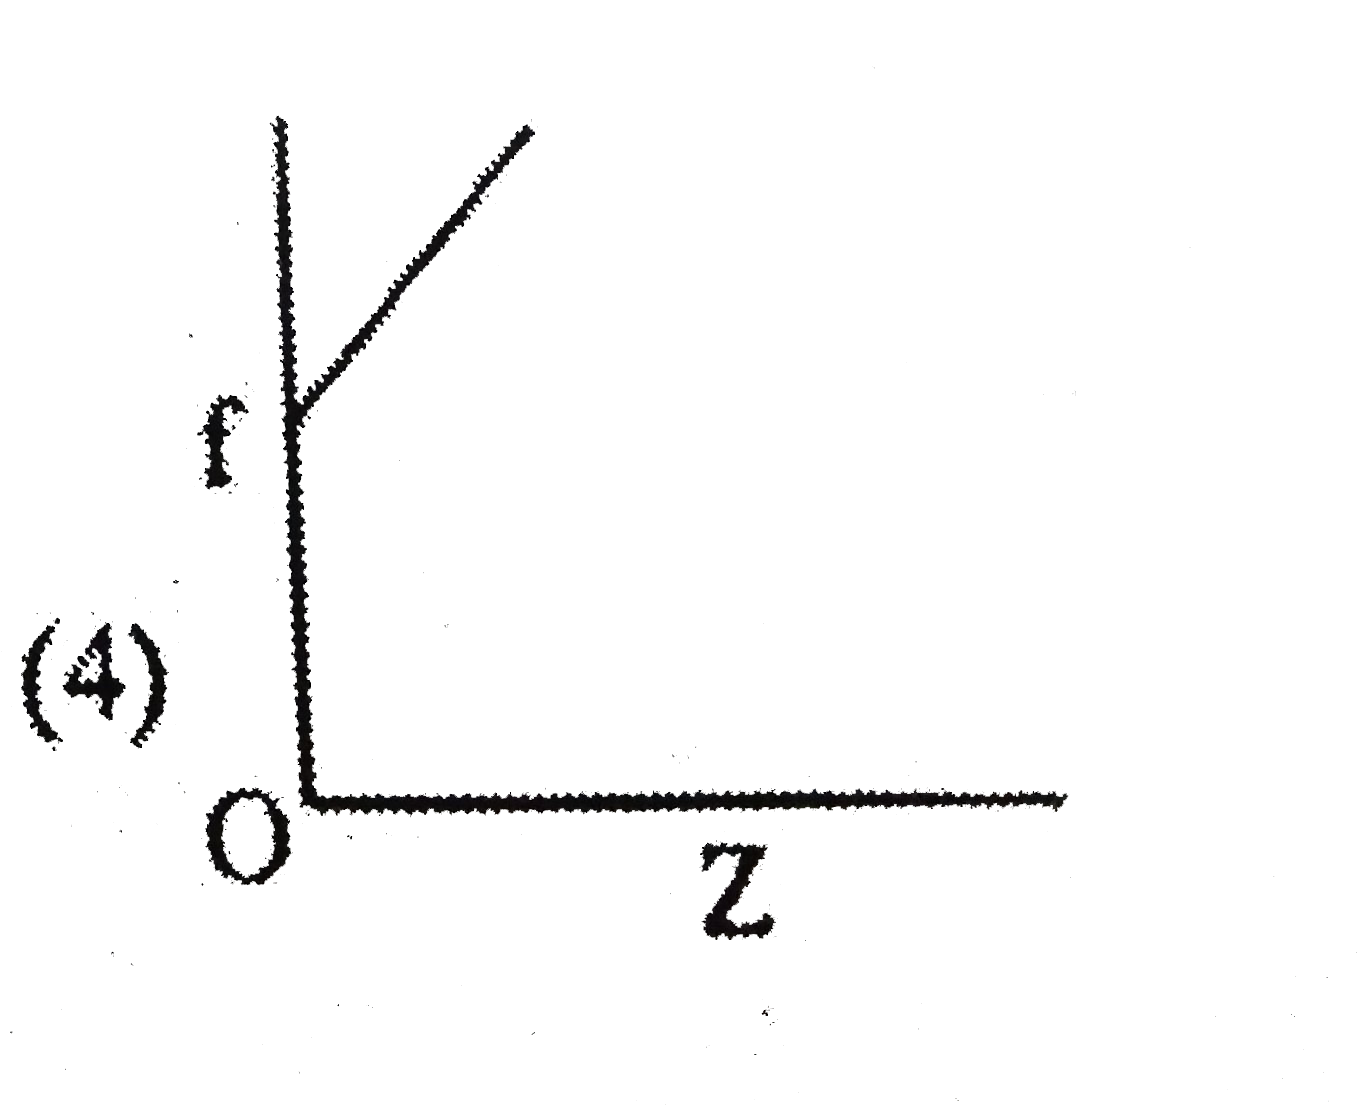
- Question 2 - Select One
Which one of the follwing represents the variation of capacitive reactance (XC) with the frequency (v) of the voltage source ? .
A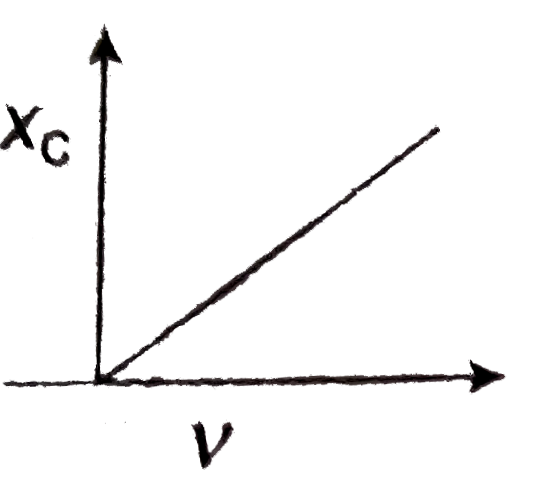 B
B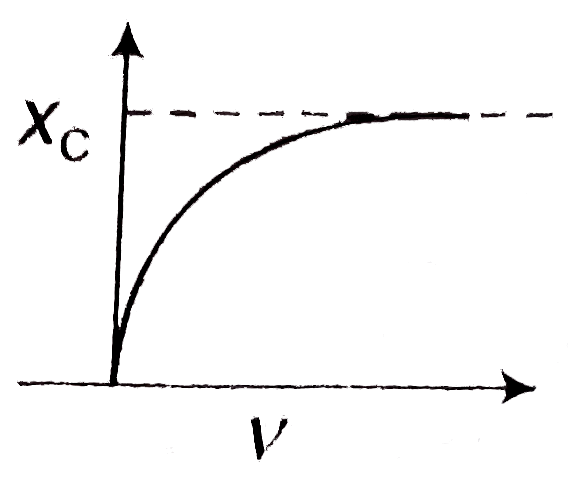 C
C D
D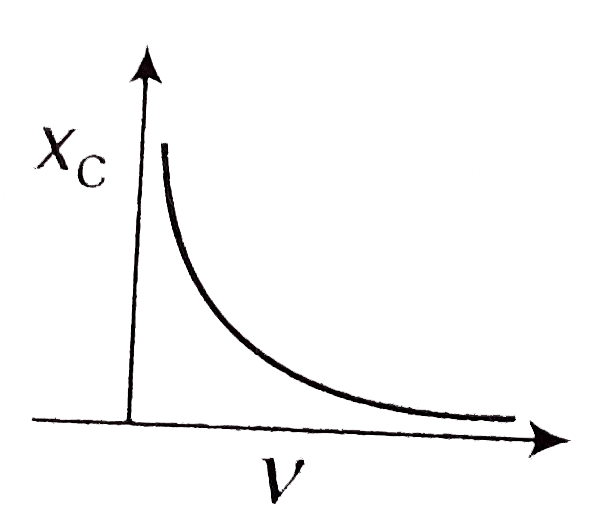
- Question 3 - Select One
Which of the following graphs represent the correct variation of inductive reactance XL with frequency υ?
A B
B C
C D
D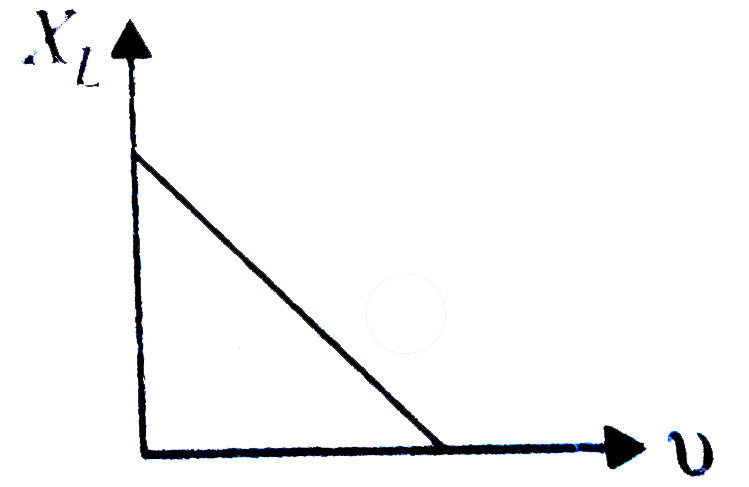
How capacitive reactance depends on the frequency of AC ?
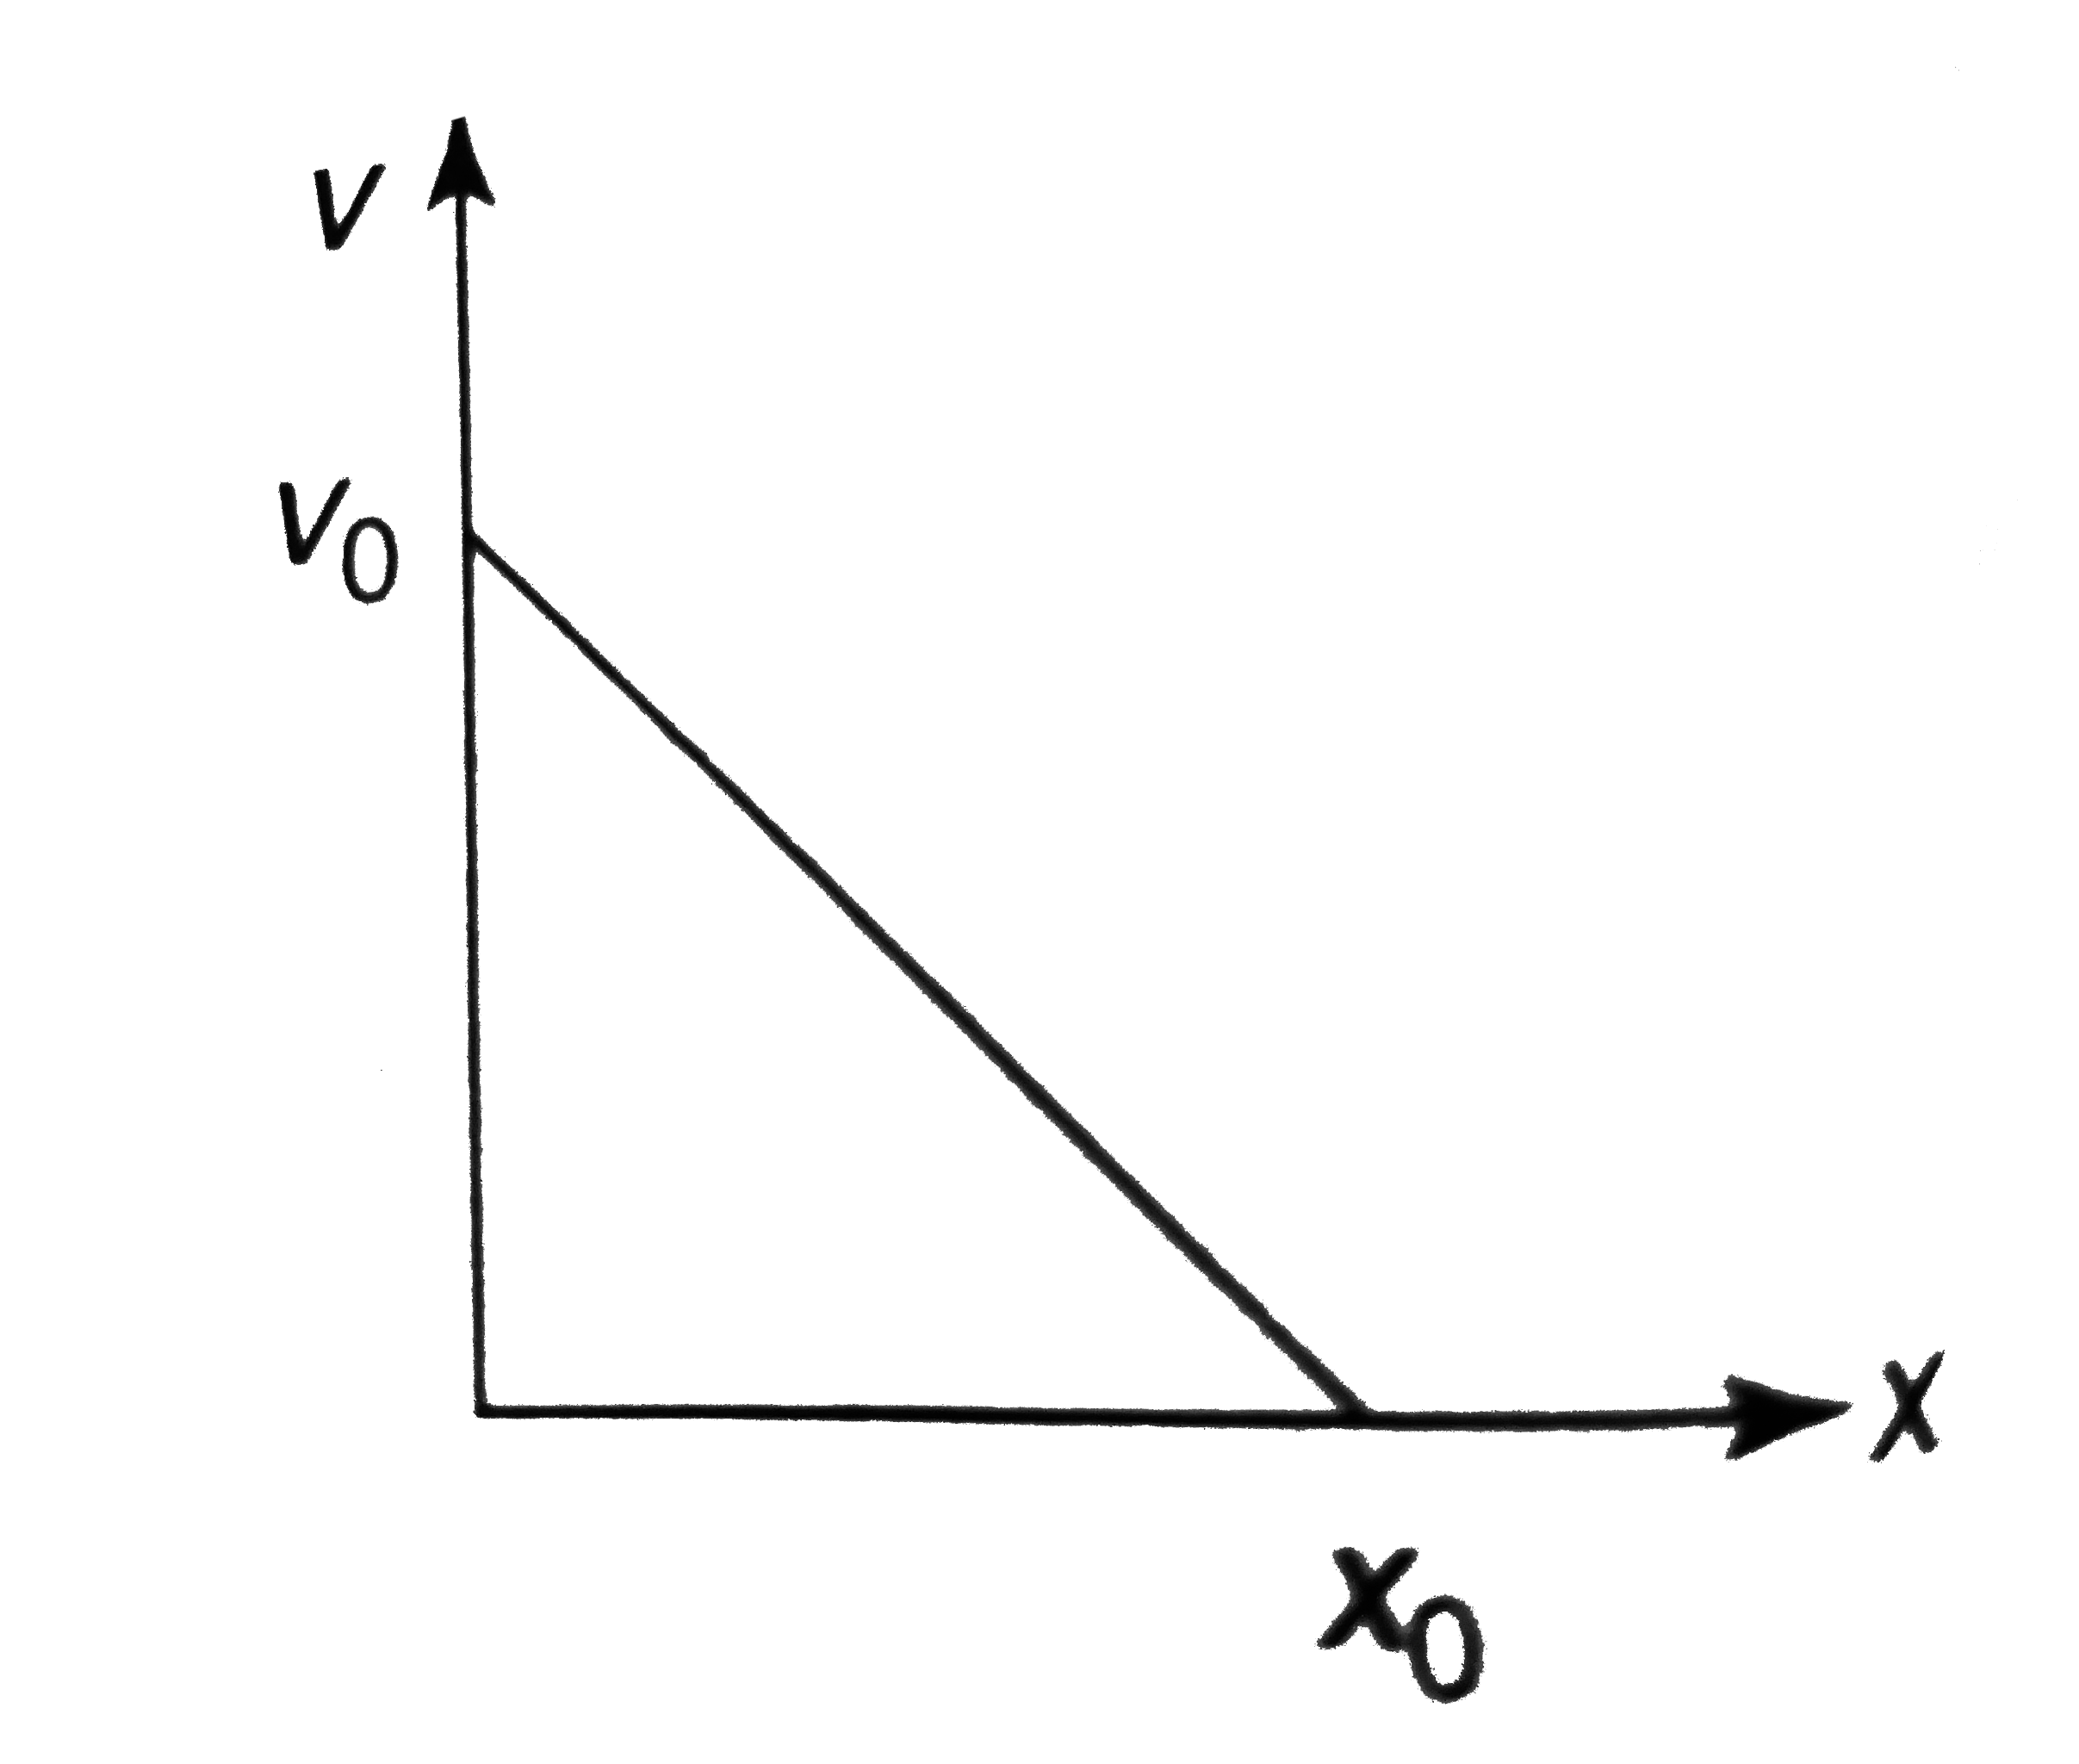
View SolutionThe given graph shows the variation of velocity with displacement. Which one of the graphs given below correctly represents the variation of acceleration with displacement ?
 View Solution
The velocity -displacement graph of a particle is as shown in the figure. Which of the following graphs correctly represents the variation of acceleration with displacement?
 View Solution
An a.c. source of variable angular frequency o is connected to an LCR series circuit. Which one of the following graphs correctly represents variation of impedance Zof a.c. circuit with angular frequency ω?
View SolutionWhich of the following graph correctly represents the variation of molar conductance (Δm) with dilution for a strong electrolyte ?
View Solution

