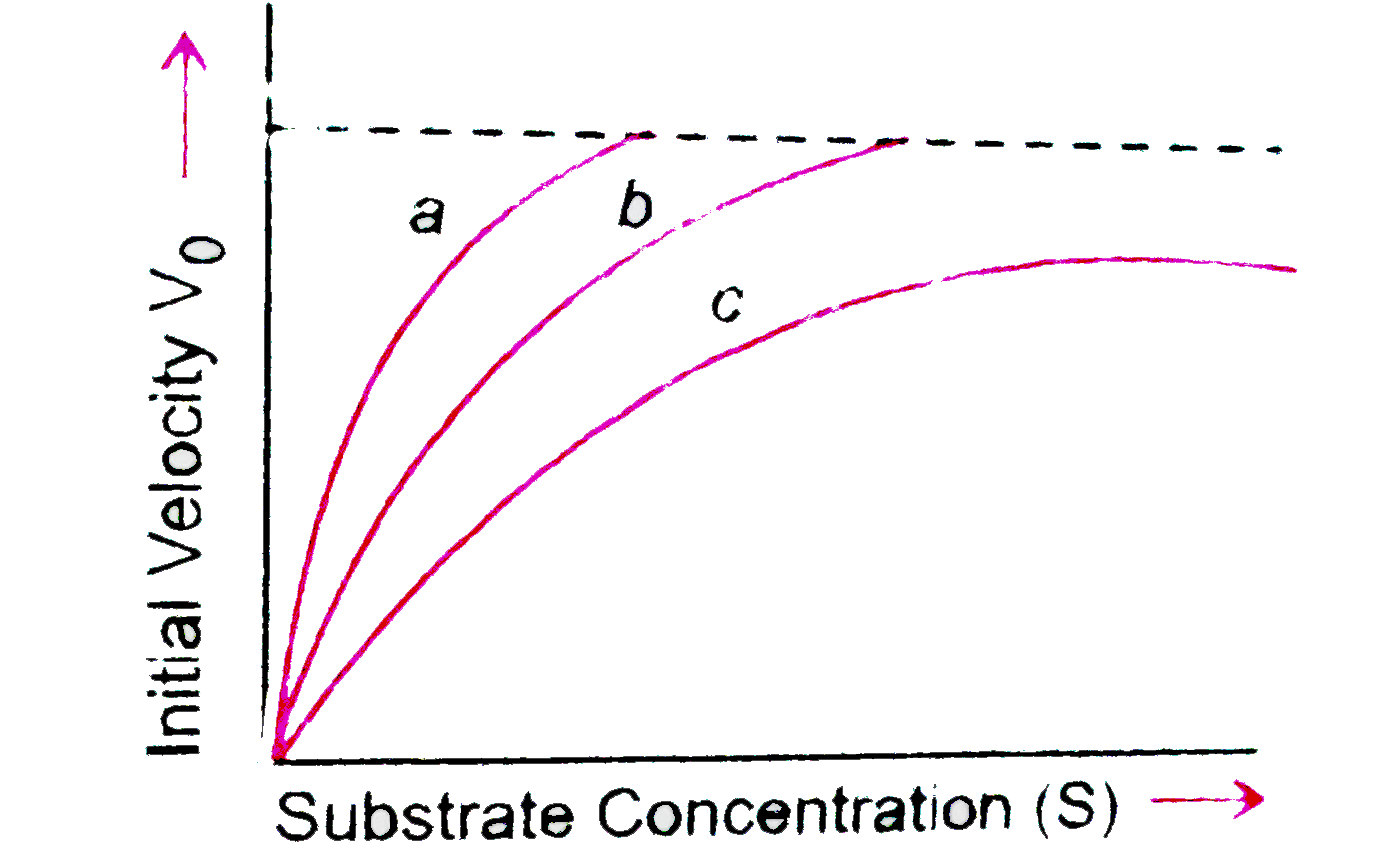
The given graph shows the effect of substrate concentration on the rate of reaction of the enzyme green-gram-phosphatase What does the graph indicate?
The rate of enzyme reaction is directly proportional to the substrate concentration
Presence ofan enzyme inhibitor in the reaction mixture
Formation of an enzyme-substrate complex
at higher substrate concentration the pH increases.
The correct Answer is:B
Similar Questions
The graph given below shows the effect of substrate concentration on the rate of reaction of the enzyme green-gram-phosphatase What does the graph indicates?
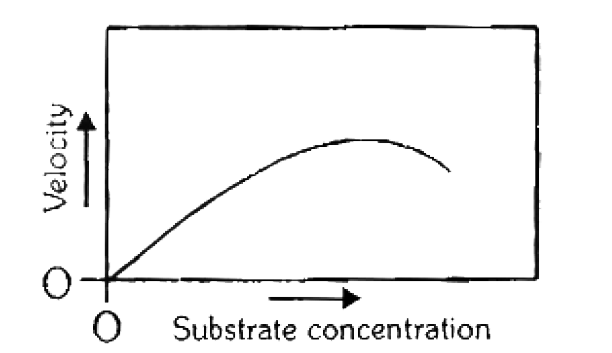
View SolutionWhat does the graph indicate ?
The graph given below shows the effect of substrate concentration on the rate of reaction of the enzyme green- gram-phos-phatase.
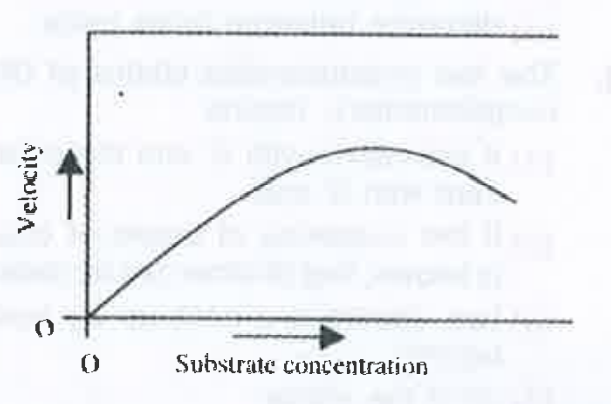
View Solution
Knowledge Check
The given graph shows the effect of substrate concentration on the rate of reaction of the enzyme green gram-phosphatase

What dose the graph indicateAThe rate of enzyme reaction is directly proportional to the substrate concentrationBPresence of an enzyme inhibitor in the reaction mixtureCFormation of an enzyme-substrate complexDAt higher substrate concentration the pH increaseThe given graph shows the effect of substrate concentration on the rate of reaction of the enzymes green gram-phosphatase. What does the graph indicate ?
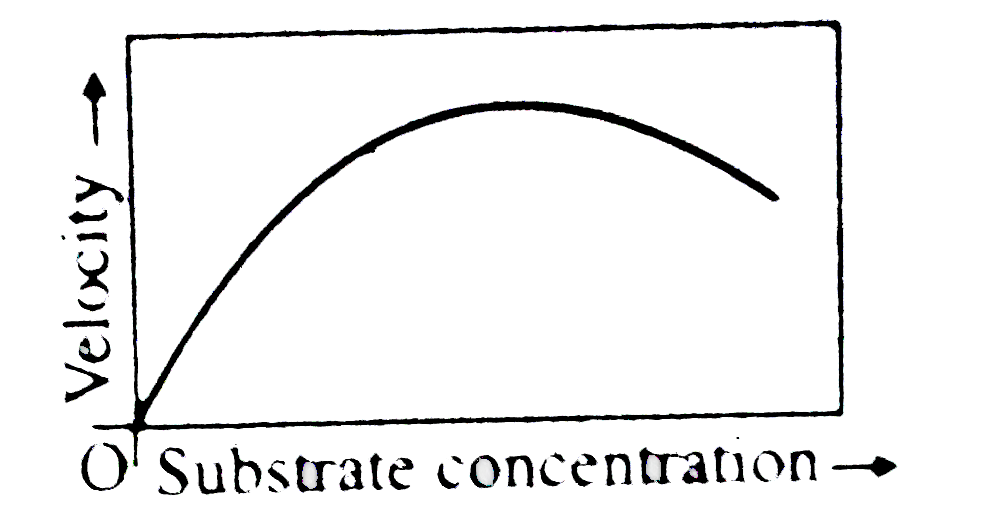 AThe rate of enzyme reaction is directly proportional to the substrate concentration.BPressence of an enzyme inhibitor in the reaction mixture.CFormation of an enzyme-substrate complex.DAt higher substrate concentration the pH increase.
the graph given in Fig.9.36 shows the effect of substrate concentration on the rate of reaction of the enzyme green-gram -phosphatase . What does the graph indicates ?
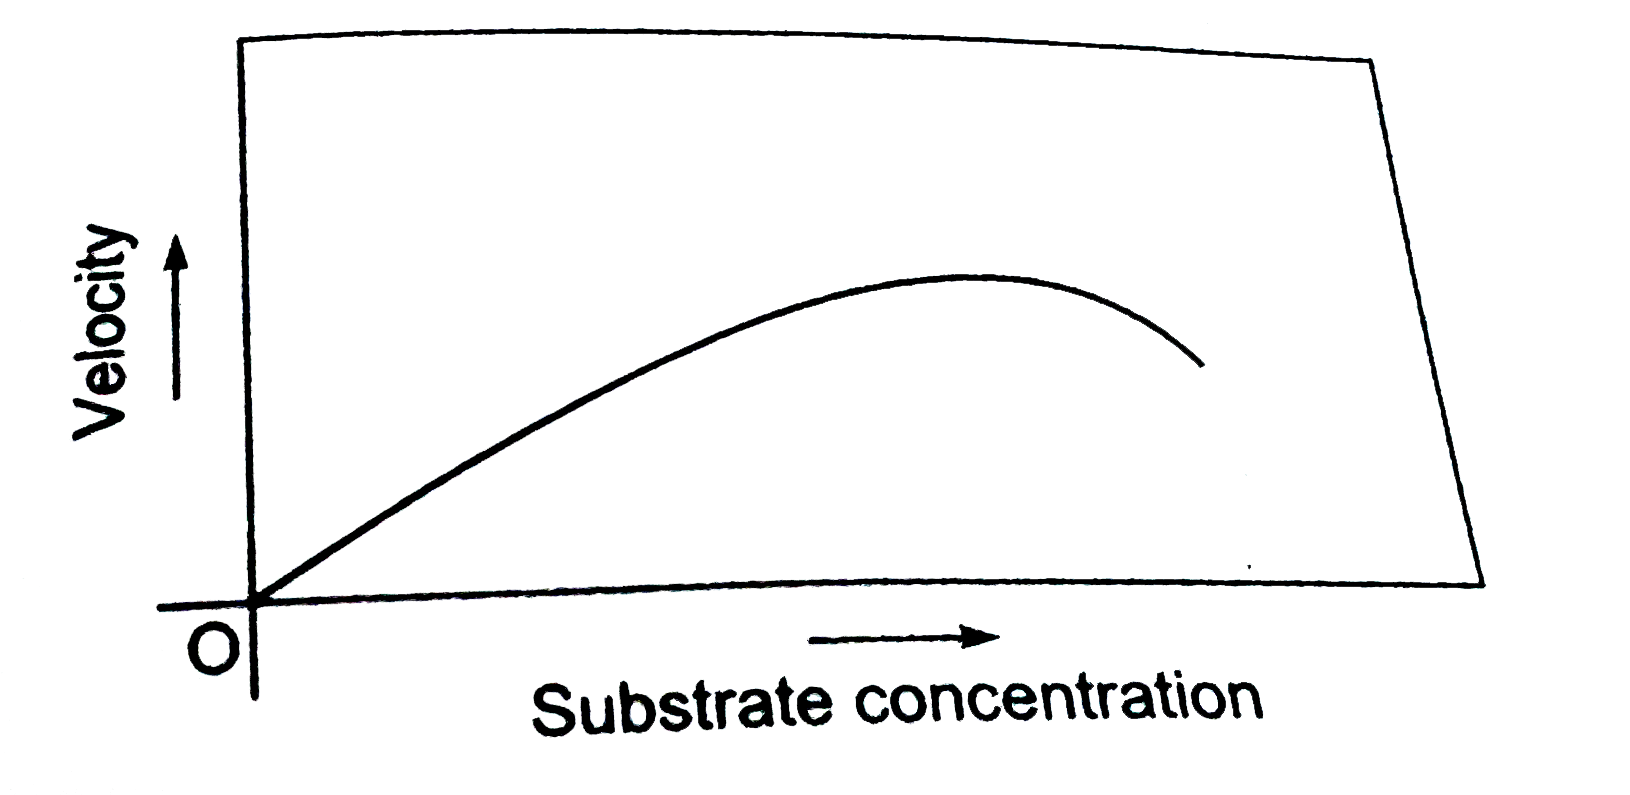 Athe rate of enzyme reaction is directly proportional to the substrate concentrationBPresence of an enzyme inhibitor in the reaction mixture .CFormation of an anzyme-substrate complex.DAt higher substrate concentration , the pH increases H+cone⏐↓
Explain the effect of substrate concentration on enzyme activity
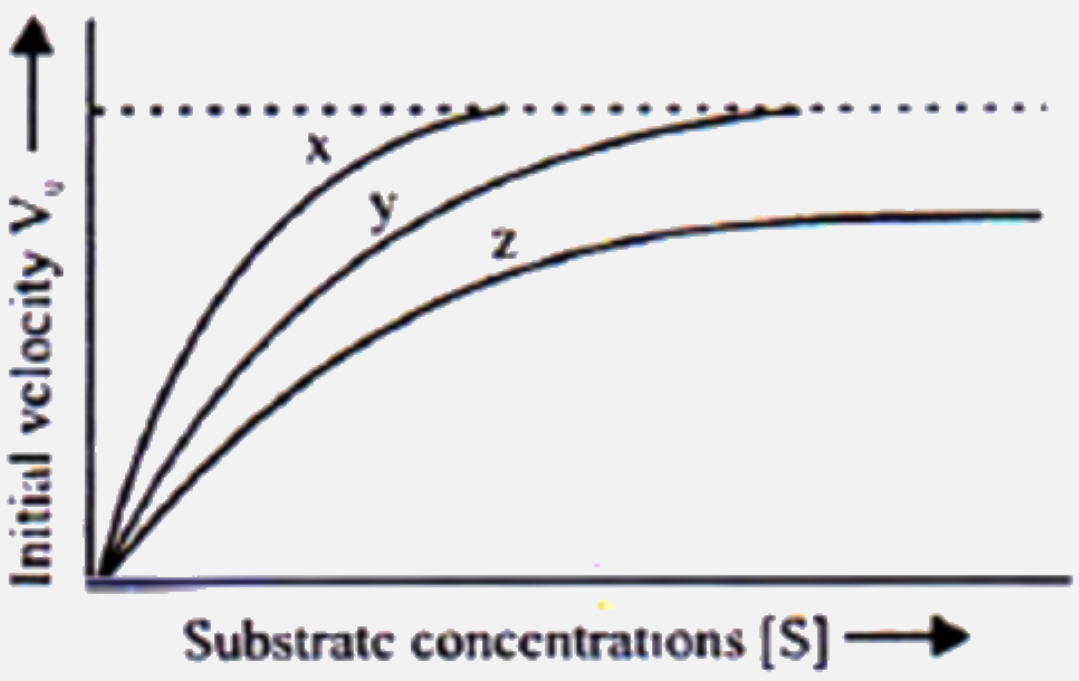
View SolutionFigure given below shows three velocity-substrate concentration curves for an enzyme reaxtion. What do the curves for an enzyme reaction. What do the curves depict
View SolutionThe Given figure shows three velocity-substrate concentration curves of an enzyme reaction. What do the curves X Y and Z depict respectively ?
View SolutionThe given graph indicates :
View SolutionFigure given below shows three velocity-substrate concentration curves for an enzyme reaxtion. What do the curves for an enzyme reaction. What do the curves depict

View Solution
