Figure given below shows three velocity-substrate concentration curves for an enzyme reaxtion. What do the curves for an enzyme reaction. What do the curves depict
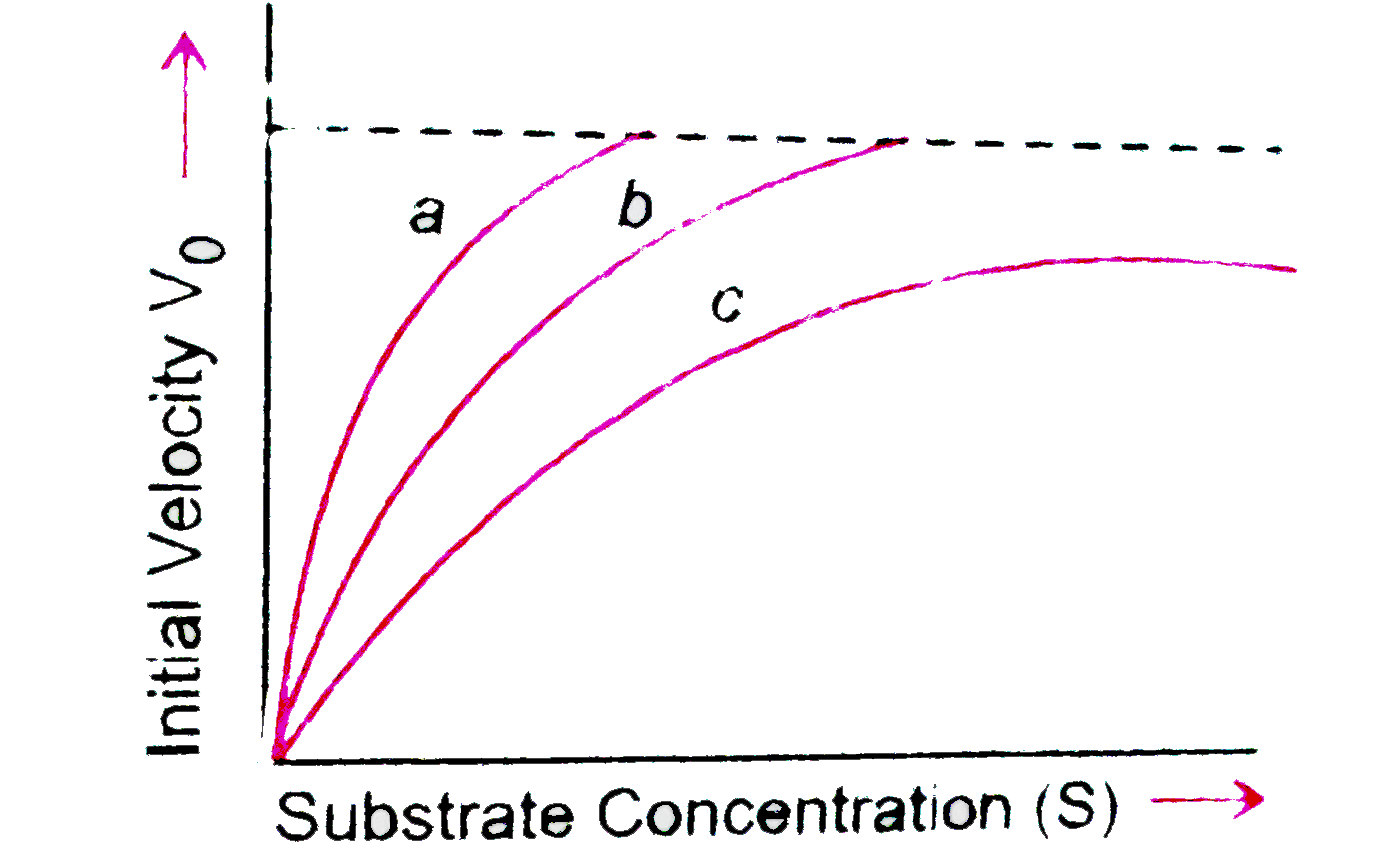
A - normal enzyme reaction , B - competitive inhibition , C - non - competitive inhibition
A - enzyme with an allosteric modulator added , B - normal enzyme activity , C - competitive inhibition
A - enzyme with an allosteric stimulator , B - competitive inhibitor added , C - normal enzyme reaction
A - normal enzyme reaction , B - non - competitive inhibition , C - allosteric inhibitor added
The correct Answer is:A
Step by step video & image solution for Figure given below shows three velocity-substrate concentration curves for an enzyme reaxtion. What do the curves for an enzyme reaction. What do the curves depict by Biology experts to help you in doubts & scoring excellent marks in Class 12 exams.
Updated on:21/07/2023Similar Questions
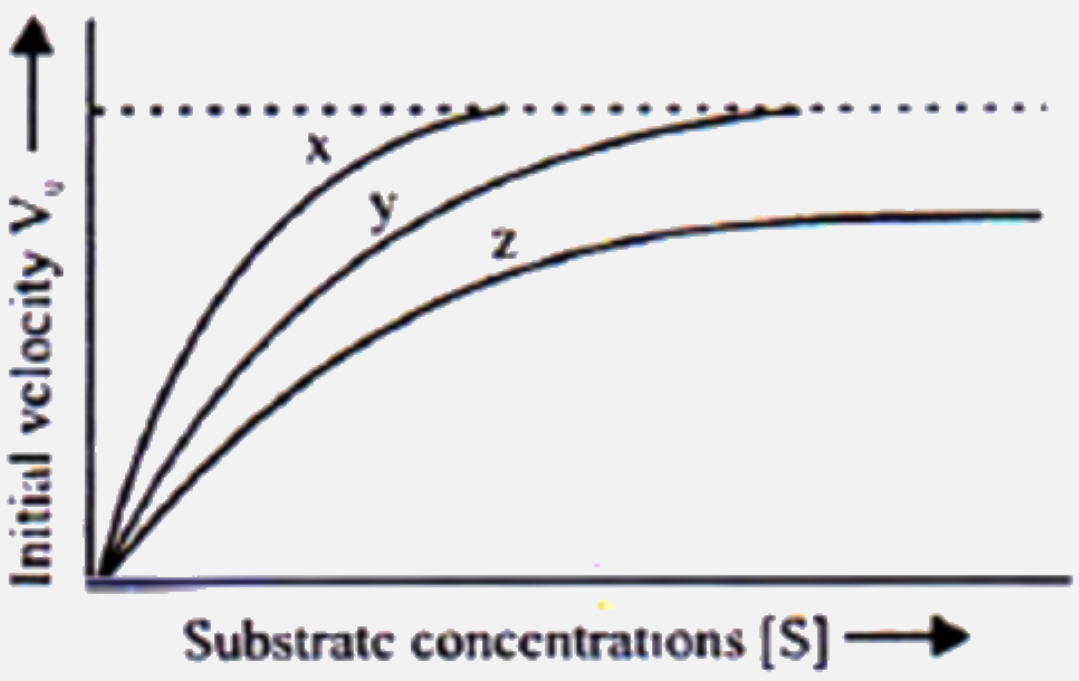
The Given figure shows three velocity-substrate concentration curves of an enzyme reaction. What do the curves X Y and Z depict respectively ?
View SolutionIf you study the effect of substrate concentration on an enzymatic reaction, what kind of curve would you obtain?
View SolutionThe substrate concentration at which the chemical reaction catalyzed by an enzyme attains half of its maximum velocity is termed as
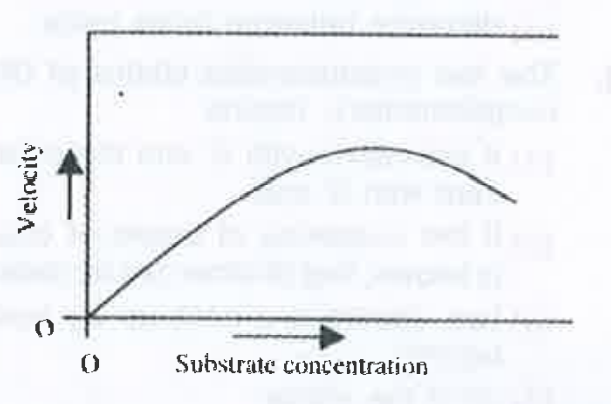
View SolutionWhat does the graph indicate ?
The graph given below shows the effect of substrate concentration on the rate of reaction of the enzyme green- gram-phos-phatase.
View Solution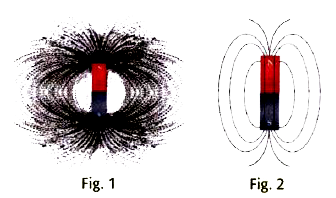
What are the curves in Figure 2 called?
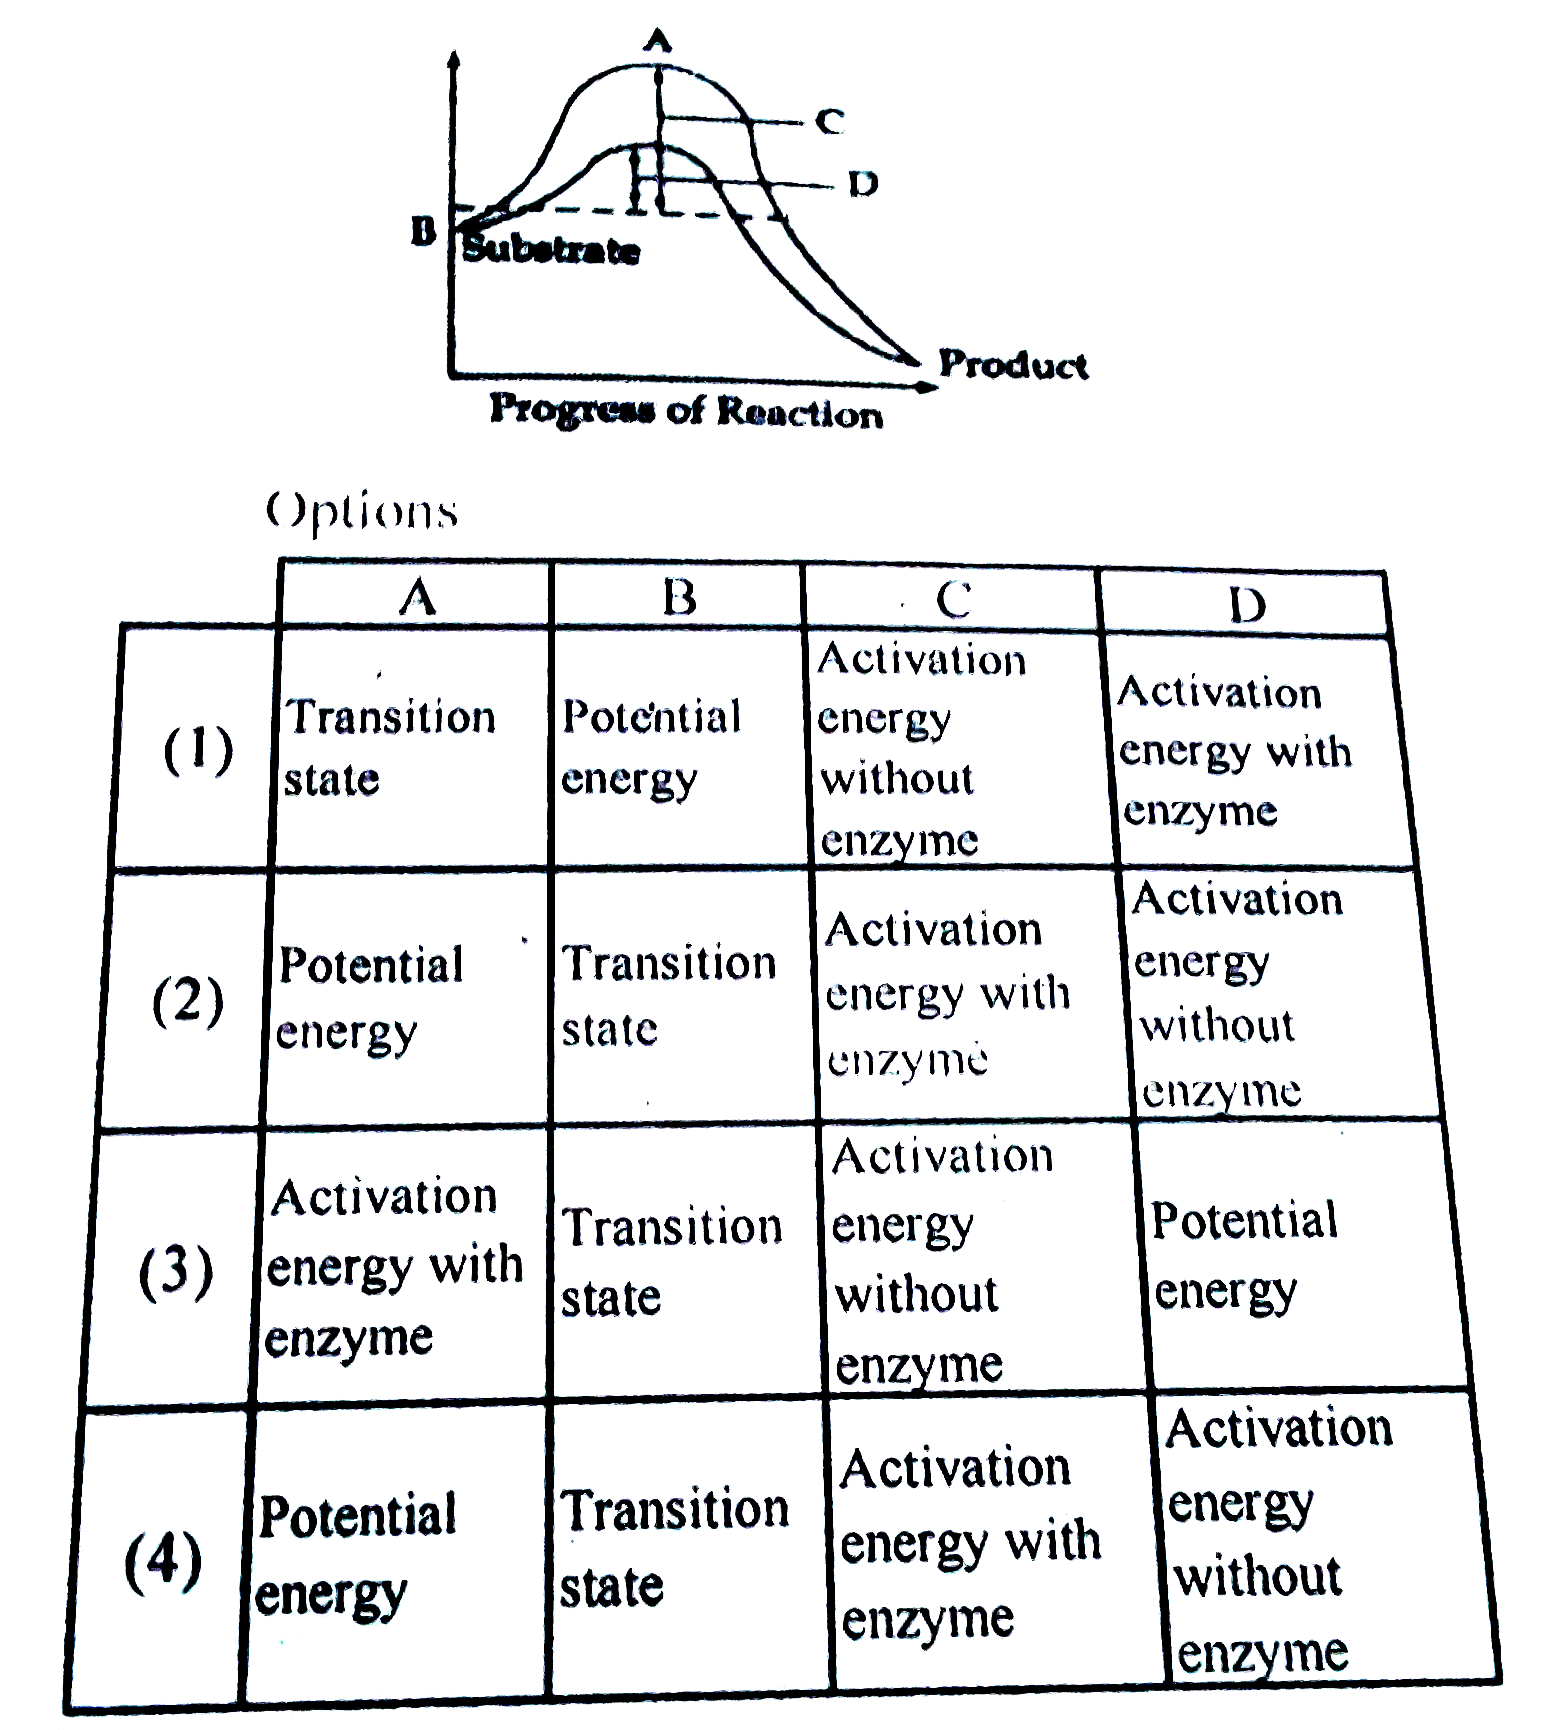
View SolutionThe figure given below shows the conversions of a substrate into product by an enzyme. In which one of the four options (1-4) the components of reaction labelled as A, B, C and D are identified correctly -
View SolutionThe shape of the curve obtained when substrate concentration is plotted against velocity of reaction
View Solution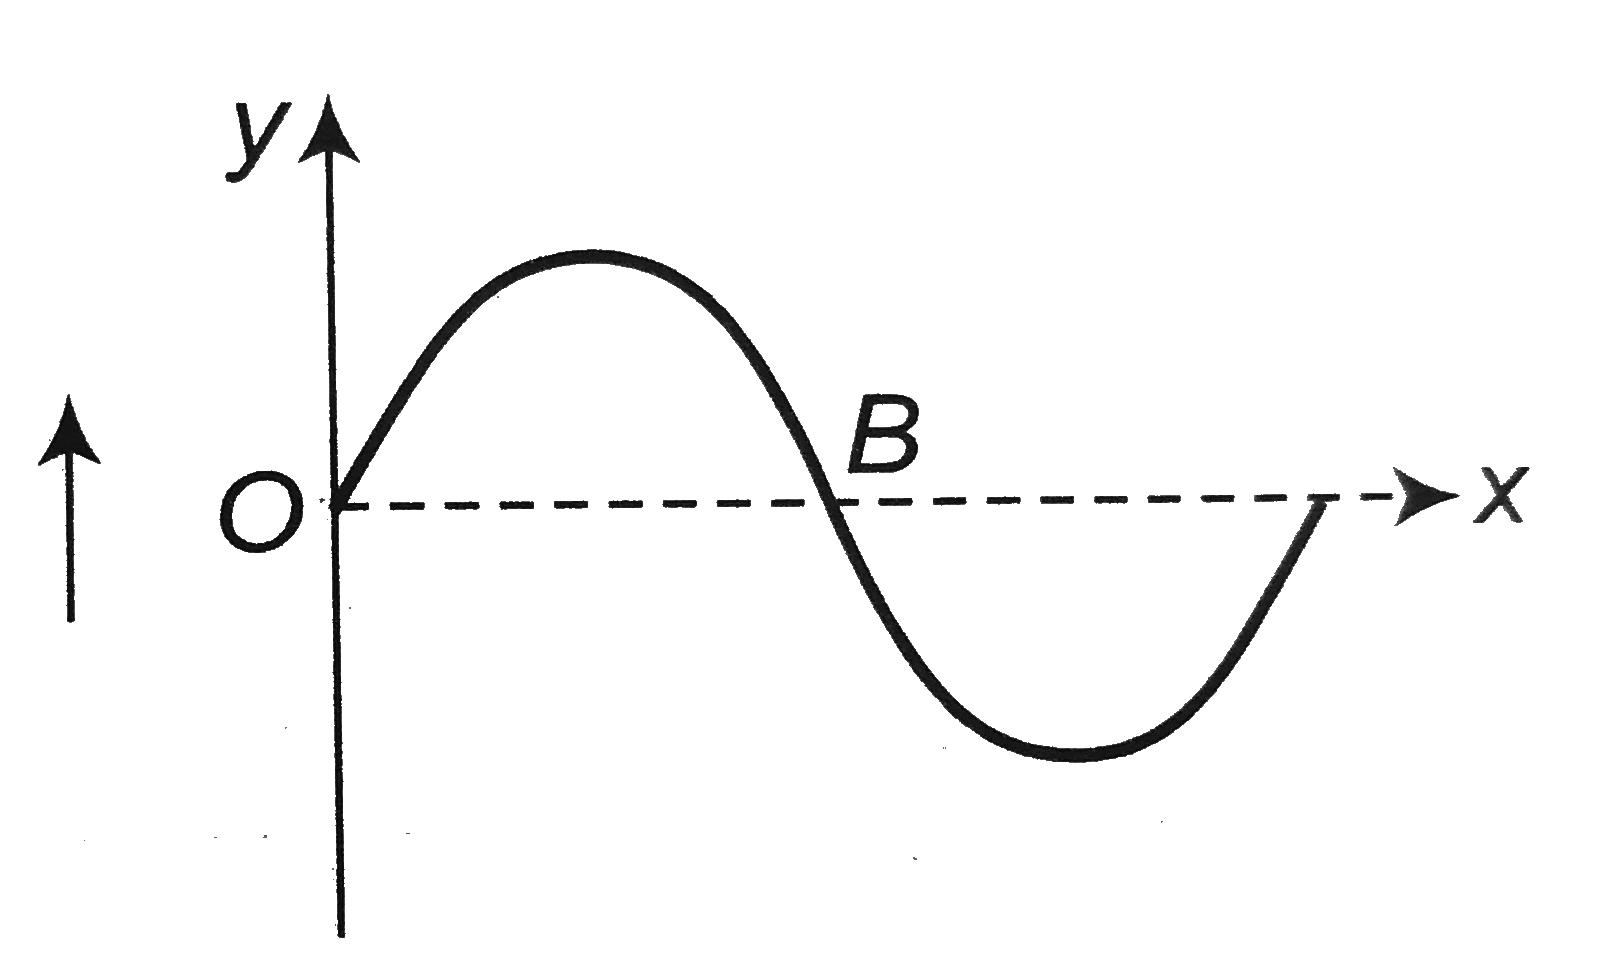
Figure below shows the wave y=Asin(ωt−kx) at any instant travelling in the +ve x-direction. What is the slope of the curve at B?
View Solutionthe curve given below shows wnzymatic acitvity with relation to three conditions (pH , temperature and substrate concentration ).
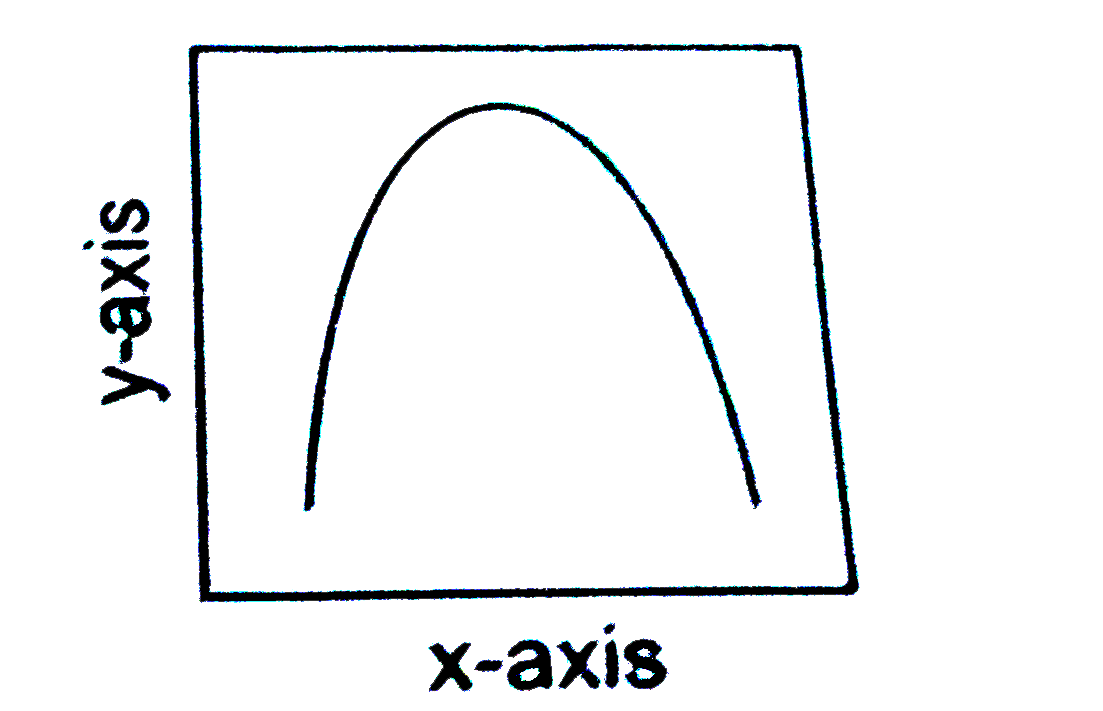
what do the two axes ( x and y) represent ?
View SolutionWhat do the enzymes do, lower or increase the activation energy ?
View Solution
