For a reaction X→Y, the graph of the product concentration (x) versus time (t) came out to be a straight line passing through the origin. Hence and time would be the graph of d[X]dt and the time would be
straight line with a negative slope and an intercept on y-axis
straight linc with a positive slope and an intercept on y-axis
a straight line parallel to x-axis
a hyperbola.
The correct Answer is:C
If product concentration is x.
For a zero reaction xt=k
Thus graph would be straight line passing through origin. So the given information is for zero order reaction. For a zero order reaction, rate of reaction is constant. Thus, plot of rate vs time, x-axis.
Topper's Solved these Questions
Similar Questions
Knowledge Check
- Question 1 - Select One
For a reaction, X → Y, the graph of the product concentration (x) versus (t) came out to be a straight line passing through the origin. Hence the graph of −d[X]dt and time would be
Astraight line with a negative slope and an intercept on p-axisBstraight line with a positive slope and an intercept on y-axisCa straight line parallel to x-axisDa hyperbola. - Question 2 - Select One
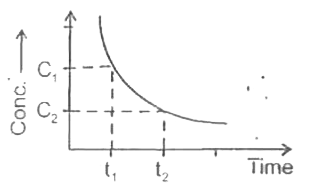
The graph plotted between concentration versus time
 AIt gives rate of disappearance of reactantBRate =(d[C2−C1)])t2−t1CBoth (1) & (2)DIt predicts the order of reaction
 - Question 3 - Select One
A graph ploted between concetration of reaction consumed at any time (x) and t1/2 is found to be a straight line passing throught the origin. Thus reaction is of
Afirst orderBzero orderCthird orderDsecond order
The graph of y =x passes through the point
View SolutionA graph between time (t) and the substance consumed at any time is found to be a straight line passing through the orginal This indicates that the reaction is of :
View SolutionIf the graph of concentration of [A] vs T for completion of reaction is a straight line, then the order of reaction is
View SolutionA plot between time and the amount of reactant consumed is found to be a straight line passing through origin for a reaction. The order of the reaction is
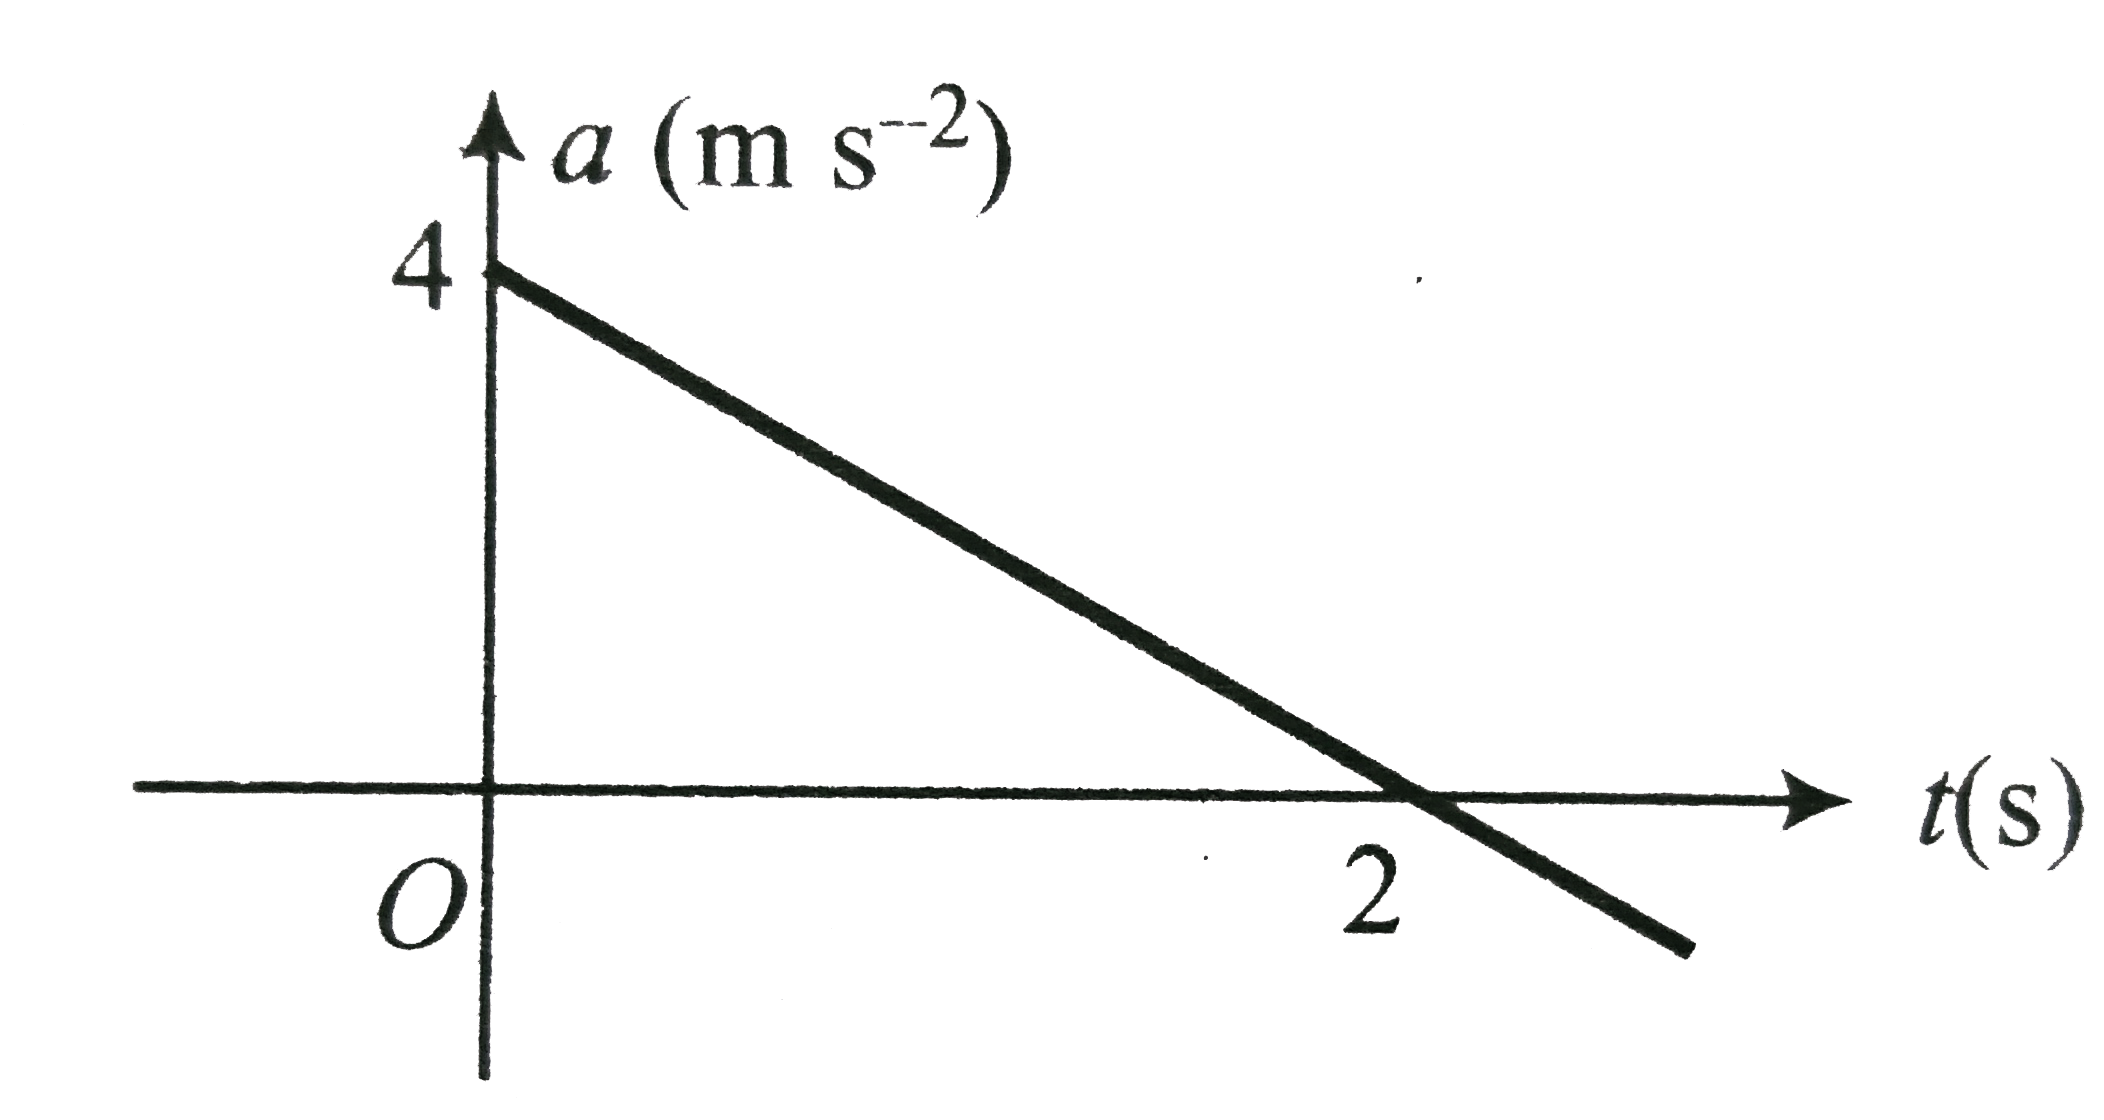
View SolutionThe acceleration versus time graph of a particle moving in a straight line is show in figure. The velocity-time graph of the particle would be
 .View Solution

