A graph between time (t) and the substance consumed at any time is found to be a straight line passing through the orginal This indicates that the reaction is of :
zero order
first order
Second order
fractional order
The correct Answer is:C
Step by step video, text & image solution for A graph between time (t) and the substance consumed at any time is found to be a straight line passing through the orginal This indicates that the reaction is of : by Chemistry experts to help you in doubts & scoring excellent marks in Class 12 exams.
Topper's Solved these Questions
- BOOK - OP TANDONCHAPTER - CHEMICAL KINETICSEXERCISE - OBJECTIVE QUESTIONS (LEVEL-B) SET I48videos
CHEMICAL KINETICS
- BOOK - OP TANDONCHAPTER - CHEMICAL KINETICSEXERCISE - OBJECTIVE QUESTIONS (LEVEL-B) SET II13videos
CHEMICAL KINETICS
- BOOK - OP TANDONCHAPTER - CHEMICAL KINETICSEXERCISE - PRACTICE PROBLEMS70videos
CHEMICAL KINETICS
- BOOK - OP TANDONCHAPTER - CARBOXYLIC ACIDS AND THEIR DERIVATIVESEXERCISE - Integer4videos
CARBOXYLIC ACIDS AND THEIR DERIVATIVES
- BOOK - OP TANDONCHAPTER - Chemical Thermodynamics and ThermochemistryEXERCISE - Self Assessment (Integer type).3videos
Chemical Thermodynamics and Thermochemistry
Similar Questions
Knowledge Check
- Question 1 - Select One
A graph ploted between concetration of reaction consumed at any time (x) and t1/2 is found to be a straight line passing throught the origin. Thus reaction is of
Afirst orderBzero orderCthird orderDsecond order - Question 2 - Select One
A plot between time and the amount of reactant consumed is found to be a straight line passing through origin for a reaction. The order of the reaction is
A0B1C2D3 - Question 3 - Select One
A plot of log (a-x) against time 't' is a straight line. This indicates that the reaction is of :
Azero orderBfirst orderCsecond orderDthird order
For a reaction X→Y, the graph of the product concentration (x) versus time (t) came out to be a straight line passing through the origin. Hence and time would be the graph of d[X]dt and the time would be
View SolutionFor a reaction, X → Y, the graph of the product concentration (x) versus (t) came out to be a straight line passing through the origin. Hence the graph of −d[X]dt and time would be
View SolutionThe plot of concentration of the reactant vs time for a reaction is a straight line with a negative slope. This reaction follows
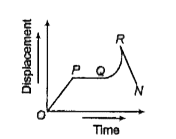
View SolutionThe graph between displacement and time in a motion along straight line is depicted below. Which interval indicates that no force is acting on the particle?
 View Solution
The graph between displacement and time in a motion along straight line is depicted below. Which interval indicates that no force is acting on the particle?
 View Solution

