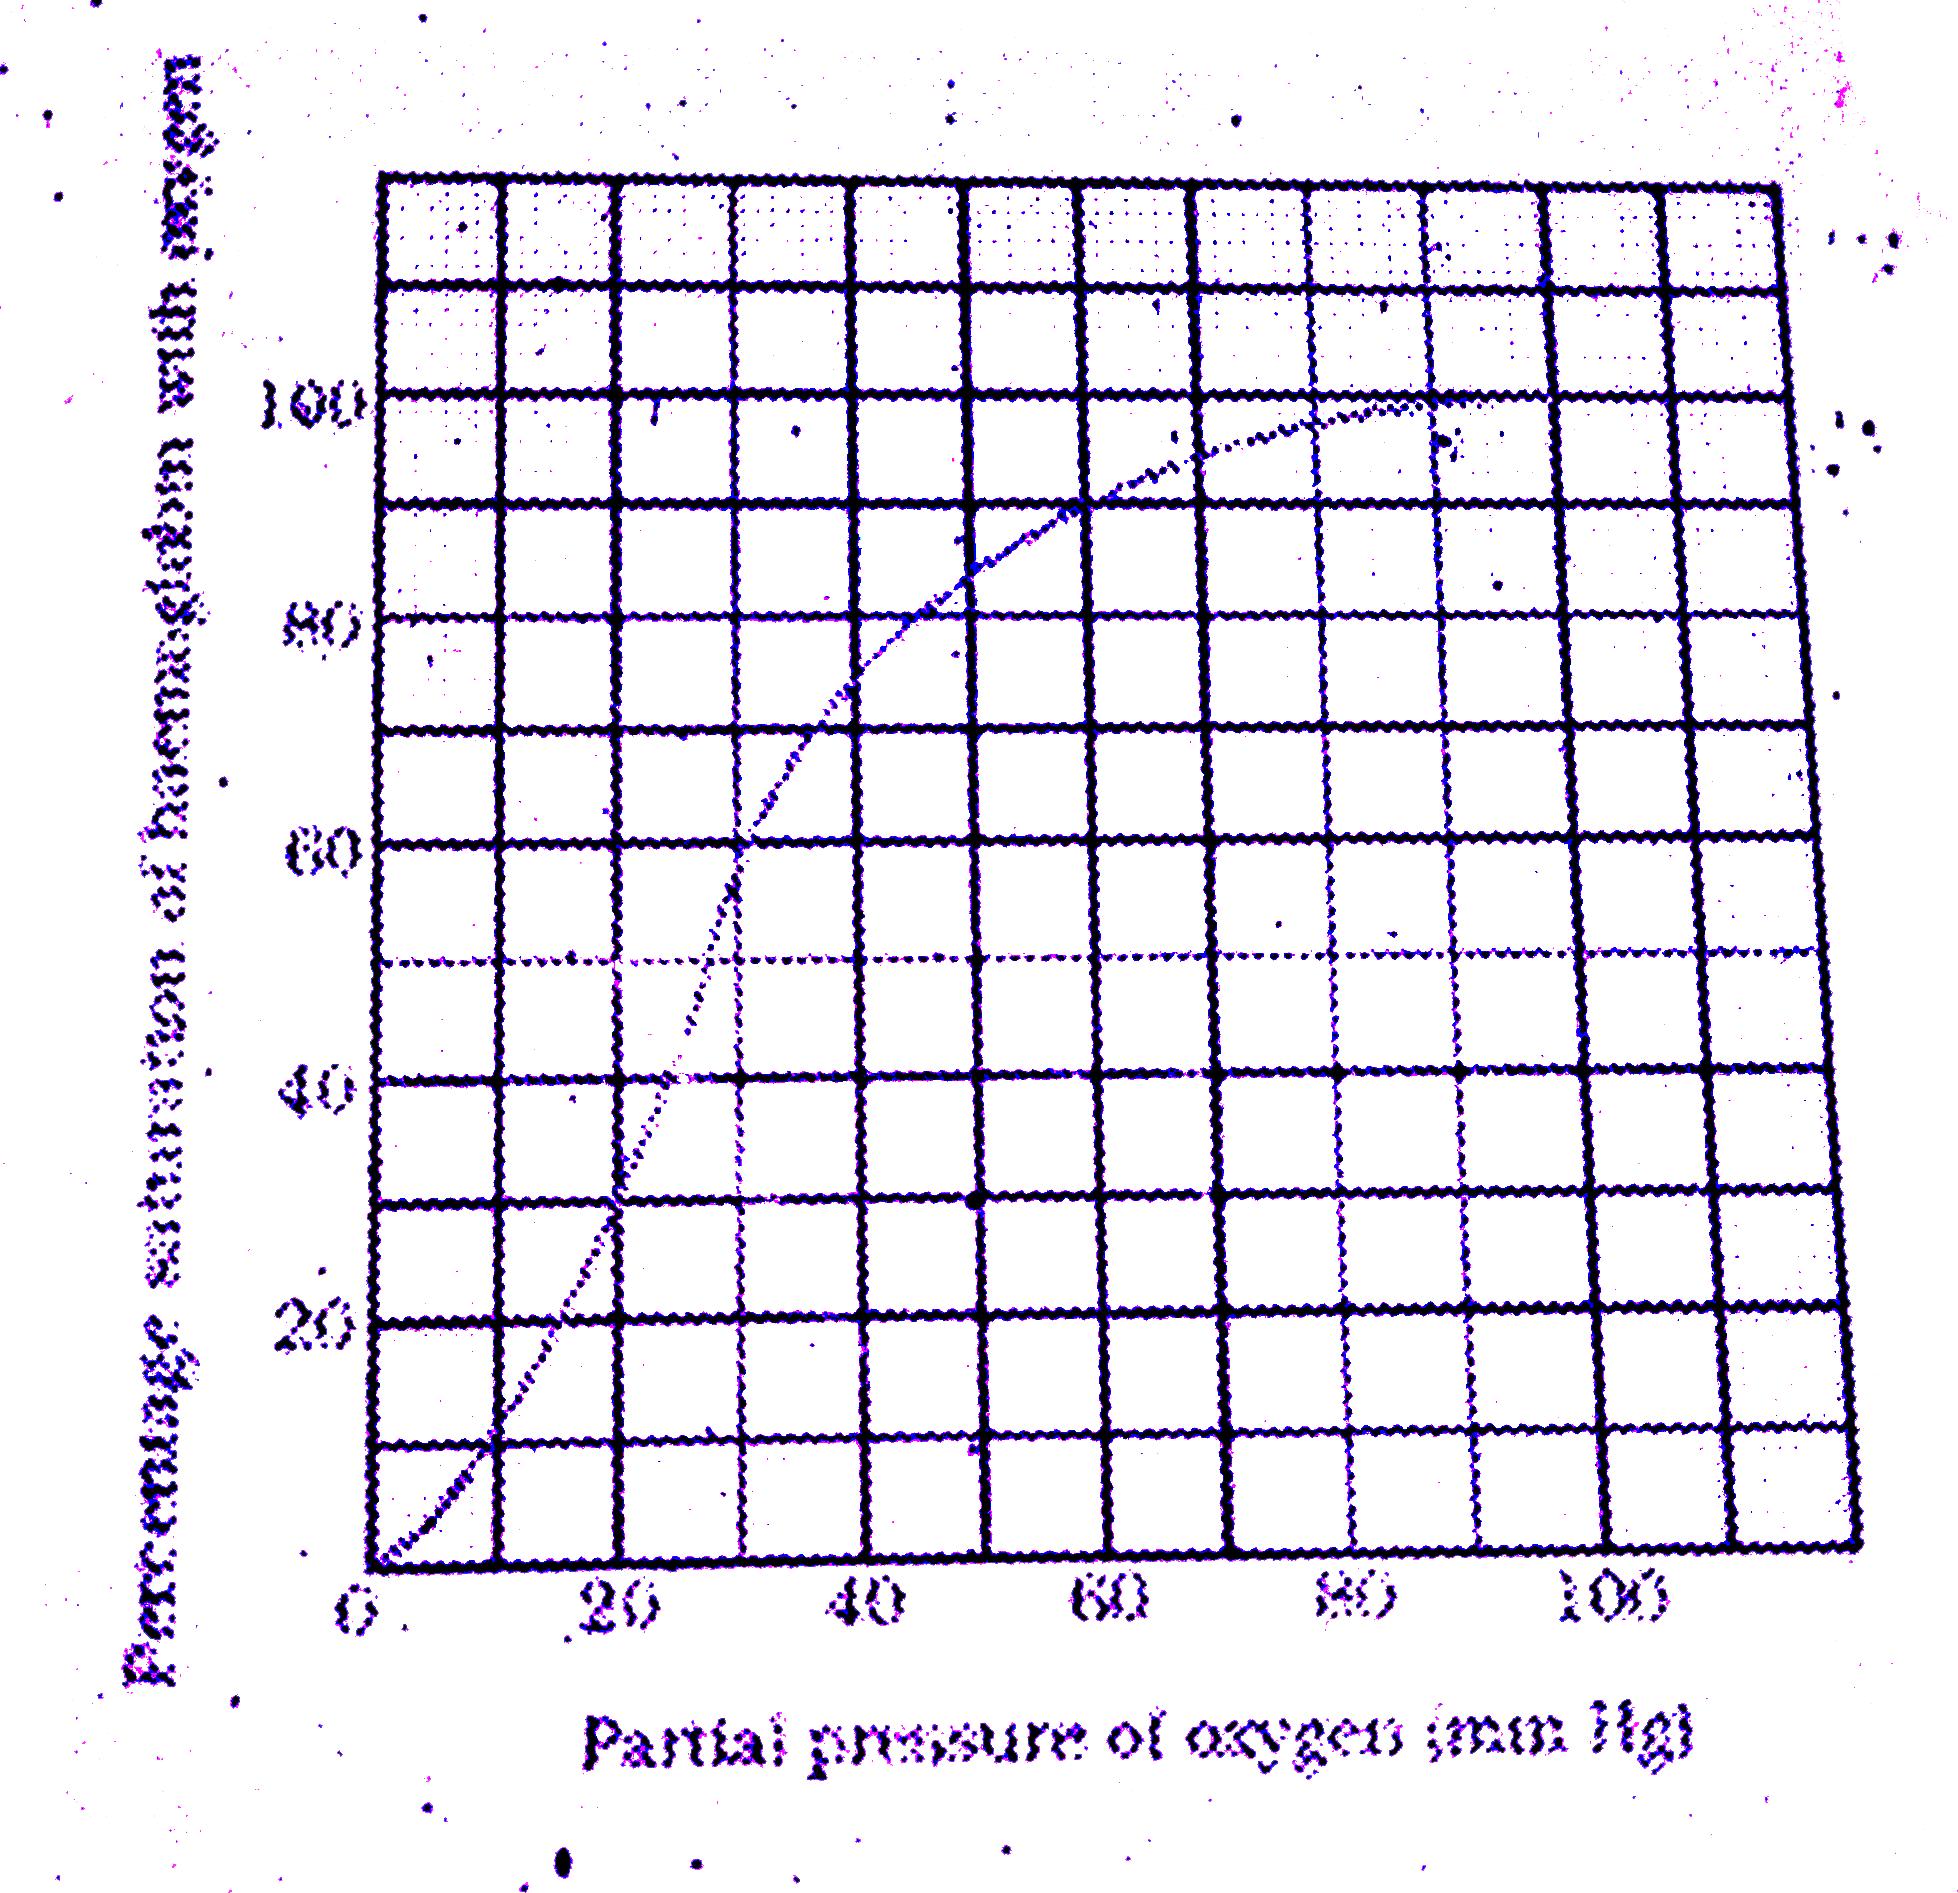
O2 dissociation curve is plotted between pO2 and......
A
% Hb saturation
B
pCO2
C
Hb concentration
D
RBC/mm3 of blood
Video Solution
Text Solution
The correct Answer is:A
|
Similar Questions
Knowledge Check
O2 dissocation curve is
ASigmoidBSlopeCStraight lineDParabolaO2 dissociation curve is shifted to right in all except
Ahype capeneaBrise in temperature fCraised 2.3 dpg levelDmetabolic alkalosisWhat happen to the O2 dissociation curve of Hb if pH is decreased?
Ashift to leftBshift to rightCremain unchangedDwill oscillate erratically
Decrease in pH causes O2 dissociation curve of . haemoglobin t6 shift to
View SolutionWhich statements are correct for oxyhaemoglobin dissociation curve ?
(A) This curve is sigmoid
(B) When CO2 concentration increases, then this curve shifts towards right side
(C) Low temperature is favourable for dissociation of oxygen grom oxyhaemoglobin
(D) Binding of oxygen with haemoglobin is primarily related to partial pressure of O2
View SolutionIn Arrehenius equation if a graph is plotted between logK and 1/T, the slope of the curve will be:
View SolutionA graph is plotted between pO2 and percentage
saturation of Hb with O2 from
Hb?
View SolutionSigmoid oxygen dissociation curve represents interrelationship between
View Solution
