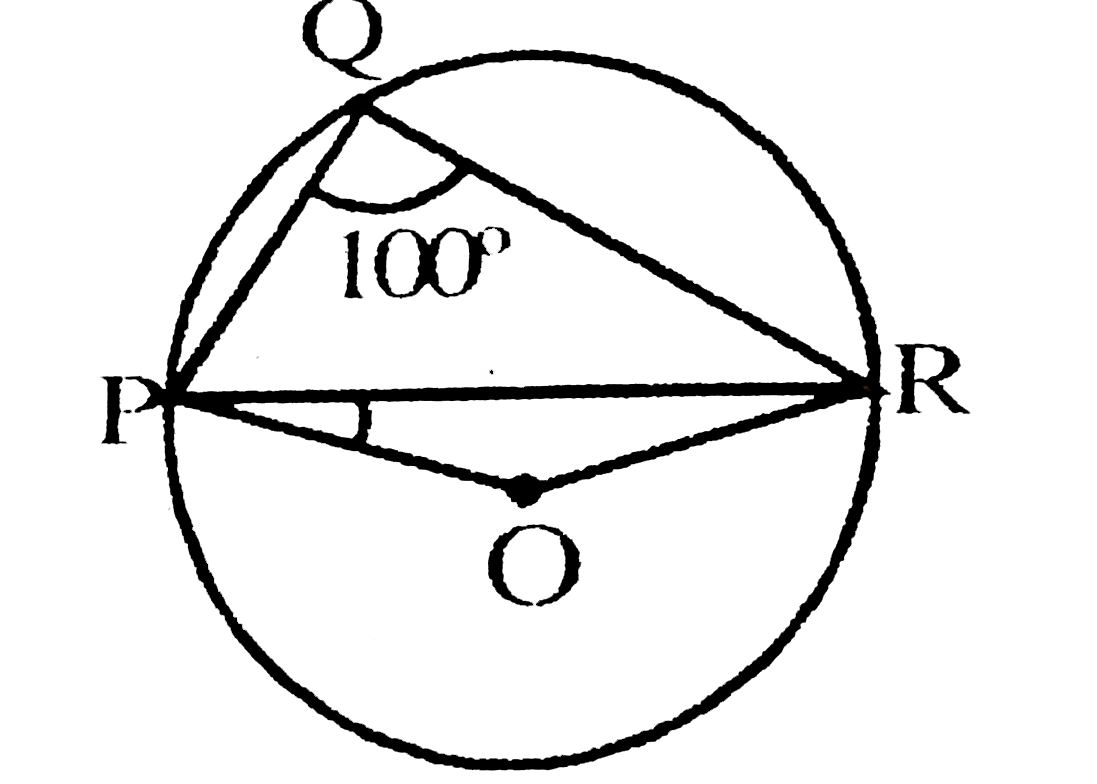
दिया गया चित्र में ∠PQR=100∘ है, जहाँ P, Q तथा O केन्द् वाले एक वृत्त पर स्थित बिन्दु है। ∠OPR ज्ञात कीजिए।

ऋजुकोण ∠POR=2∠PQR
∴ केन्द्र पर का कोण परिधि पर के कोण का दुगुना होता होता है।
=2×100=200∘

फिर केन्द्र O पर बने सभी कोणों का जोड़ =360∘
∴ΔOPR में ∠OPR=360∘−200∘=30∘−200∘=16∘ ....(i)
पुनः ΔOPR में OP=OR [वृत्त की त्रिज्याएँ]
∴∠OFR=∠OPR ...(ii) (समान भुजाओं के सामने का कोण)
अब ∠OPR+∠ORP+∠POR=180∘ (त्रिभुज के तीनों कोनों का योग)
समीकरण (i) और (ii) से,
∠OPR+∠OPr+160∘=180∘
2∠OPR=180∘−160∘=20∘
∴∠OPR=20∘2=10∘
Topper's Solved these Questions
- BOOK - KC SINHACHAPTER - वृत्त EXERCISE - EXERCISE 12.1 (अतिलघु उत्तरीय प्रश्न )29videos
वृत्त
- BOOK - KC SINHACHAPTER - वृत्त EXERCISE - EXERCISE 12.1 (लघु उत्तरीय प्रश्न )5videos
वृत्त
- BOOK - KC SINHACHAPTER - वास्तविक संख्याओं पर संक्रियाएँ एवं वास्तविक संख्याओं के घातांक EXERCISE - Objective Questions30videos
वास्तविक संख्याओं पर संक्रियाएँ एवं वास्तविक संख्याओं के घातांक
- BOOK - KC SINHACHAPTER - समांतर चतुर्भुजEXERCISE - वस्तुनिष्ठ प्रश्न9videos
समांतर चतुर्भुज
Similar Questions
तीन अरैखिक बिन्दुओं से कितने वृत्त खींचे जा सकते है ।
01:37View Solutionबगल के चित्र में O वृत्त के केन्द्र है ∠OBA=25∘ एवं ∠OCA=35∘ है, तो, ∠BAC ज्ञात करे।
06:07View Solutionपरिमेय संख्या का दशमलव प्रसार कैसा होता है?
02:11View Solutionचतुर्भुज के चारों कोणों का योग कितना समकोण होता है?
01:31View SolutionHow many lines of symmetry does the above figure have ?
02:03View SolutionWhich of the following are correct chain isomers of butane ? (i)
02:45View SolutionDetermine the point of symmetry of a regular hexagon.
02:17View SolutionDtermine the images of the following figure about the given line :
05:41View SolutionIn the given figure, AB is a diameter, O is the center of the circle and ∠OCB=50∘ then find ∠DBC.
02:10View SolutionMatch the following Column A to Column B
 02:17View Solution
Match the following Column A to Column B
 02:10View Solution
Match the following Column A to Column B
 04:23View Solution
The inequation represented by the graph given below is :
03:02View SolutionThe inequation that best describes the graph given below is _________
01:49View SolutionThe inequation that best describes the following graph is _________
03:52View SolutionWhich inequations represent the shaded region in the given figure
01:44View Solution

