Which of the following plot is correct about the kinetic energy of photoelectrons ?
The correct Answer is:A
To solve the question regarding the correct plot about the kinetic energy of photoelectrons, we need to understand the relationship between the kinetic energy of photoelectrons and the parameters involved in the photoelectric effect.
1. Understanding the Photoelectric Effect:
- When light of suitable frequency falls on a metal surface, electrons are emitted. This phenomenon is known as the photoelectric effect.
- The energy of the incident light can be expressed as E=hν, where h is Planck's constant and ν is the frequency of the light.
2. Einstein's Photoelectric Equation:
- Einstein provided the equation for the photoelectric effect:
E=ϕ+KEmax
where ϕ is the work function of the metal and KEmax is the maximum kinetic energy of the emitted photoelectrons.
3. Threshold Frequency:
- The work function ϕ can also be expressed in terms of the threshold frequency ν0:
ϕ=hν0
- The threshold frequency is the minimum frequency required to eject an electron from the metal surface.
4. Kinetic Energy Relation:
- Rearranging Einstein's equation gives:
KEmax=hν−hν0
- This shows that the maximum kinetic energy of the photoelectrons is directly proportional to the frequency of the incident light.
5. Effect of Intensity:
- Increasing the intensity of the light increases the number of photons but does not change the energy of each photon (which depends on frequency).
- Therefore, the kinetic energy of the emitted electrons remains constant as long as the frequency of the incident light is constant.
6. Graph Analysis:
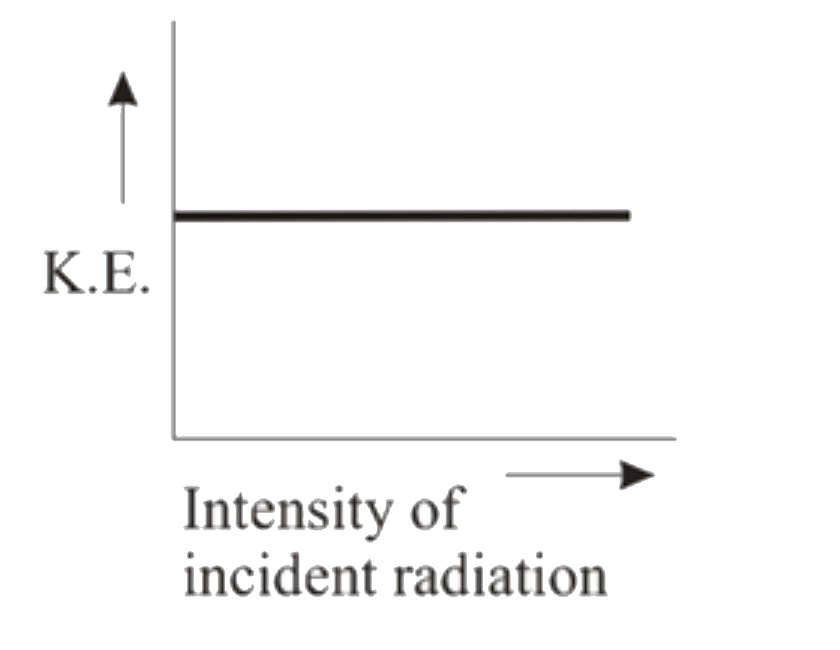
- The first plot showing kinetic energy versus intensity is correct because increasing intensity (number of photons) does not affect the kinetic energy.
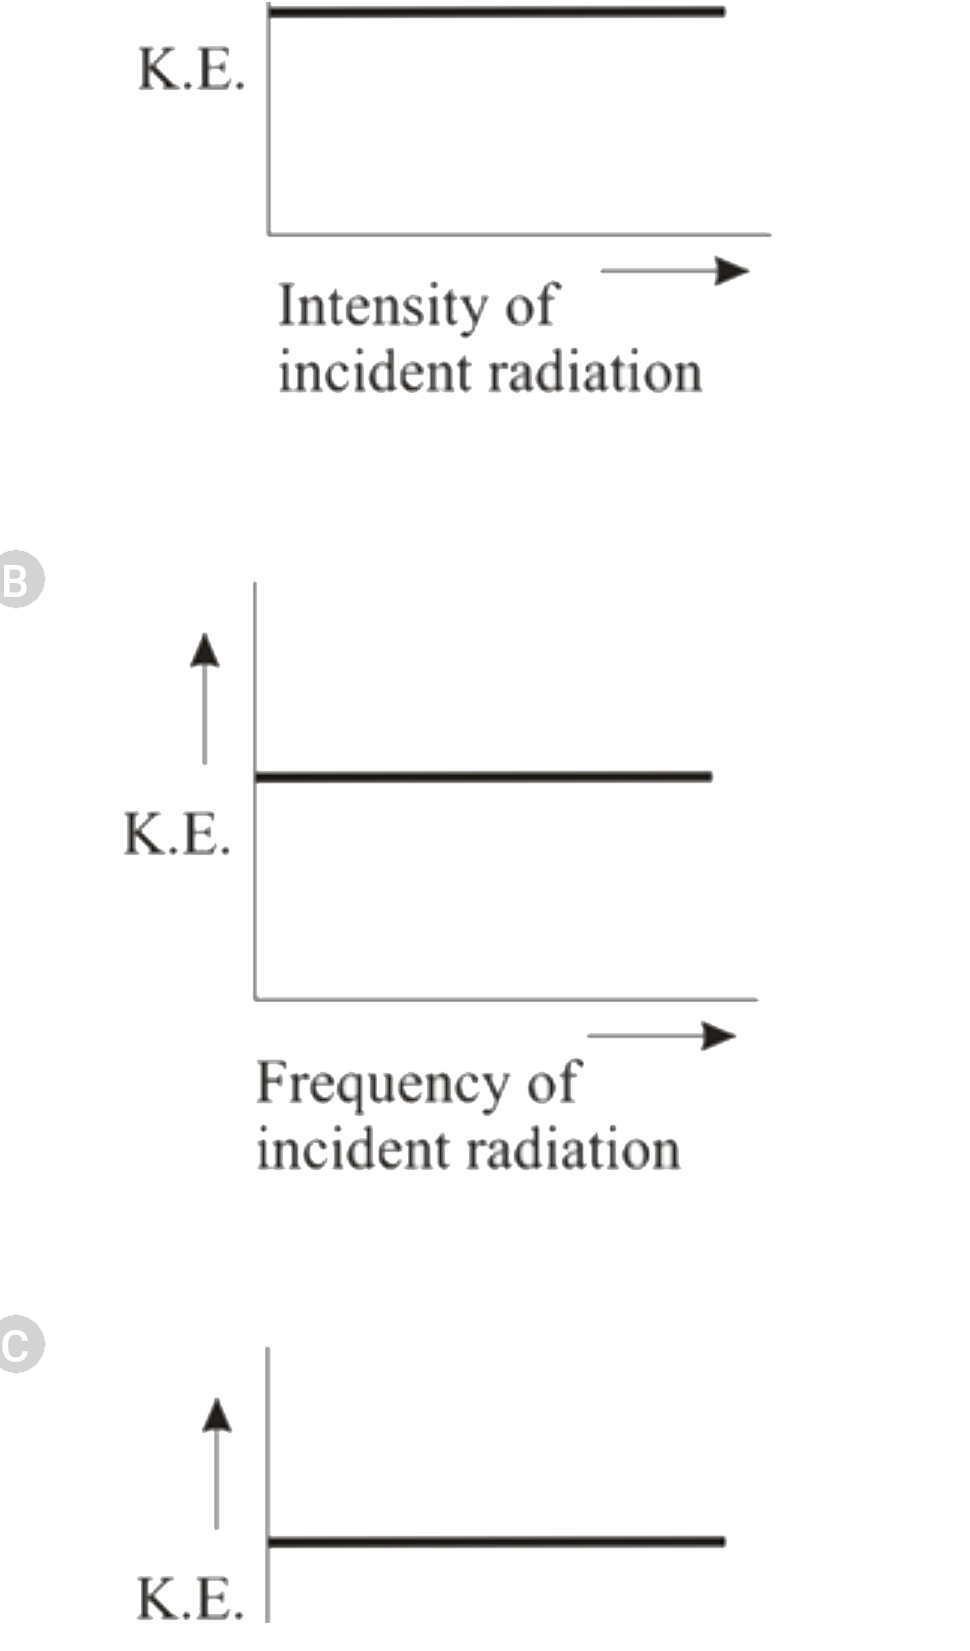
- The second plot, which suggests that kinetic energy remains constant while frequency is constant, is incorrect because kinetic energy should increase with increasing frequency.
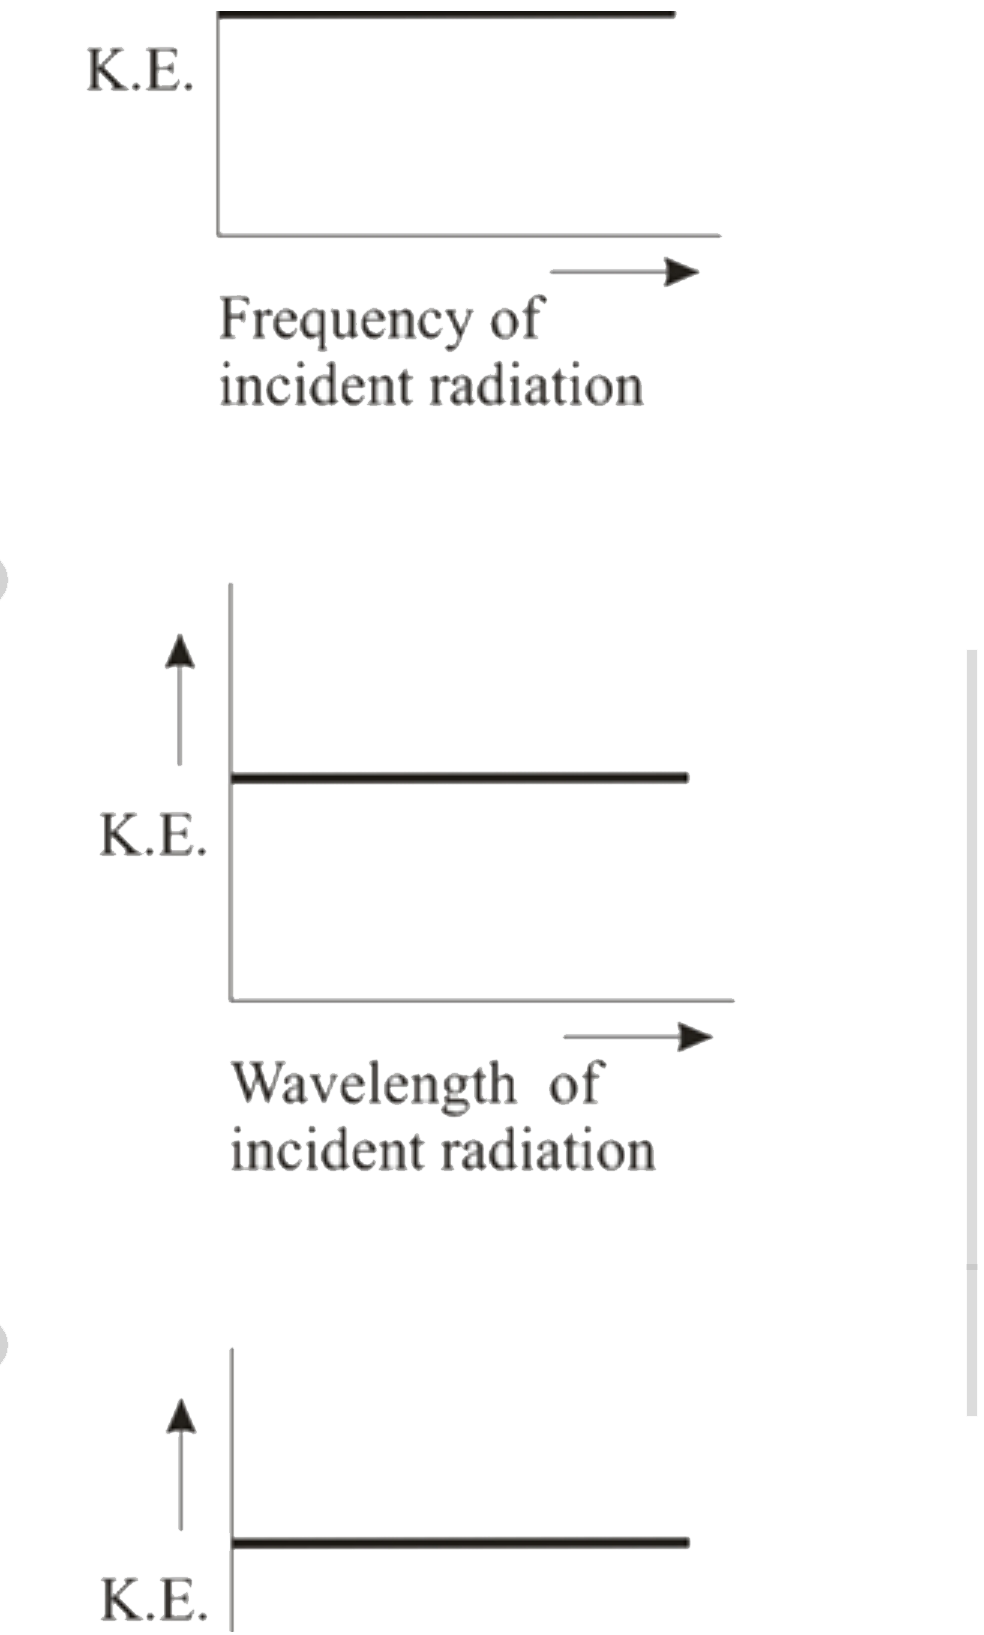
- The third plot, which relates kinetic energy and wavelength, is also incorrect because kinetic energy is inversely proportional to wavelength.
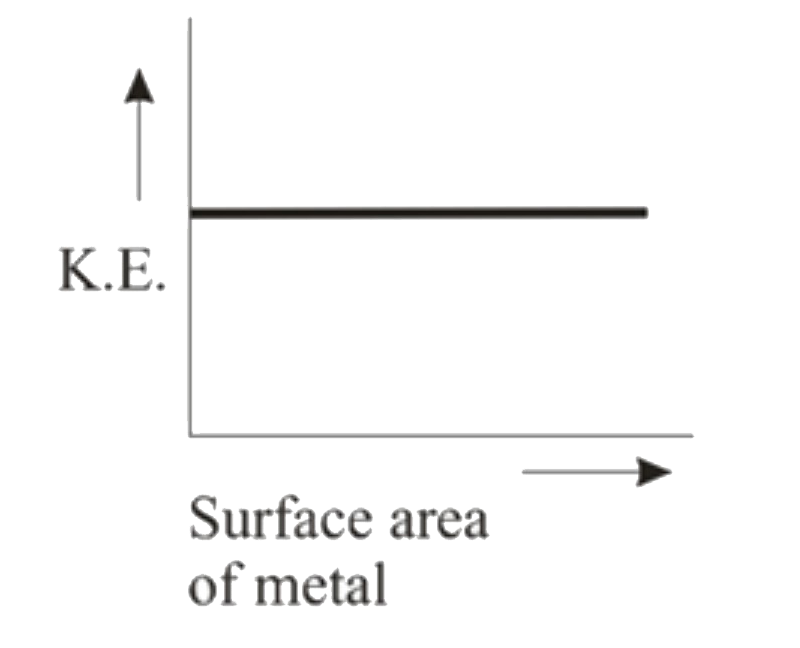
- The fourth plot relating kinetic energy and surface area is incorrect as well since surface area does not affect the kinetic energy of emitted electrons.
Conclusion:
The correct plot regarding the kinetic energy of photoelectrons is the first one, which shows that kinetic energy remains constant as intensity increases (while frequency is constant).
- When light of suitable frequency falls on a metal surface, electrons are emitted. This phenomenon is known as the photoelectric effect.
- The energy of the incident light can be expressed as E=hν, where h is Planck's constant and ν is the frequency of the light.
- Einstein provided the equation for the photoelectric effect:
E=ϕ+KEmax
where ϕ is the work function of the metal and KEmax is the maximum kinetic energy of the emitted photoelectrons.
- The work function ϕ can also be expressed in terms of the threshold frequency ν0:
ϕ=hν0
- The threshold frequency is the minimum frequency required to eject an electron from the metal surface.
- Rearranging Einstein's equation gives:
KEmax=hν−hν0
- This shows that the maximum kinetic energy of the photoelectrons is directly proportional to the frequency of the incident light.
- Increasing the intensity of the light increases the number of photons but does not change the energy of each photon (which depends on frequency).
- Therefore, the kinetic energy of the emitted electrons remains constant as long as the frequency of the incident light is constant.
- The first plot showing kinetic energy versus intensity is correct because increasing intensity (number of photons) does not affect the kinetic energy.
- The second plot, which suggests that kinetic energy remains constant while frequency is constant, is incorrect because kinetic energy should increase with increasing frequency.
- The third plot, which relates kinetic energy and wavelength, is also incorrect because kinetic energy is inversely proportional to wavelength.
- The fourth plot relating kinetic energy and surface area is incorrect as well since surface area does not affect the kinetic energy of emitted electrons.
The correct plot regarding the kinetic energy of photoelectrons is the first one, which shows that kinetic energy remains constant as intensity increases (while frequency is constant).
Topper's Solved these Questions
Similar Questions
Knowledge Check
Which of the following plots are correct ?
A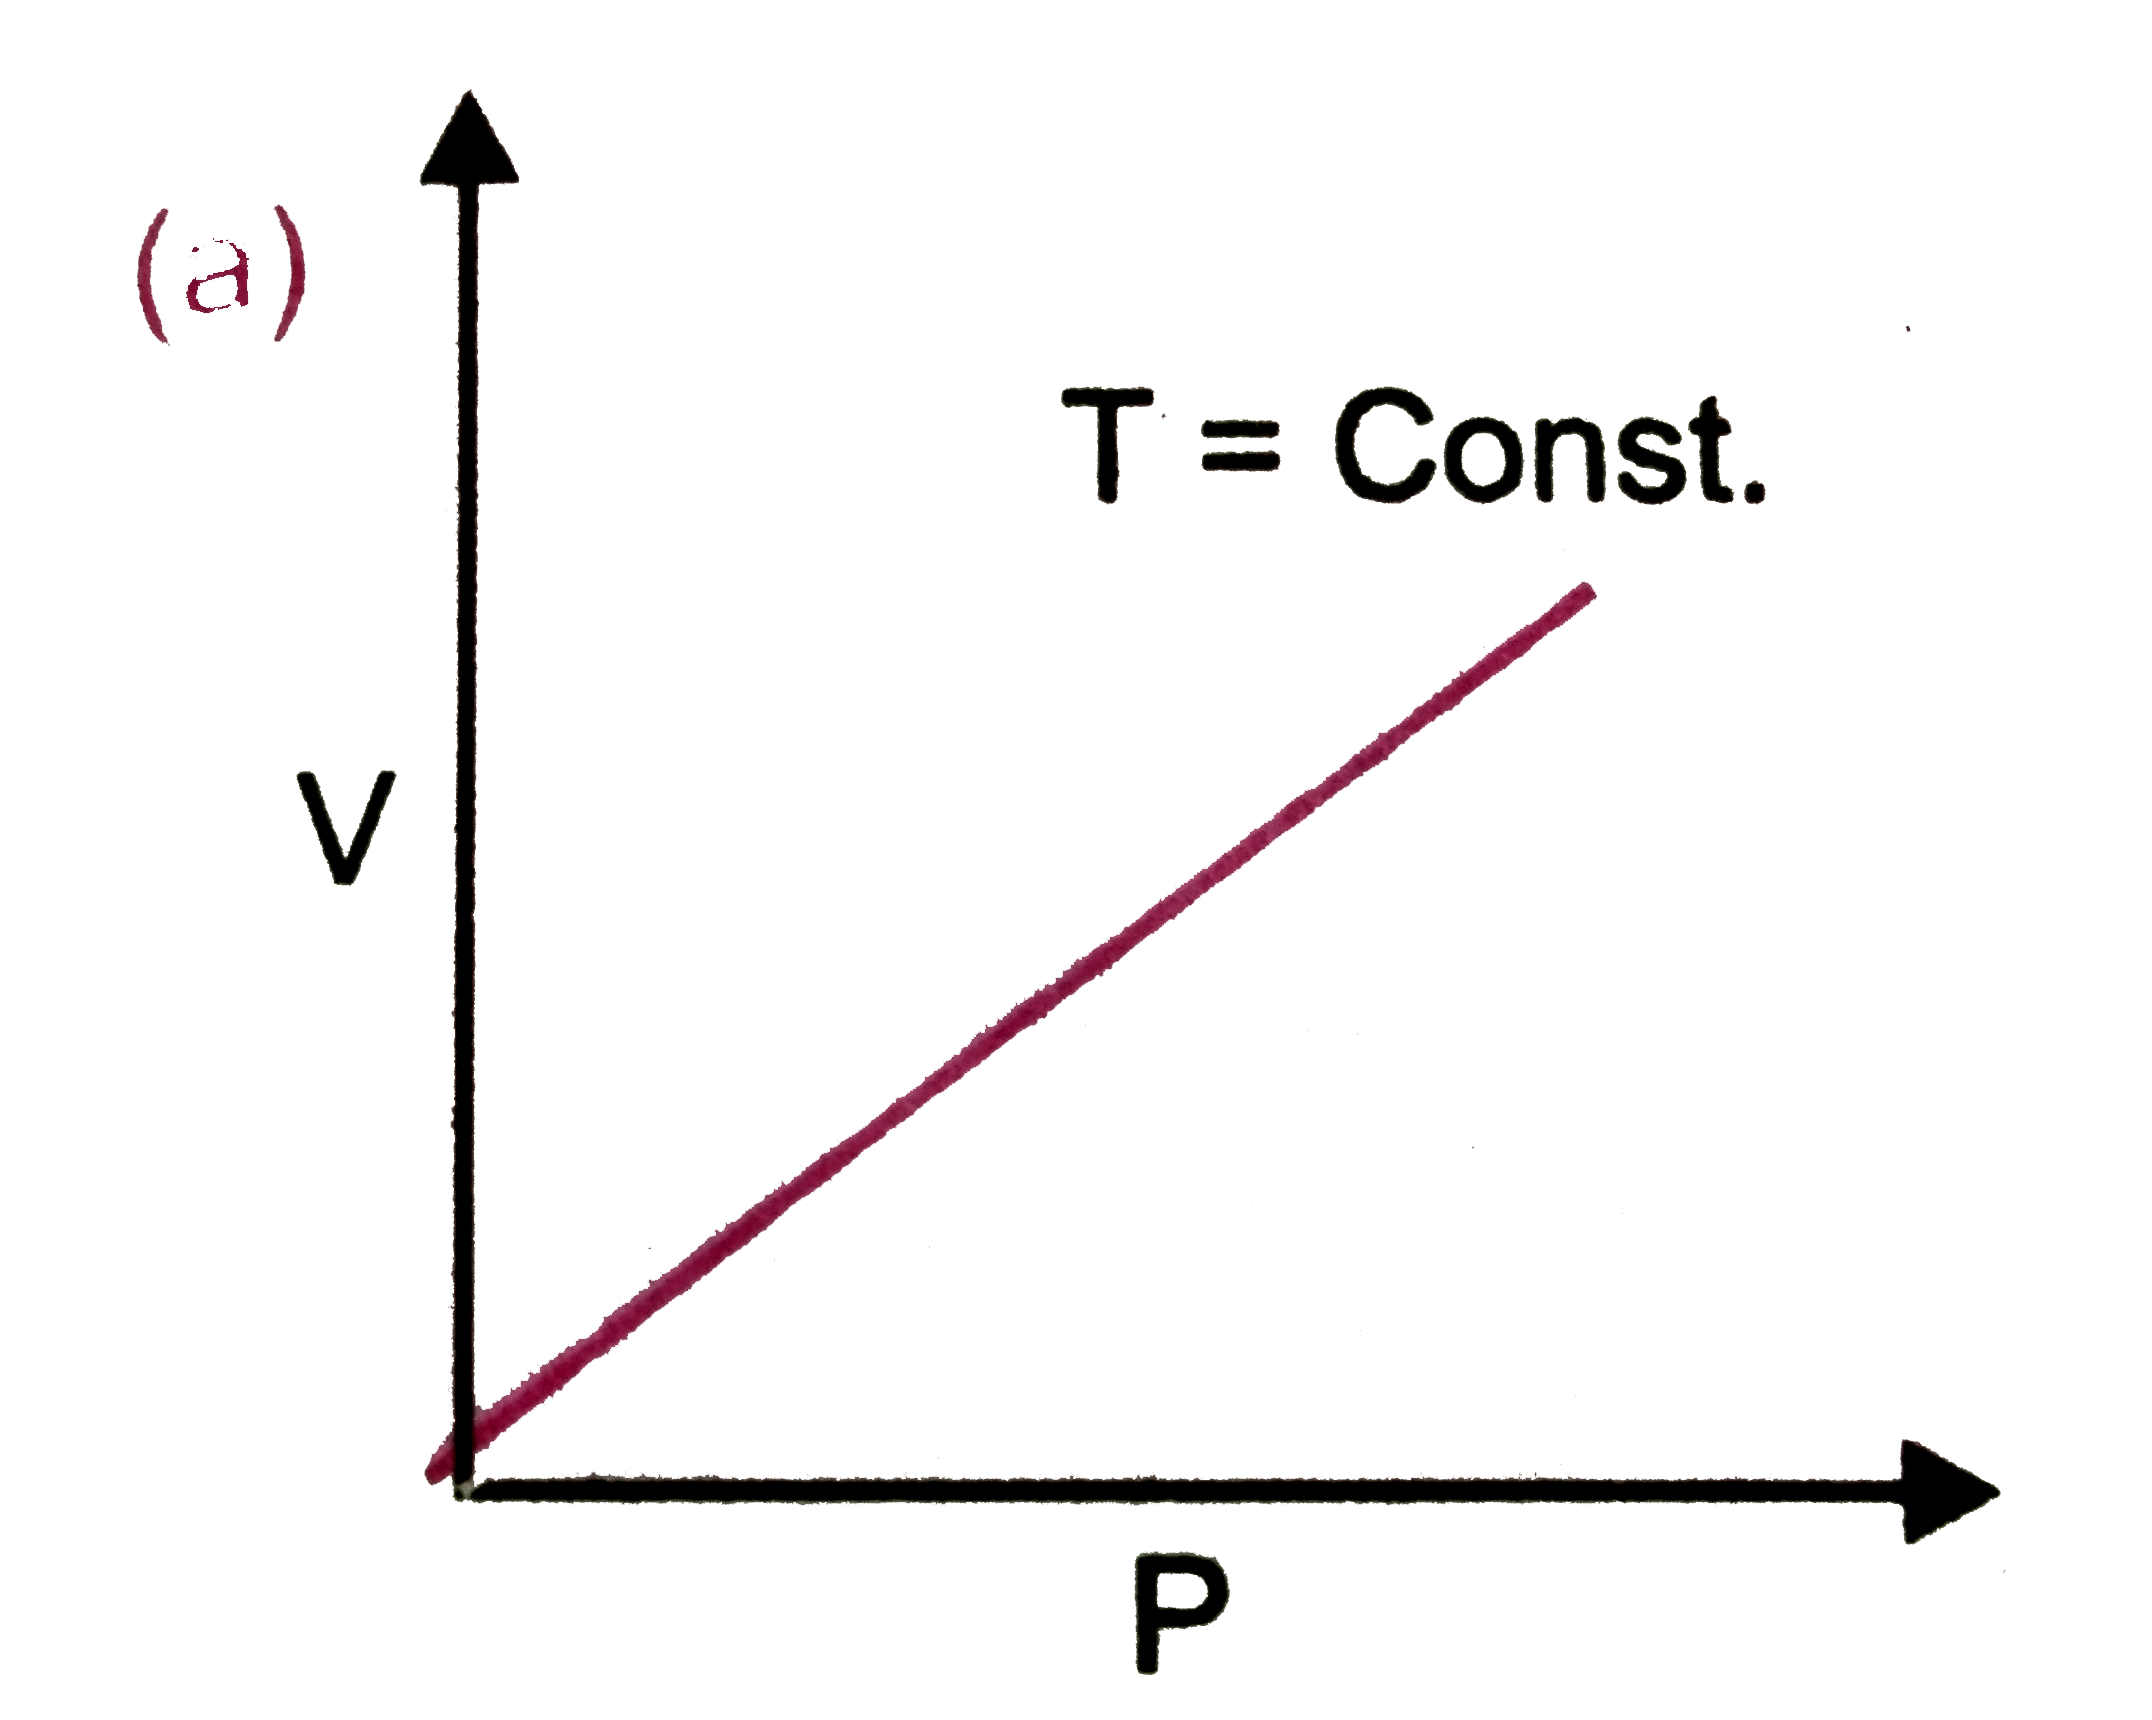 B
B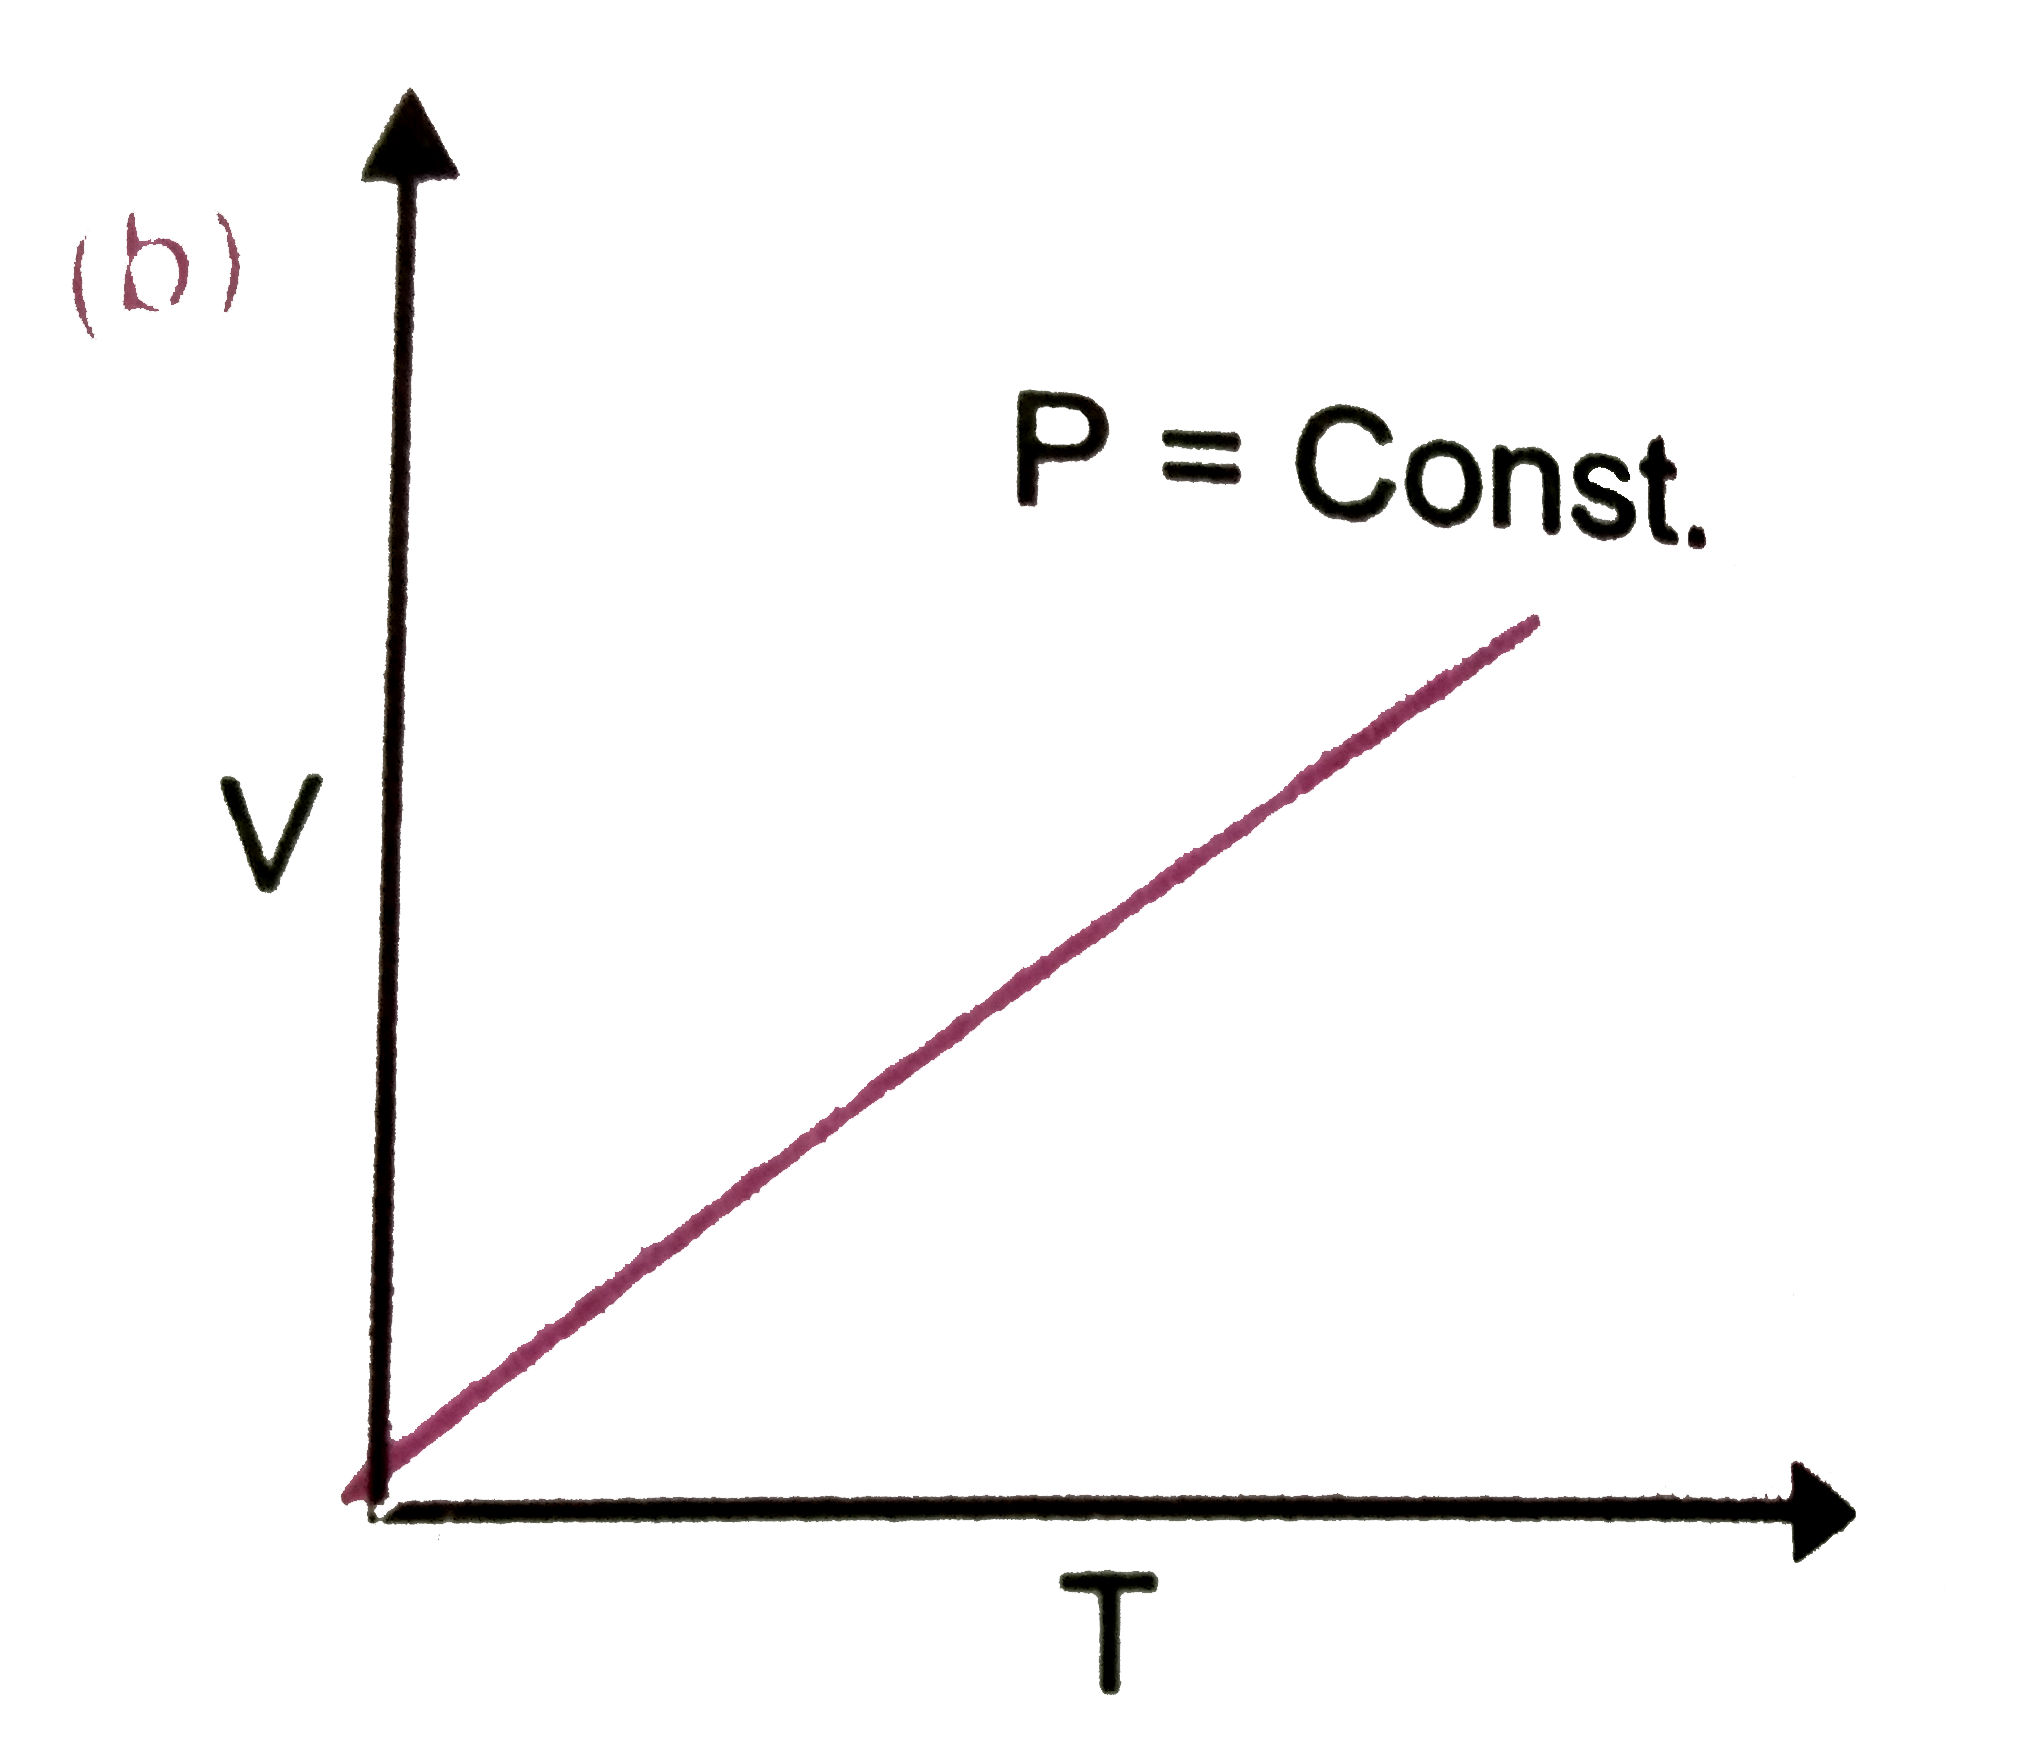 C
C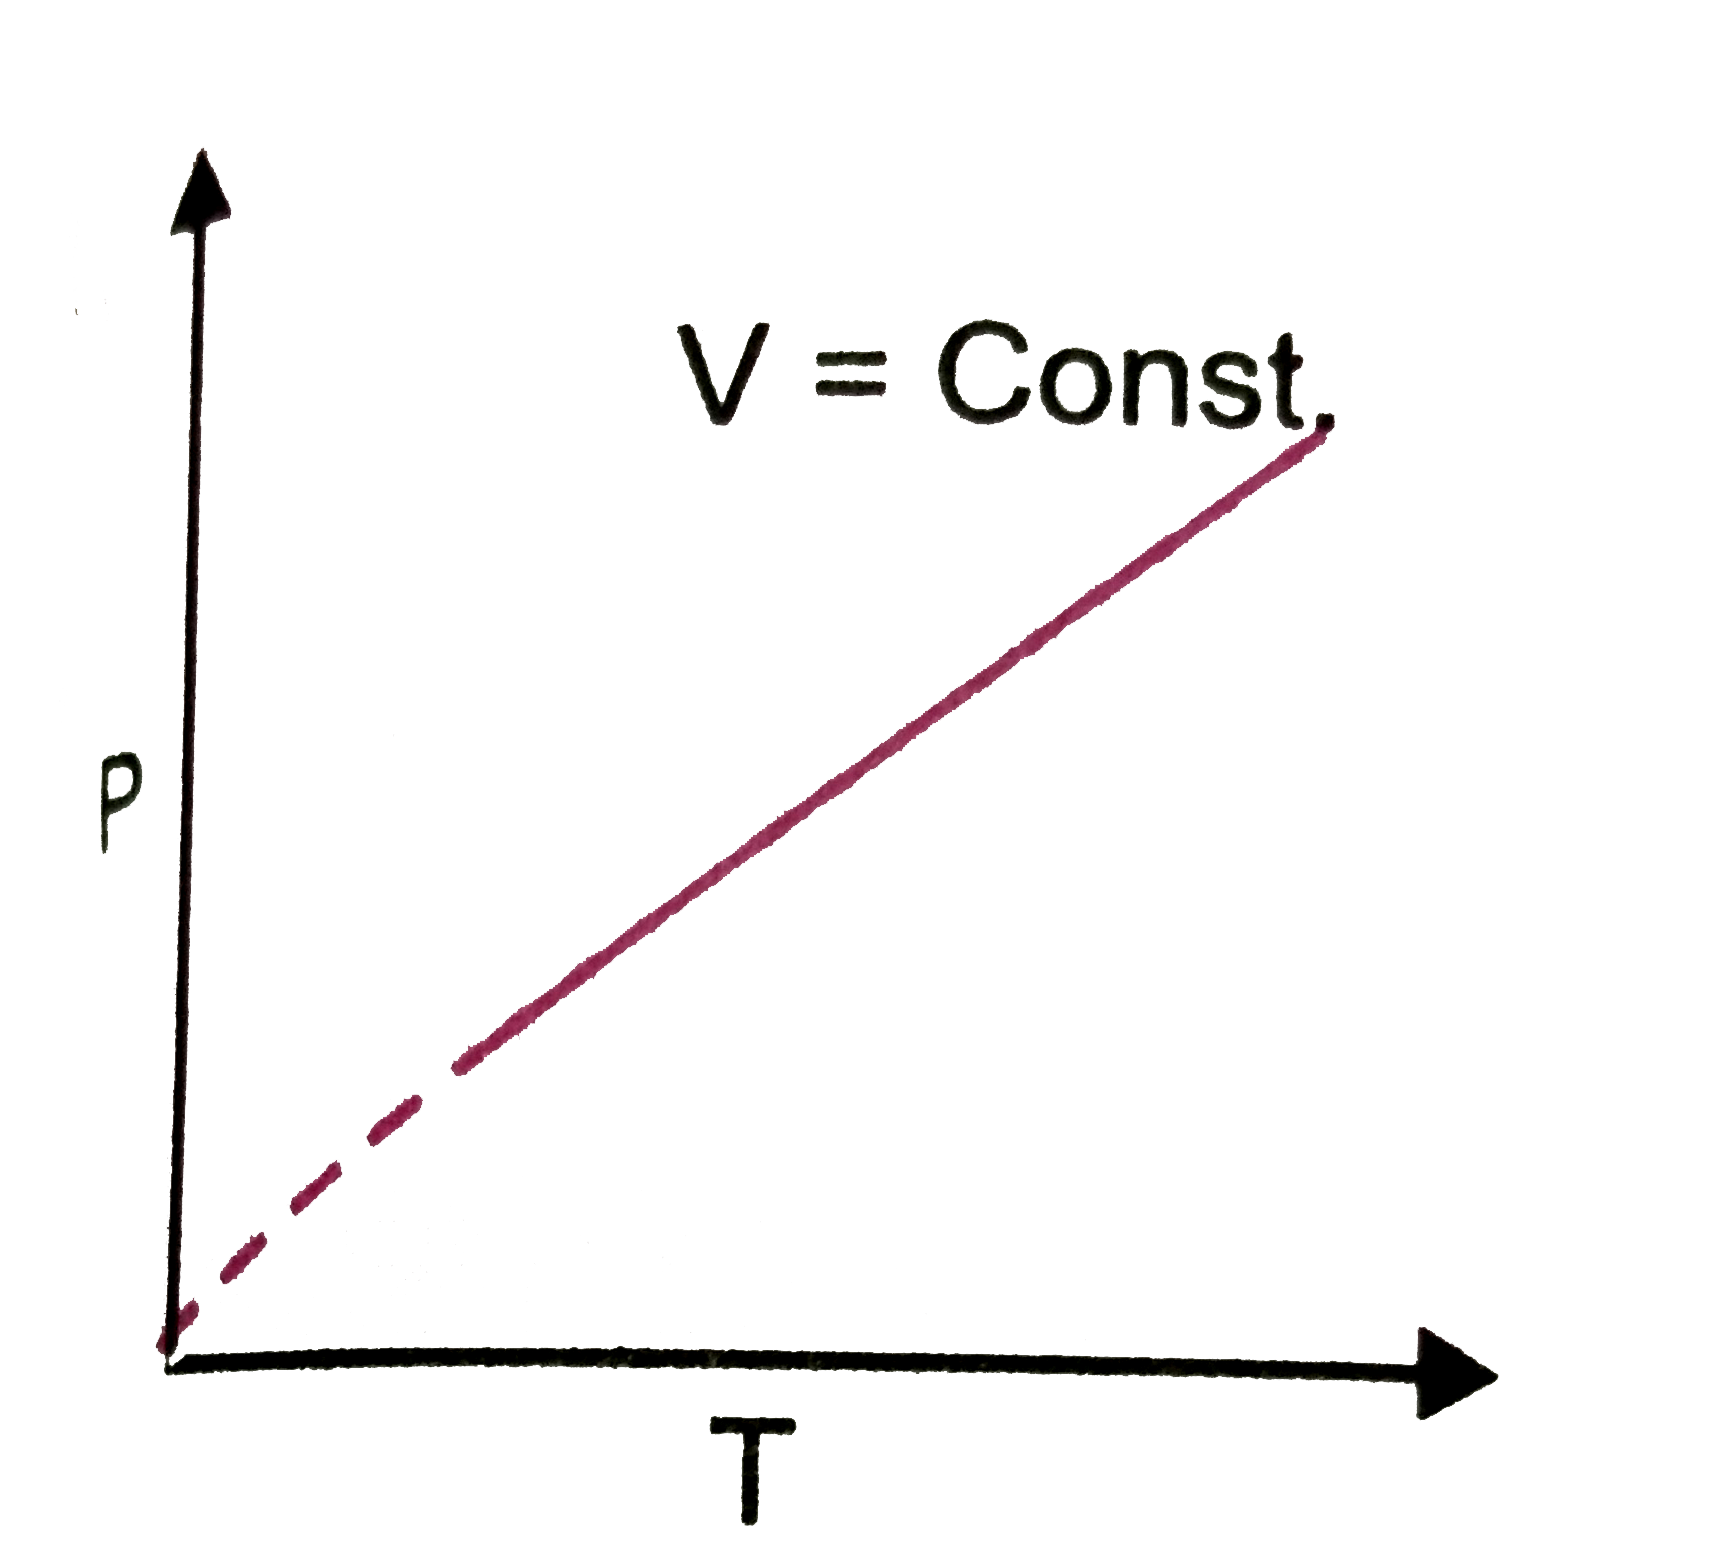 D
D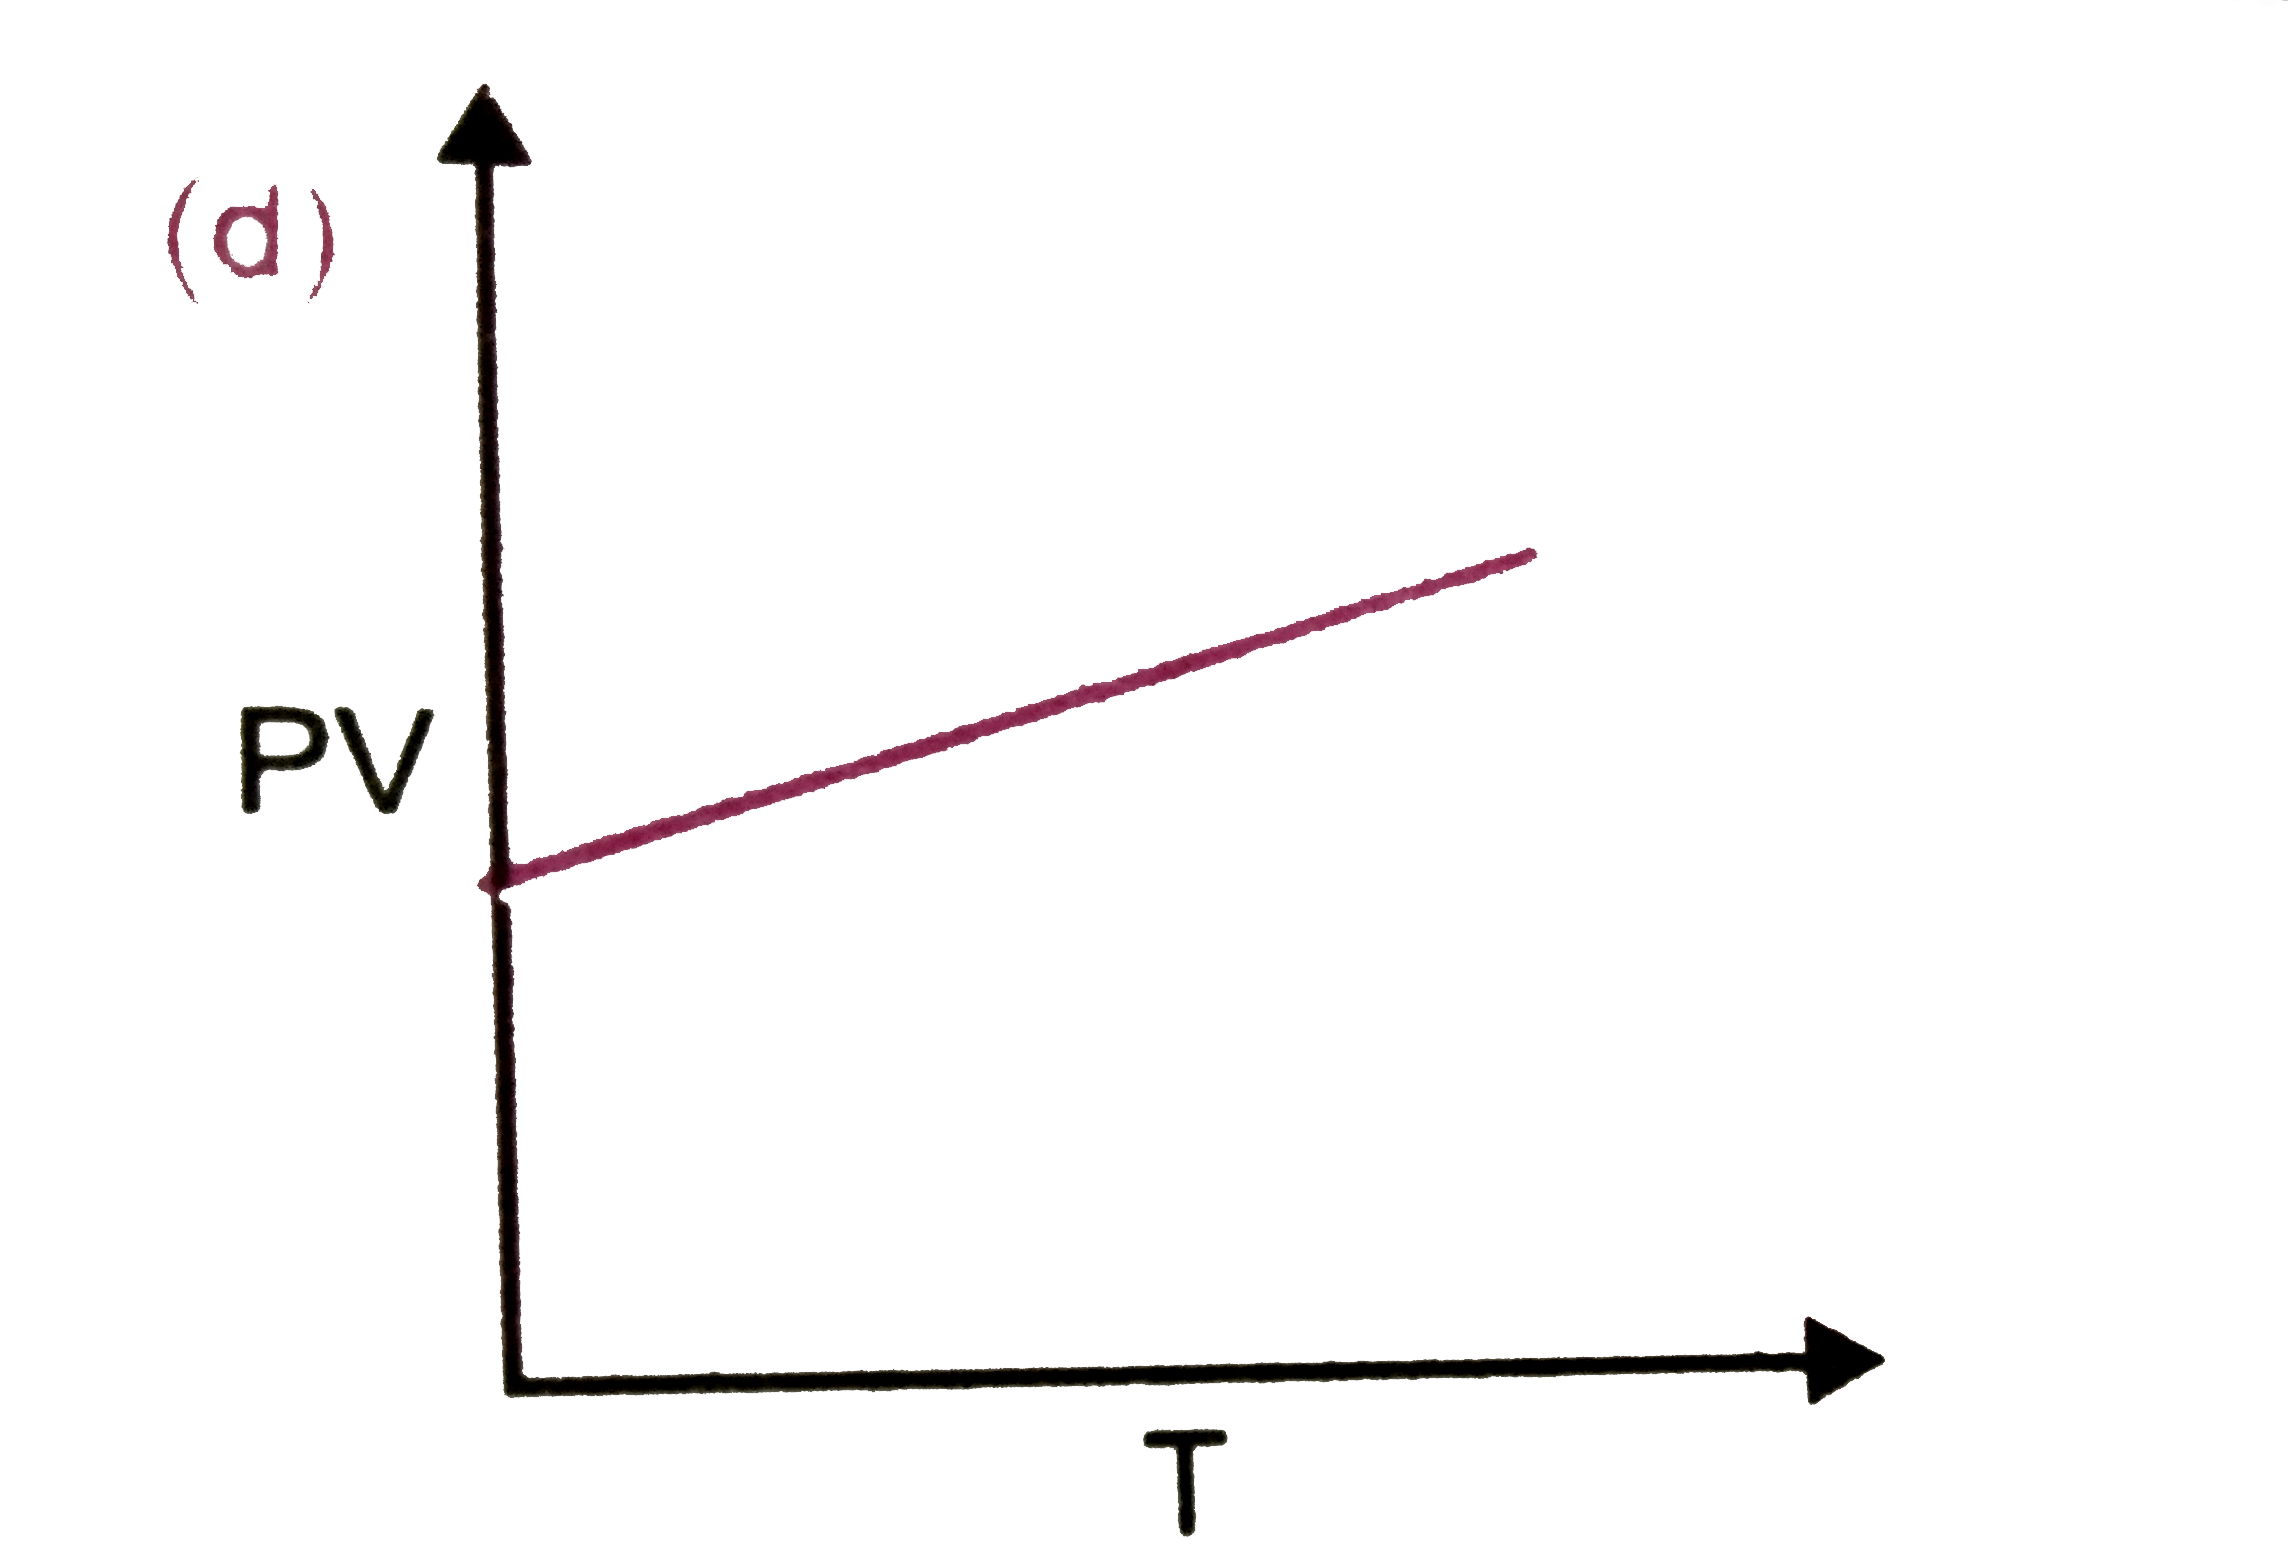
Which of the following statements are correct about the kinetics of this reaction ?
AThe rate of reaction depends on the concentration of only (ii)BThe rate of reaction depends on concentration of both (i) and (ii)CMoleculirity of reaction is oneDMolecularity of reaction is twoWhich of the following statements are correct about the kinetics of this reaction ?
AThe rate of reaction depends on the concentration of only (ii).BThe rate of reaction depends on concentration of both (i) and (ii).CMolecularity of reaction is one.DMolecularity of reaction is two.

Which of the following statements are correct about the kinetics of this reactions?
View SolutionWhich of the following graph is correct between kinetic energy E, potential energy (U) and height (h) from the ground of the partical
View SolutionWhich of the following graph is correct between kinetic energy E, potential energy (U) and height (h) from the ground of the partical
View SolutionThe maximum kinetic energy of the photoelectrons veries
View SolutionWhich of the following statements is/are correct about internal energy?
View Solution
