If a plot a V vs .∘C at constant pressure is drawn, at what temperatures will it cut the volume and temperature axes?
Topper's Solved these Questions
- STATES OF MATTERBOOK - CENGAGE CHEMISTRYCHAPTER - STATES OF MATTEREXERCISE - Exercises (Fill In The Blanks)
25 Videos
- STATES OF MATTERBOOK - CENGAGE CHEMISTRYCHAPTER - STATES OF MATTEREXERCISE - Exercises (Ture False)
25 Videos
- STATES OF MATTERBOOK - CENGAGE CHEMISTRYCHAPTER - STATES OF MATTEREXERCISE - Ex 5.3
16 Videos
- SOME BASIC CONCEPTS AND MOLE CONCEPTBOOK - CENGAGE CHEMISTRYCHAPTER - SOME BASIC CONCEPTS AND MOLE CONCEPTEXERCISE - Archives Subjective
11 Videos
- STOICHIOMETRYBOOK - CENGAGE CHEMISTRYCHAPTER - STOICHIOMETRYEXERCISE - Archives Subjective
33 Videos
Similar Questions
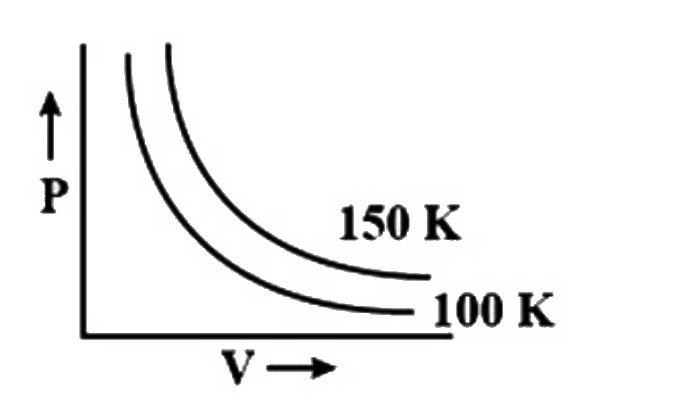
A graph is plotted between pressure and volume at different temperature. On the basis of the graph what changes will you observe in the volume if
(i) the pressure is increased at constant temperature
(ii) the temperature is decreased at constant pressure
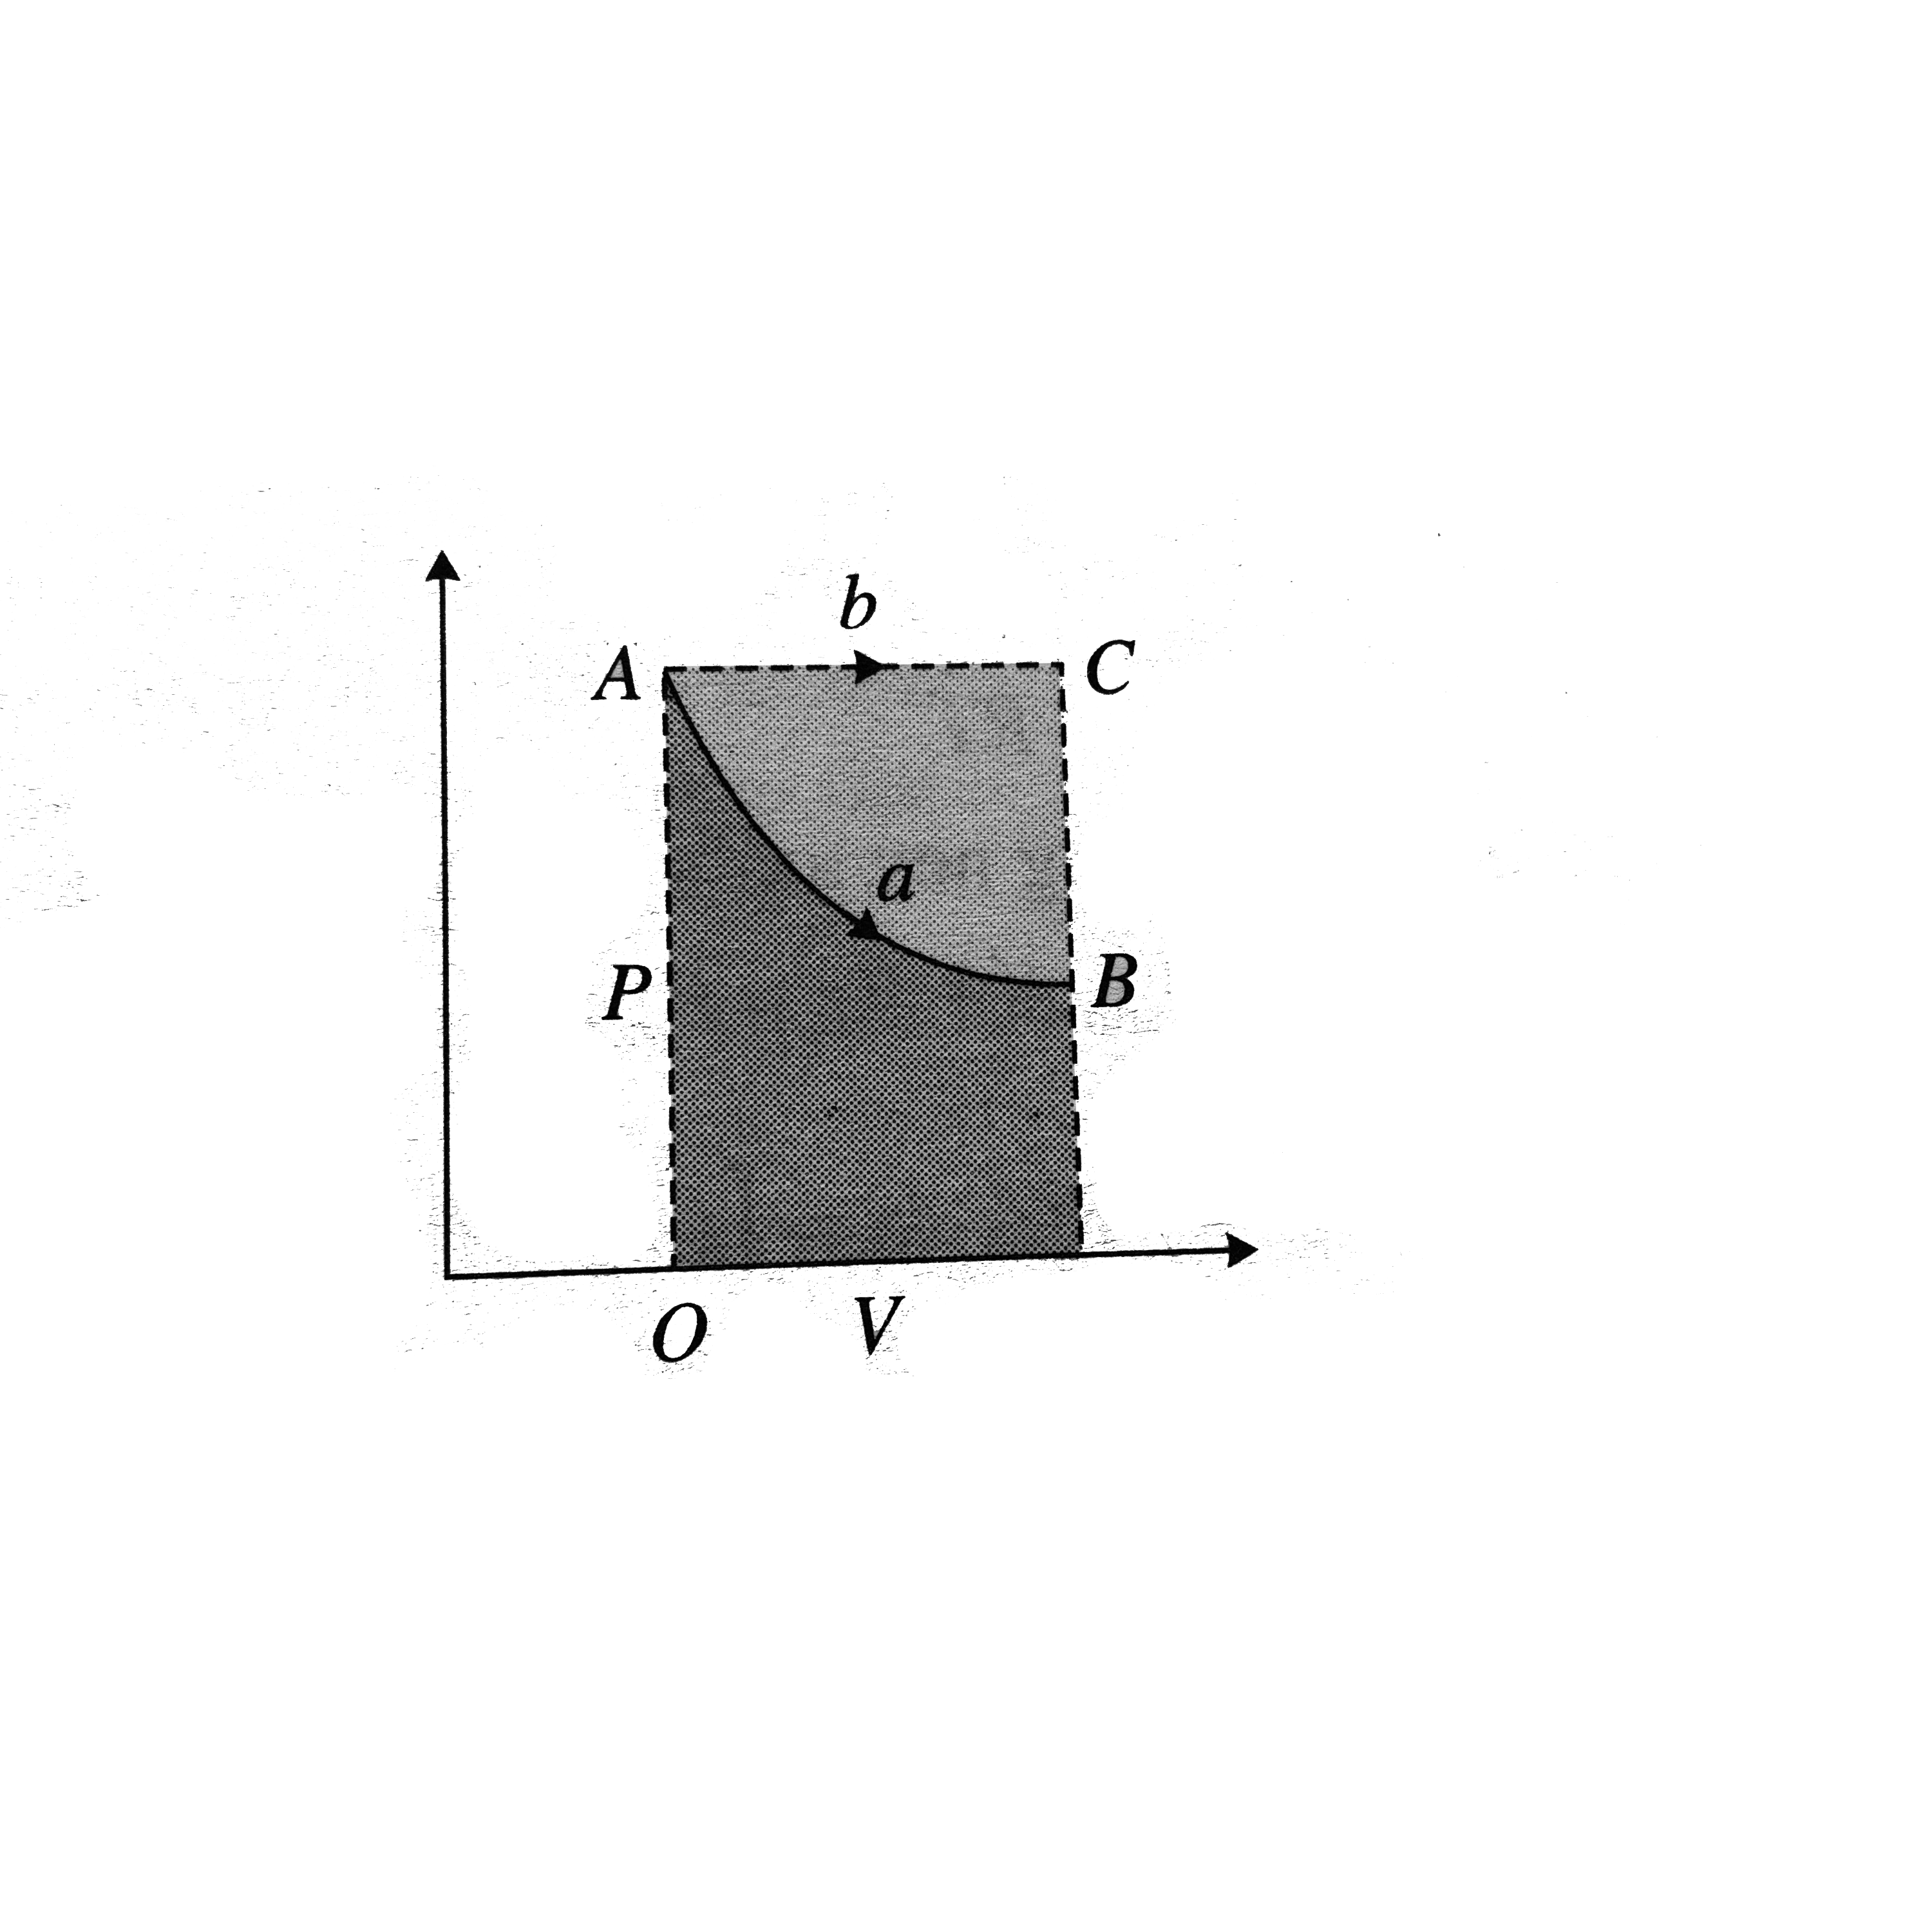
View SolutionA quantity of gas occupies an initial volume V0 at pressure p0 and temperature T0. It expands to a volume V (a) constant temperature and (b) constant pressure. In which case does the gas do more work ?
View Solution
Knowledge Check
Pressure remaining constant, at what temperature the volume of a gas will be double of its volume at 0∘C ?
A100∘CB546∘CC273KD546KAn ideal gas has volumeV0 at . 27∘C It is heated at constant pressure so that its volume becomes . 2V0.The final temperature is
A54∘CB32.6∘CC327∘CD150 kA plot of volume (V)versus temperature (T) for agas at constant pressure is a straight line passing through the origin the plots at different values of pressure are show in the figure which of the following order of pressure is correct for this gas?
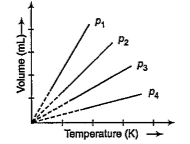 Ap1>p2>p3>p4Bp1=p2=p3=p4Cp1<p2<P3<p4Dp1<p2=p=3<p4
A quantity of gas occupies an initial volume V0 at pressure p0 and temperature T0. It expands to a volume V (a) constant temperature and (b) constant pressure. In which case does the gas do more work ?

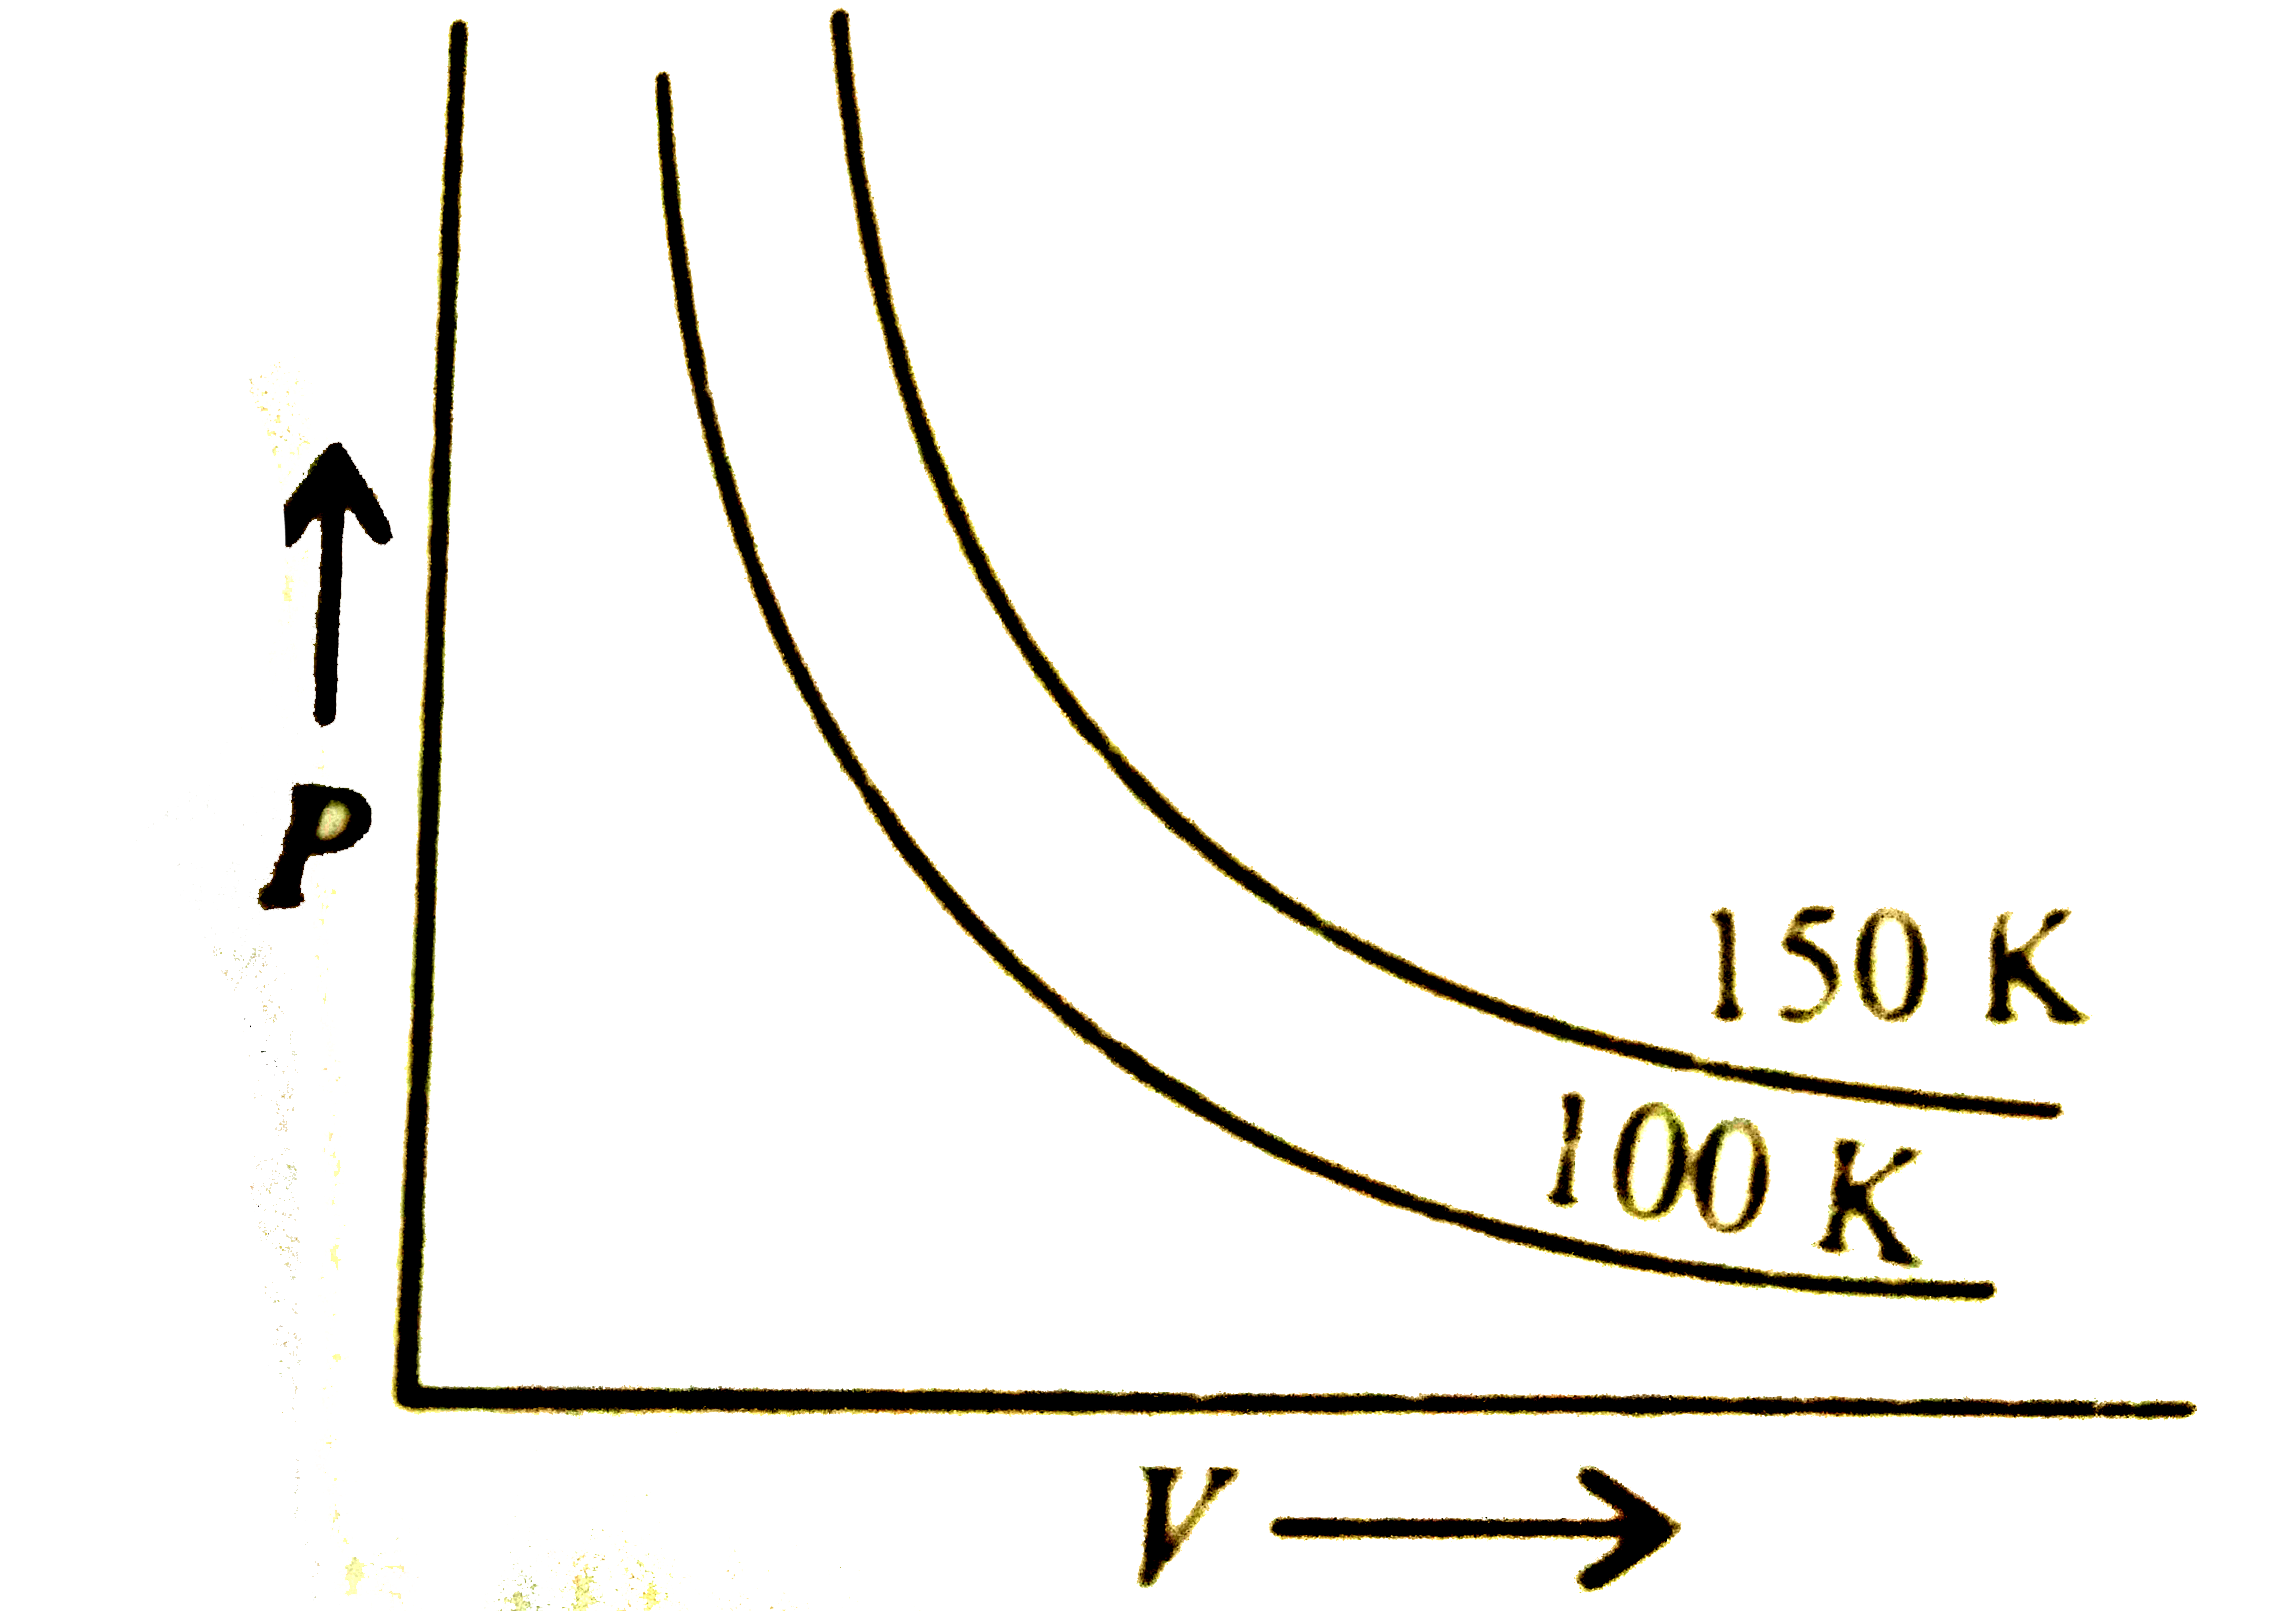
View SolutionA graph is plotted between pressure and volume at different temperatures . On the basis of the graph what changes will you observe in the volume if
(i) the pressure is increased at constant temperature .
(ii) the temperature is decreased at constant pressure .
View SolutionA plot of volume (V) versus temperature (T) for a gas at constant pressure is a straight line passing through the origin. The plots at different values of pressure are shown in figure. Which of the following order of pressure is correct for this gas ?
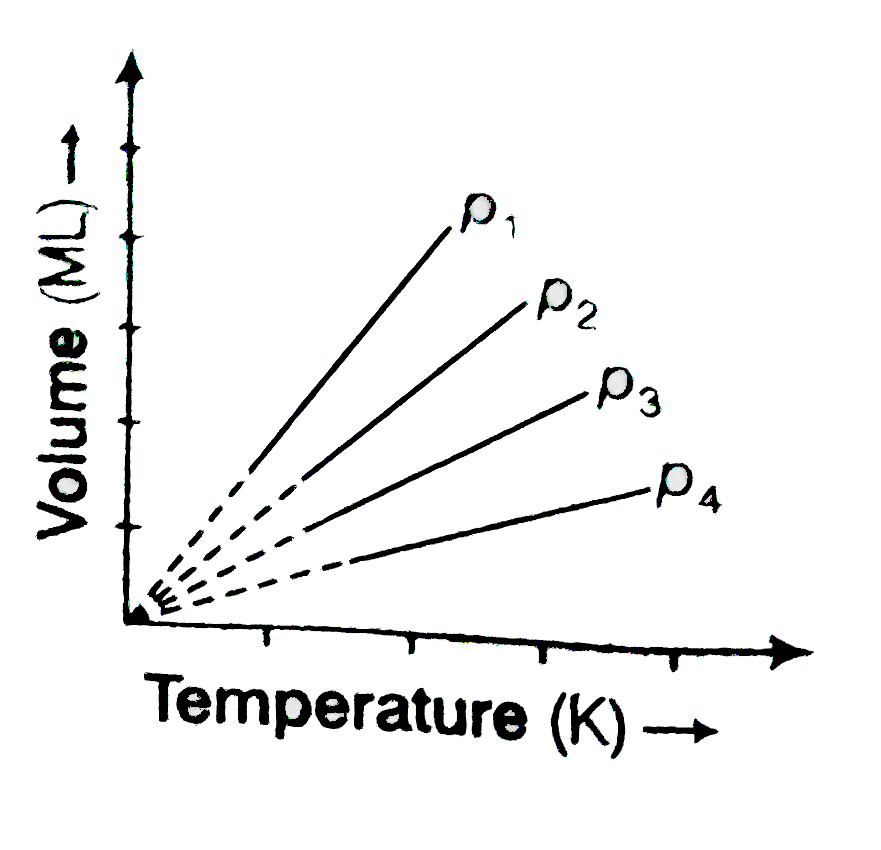
View SolutionA plot of volume (V) versus temperature (T) for a gas at constant pressure is a straight line passing through the origin . The plots at different values of pressure are shown in figure .
Which of the following order of pressure is correct for this gas ?
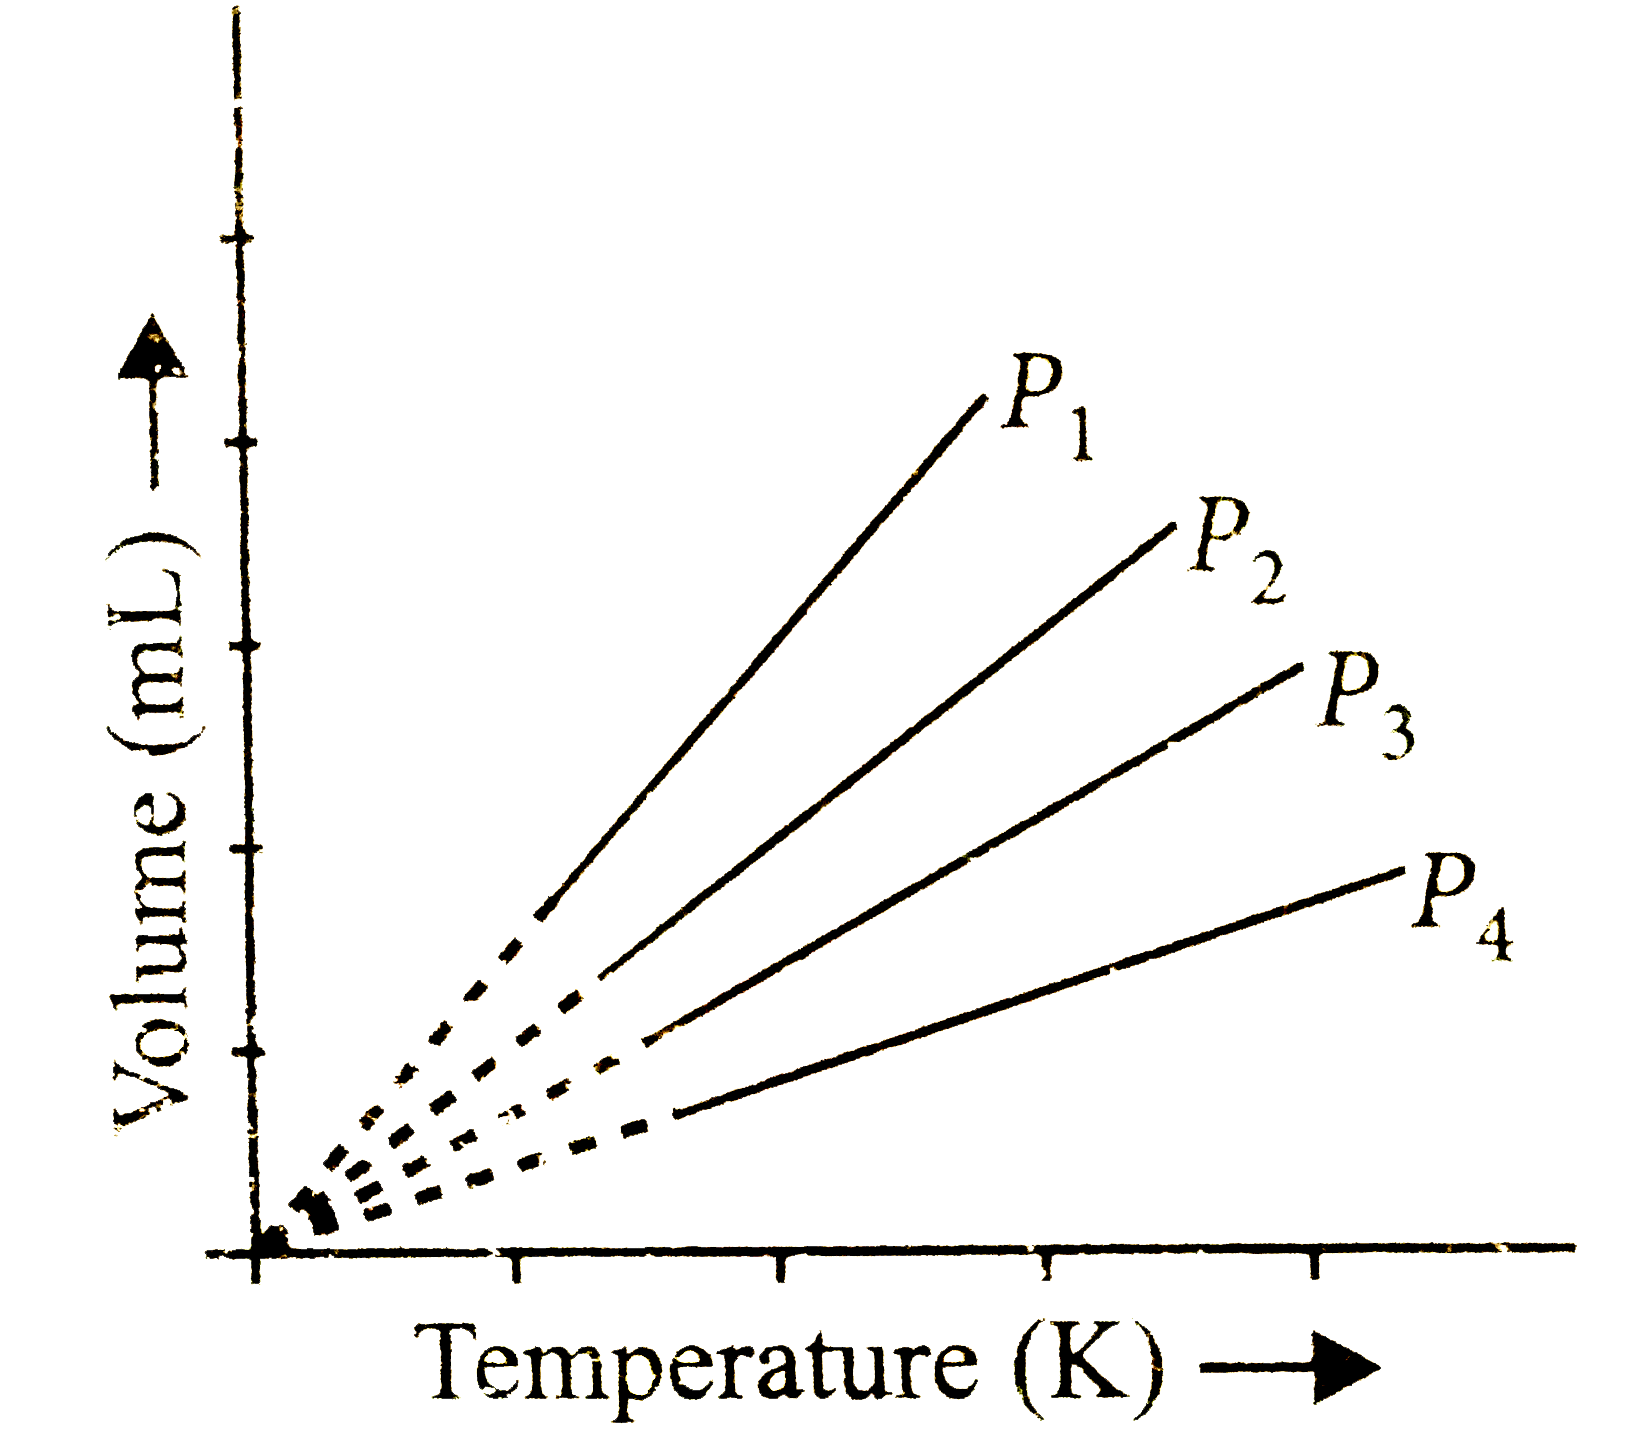
View SolutionA plot of volume (V) versus temperature (T) for a gas at constant pressure is a straight line passing through the origin. The plots at different values of pressure are shown in figure. Which of the following order of pressure is correct for this gas ?

View Solution

