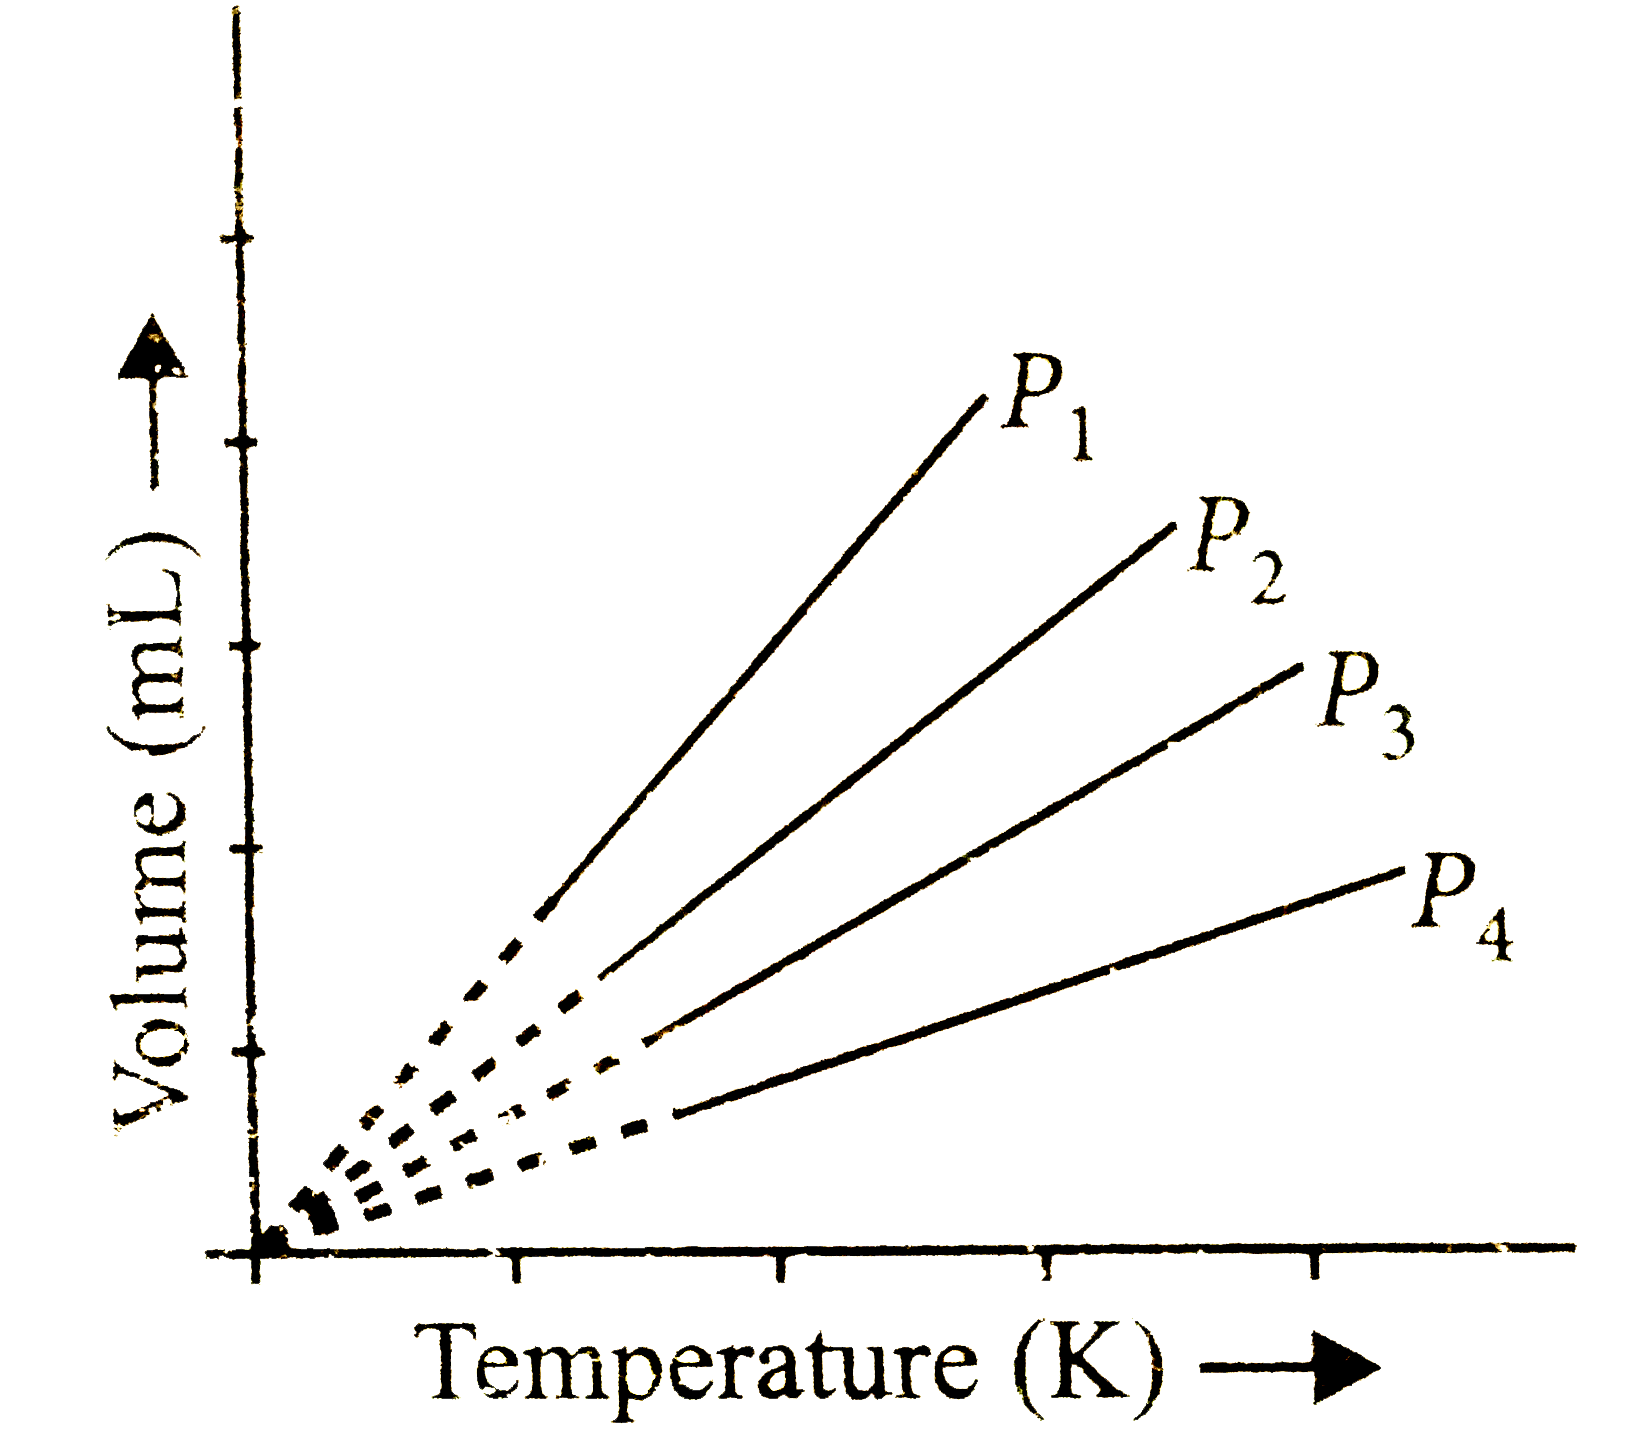
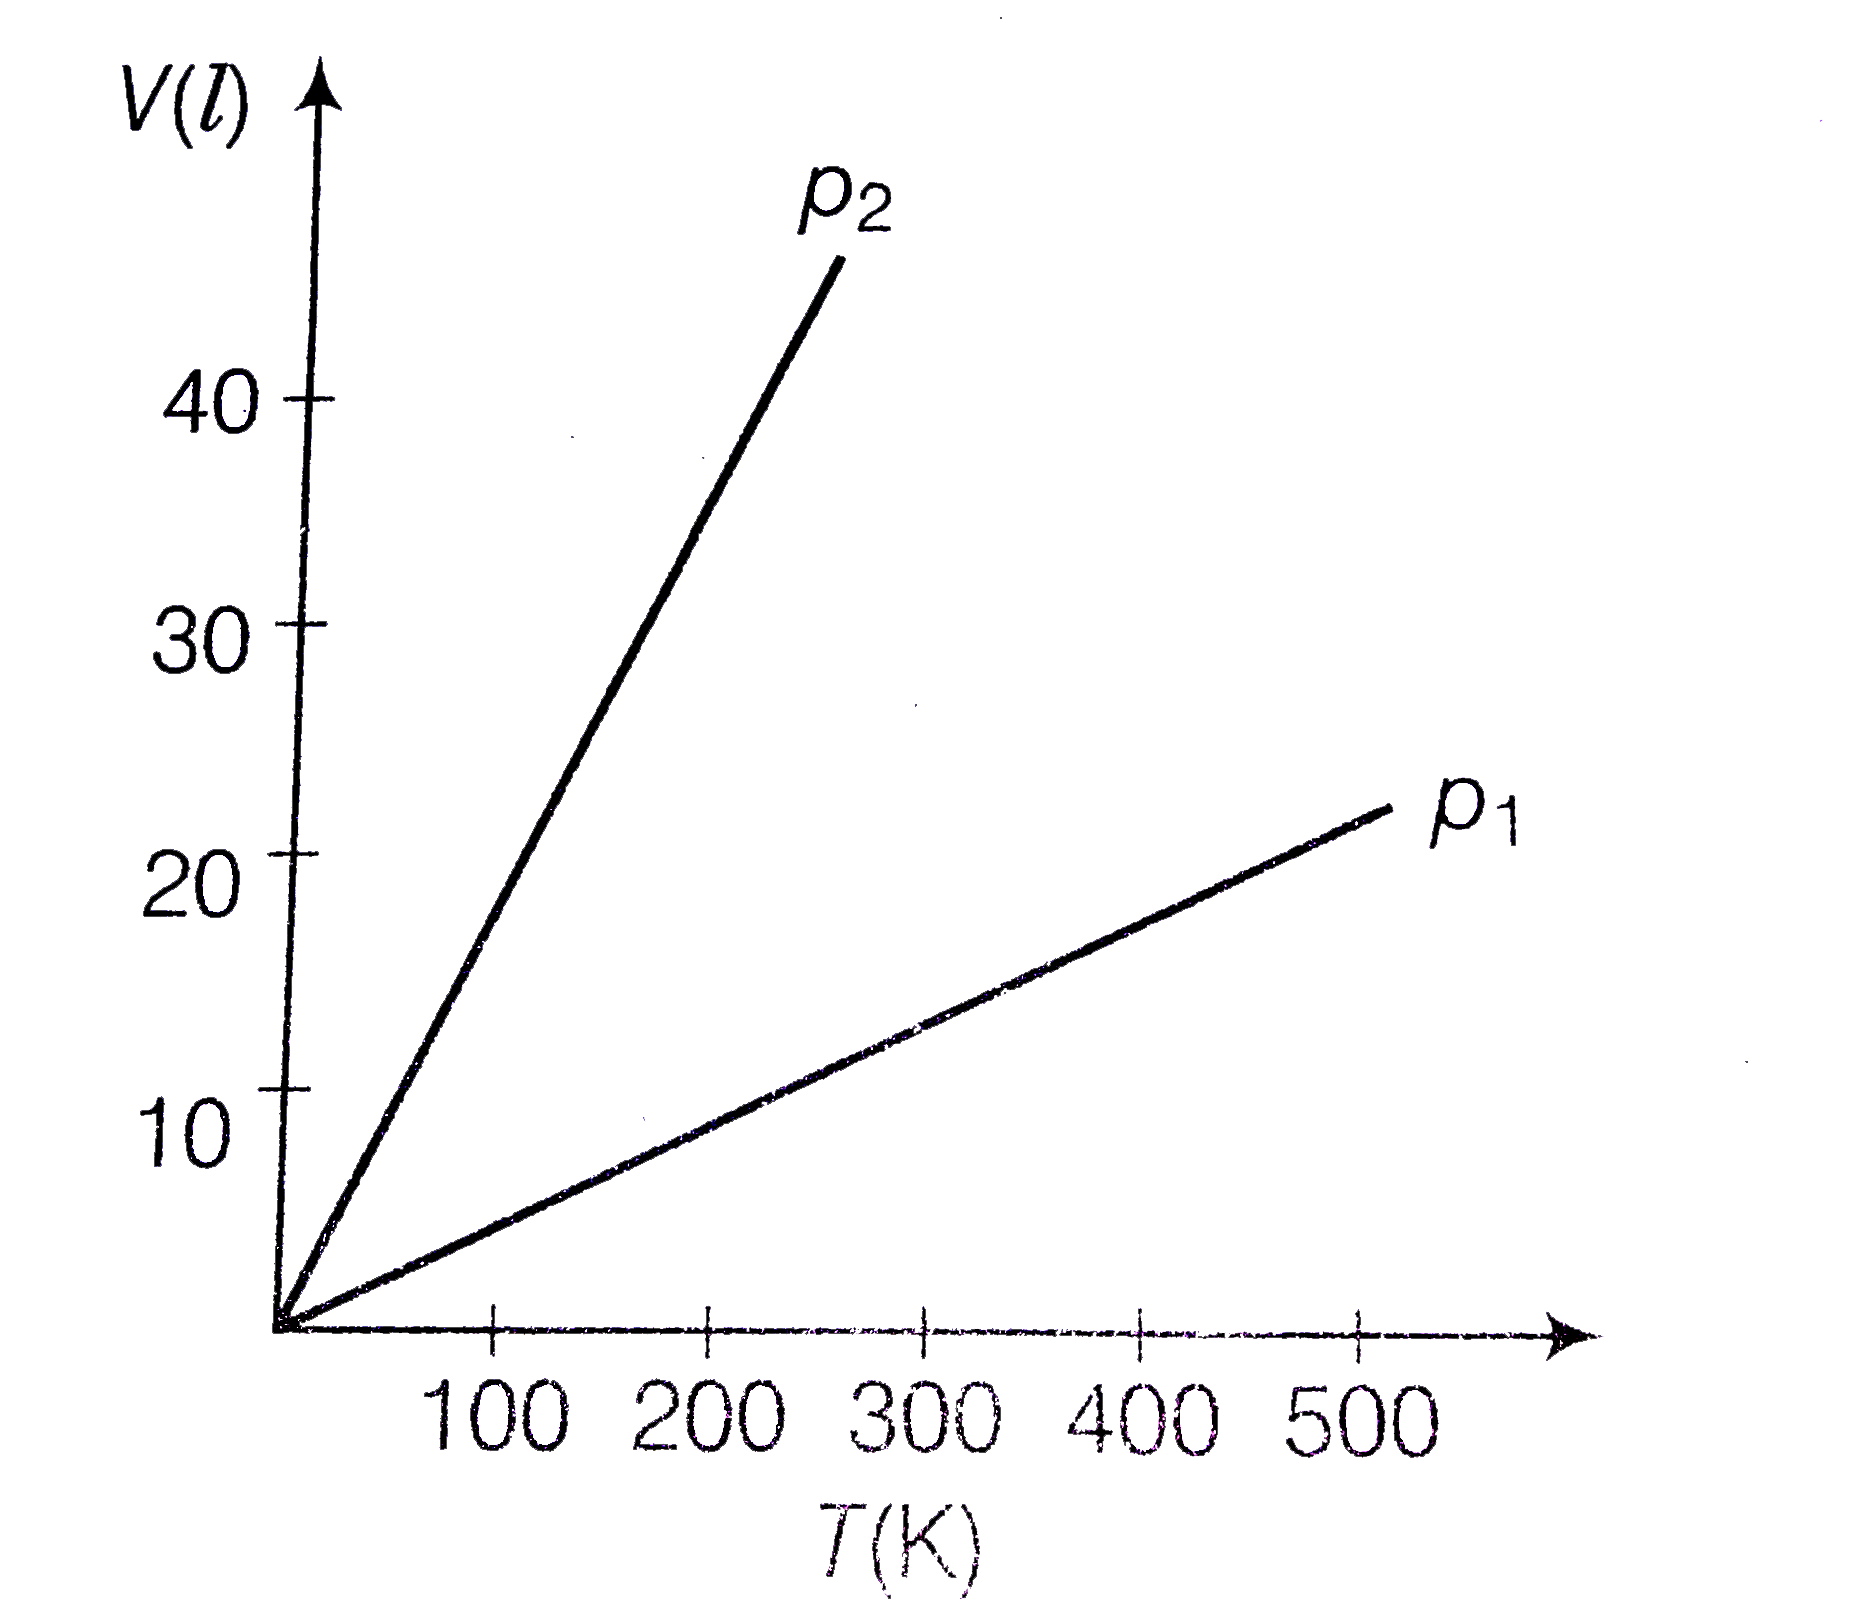
A plot of volume (V) versus temperature (T) for a gas at constant pressure is a straight line passing through the origin . The plots at different values of pressure are shown in figure .
Which of the following order of pressure is correct for this gas ?
P1>P2>P3>P4
P1=P2P2=P3=P4
P1<P2<P3<P4
P1<P2=P3<P4
The correct Answer is:C
PV = constant at gives temperature
∴P1V1=P2V2=P3V3=P4V4
Now, V1>V2>V3>V4 (From the figure)
Hence, P1<P2<P3<P4 (∵P∝1V)
Topper's Solved these Questions
- BOOK - NCERT FINGERTPS ENGLISHCHAPTER - STATES OF MATTER EXERCISE - ASSERTION & REASON15videos
STATES OF MATTER
- BOOK - NCERT FINGERTPS ENGLISHCHAPTER - STATES OF MATTER EXERCISE - Intermolecular Forces4videos
STATES OF MATTER
- BOOK - NCERT FINGERTPS ENGLISHCHAPTER - STATES OF MATTER EXERCISE - HOTS (HIGHER ORDER THINKING SKILLS)10videos
STATES OF MATTER
- BOOK - NCERT FINGERTPS ENGLISHCHAPTER - SOME BASIC CONCEPTS OF CHEMISTRY EXERCISE - NCERT Exemplar11videos
SOME BASIC CONCEPTS OF CHEMISTRY
- BOOK - NCERT FINGERTPS ENGLISHCHAPTER - STRUCTURE OF ATOM EXERCISE - Assertion And Reason15videos
STRUCTURE OF ATOM
Similar Questions
The graph pressure versus temperature (T) at constant volume is a straight line.(T/F)
View SolutionV vs T curves at constant pressure P1 and P2 for an ideal gas are shown in the figure. Which of the following is correct?
 View Solution
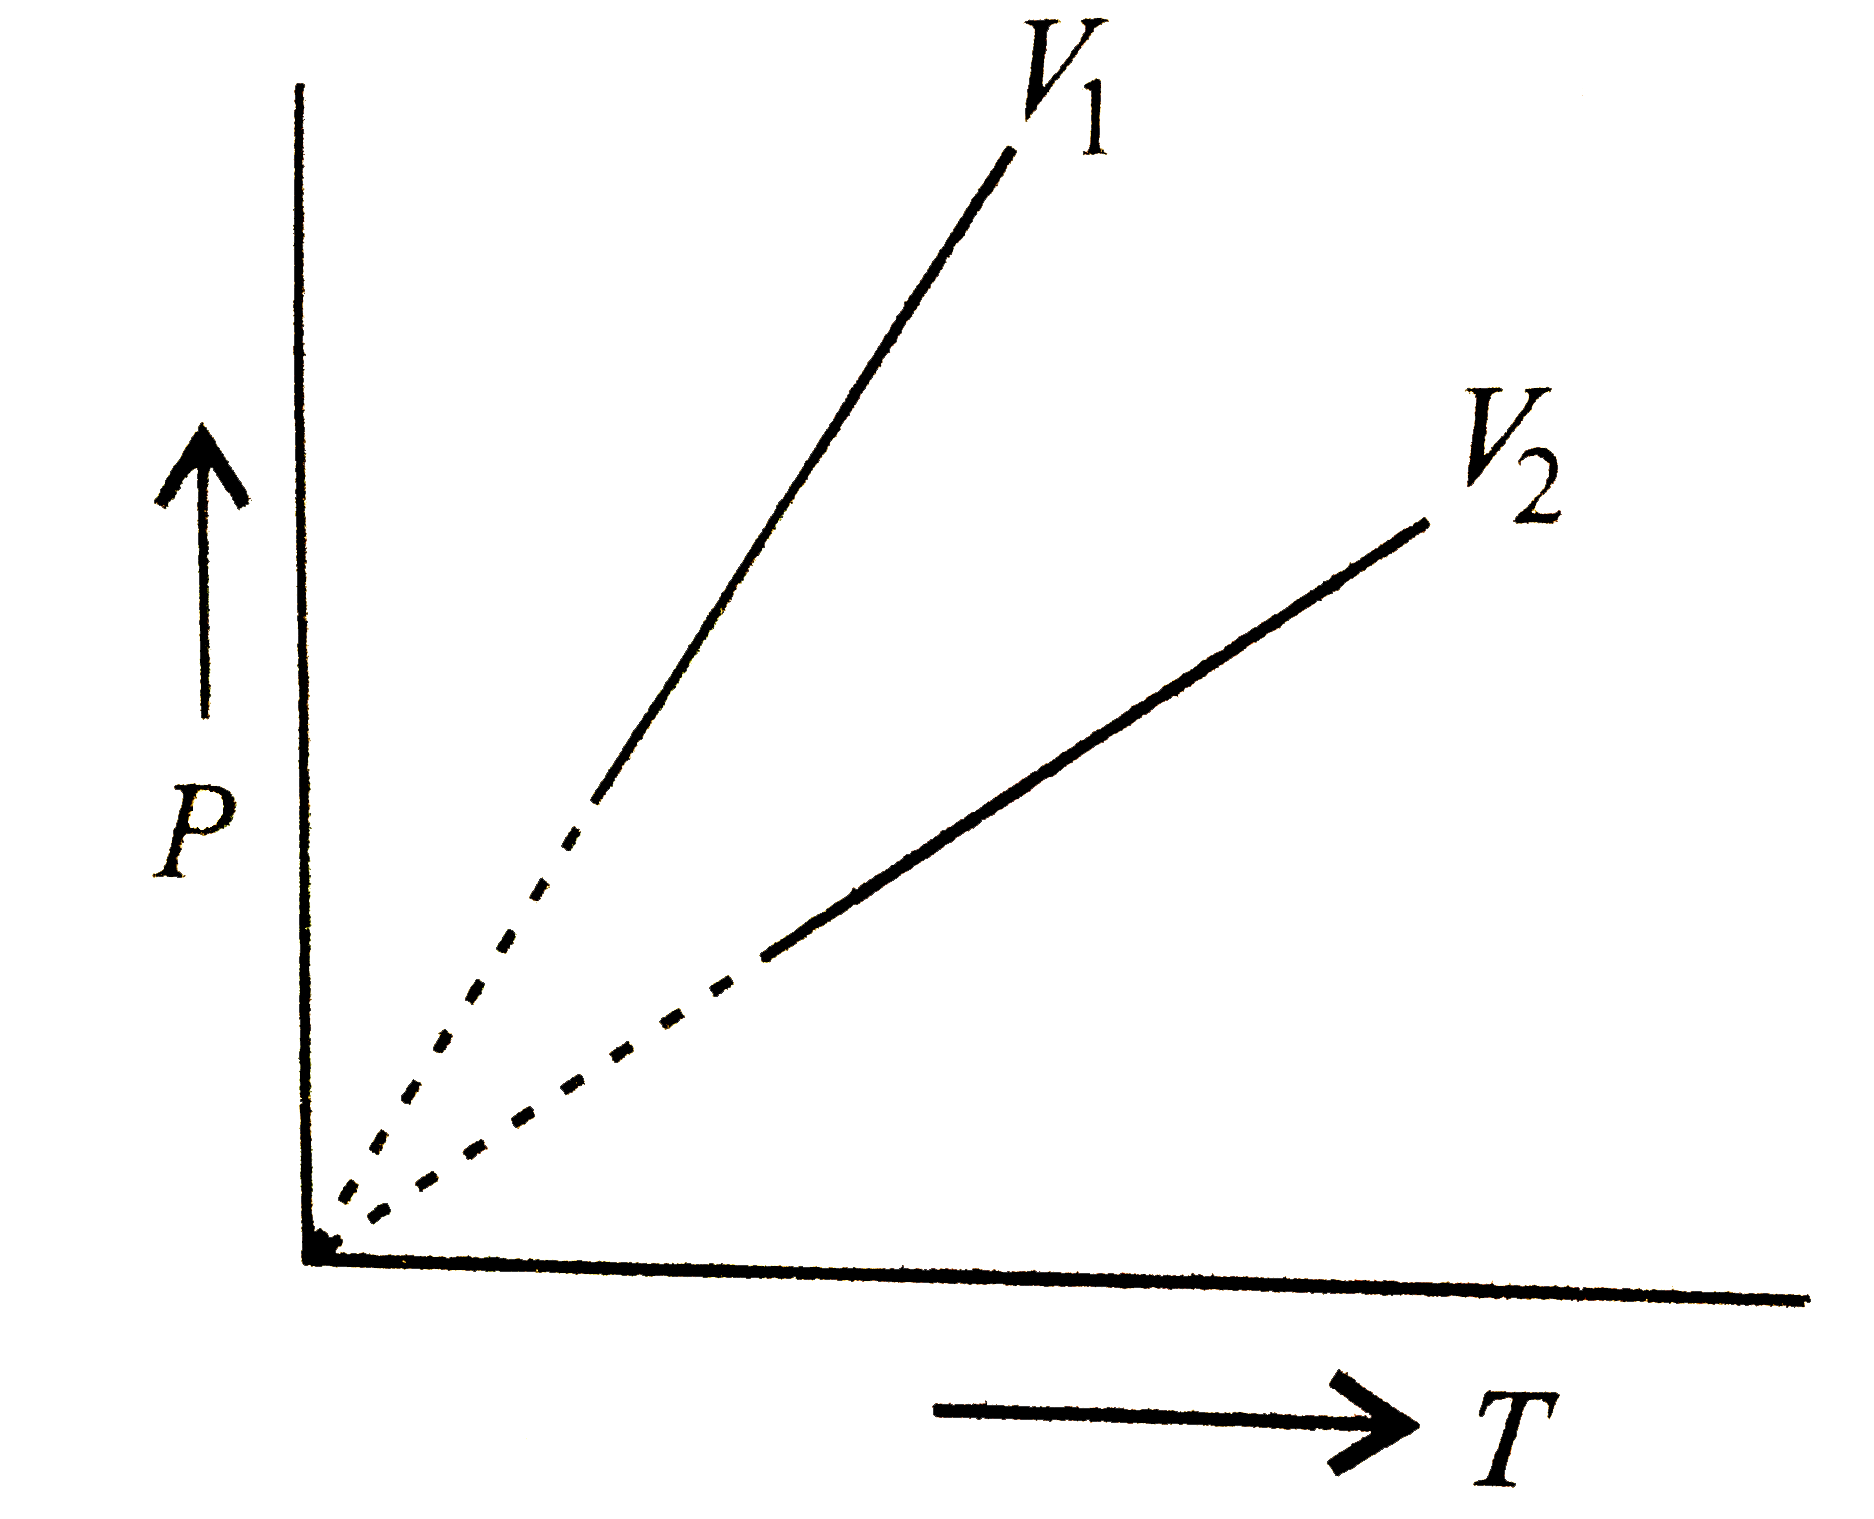
A plot of P vs T for a given mass of gas at constant volume is a straight line . P vs T at constant volumes V1 and V2 for an ideal gas are shown below :
Which of the following is correct ?
 View Solution
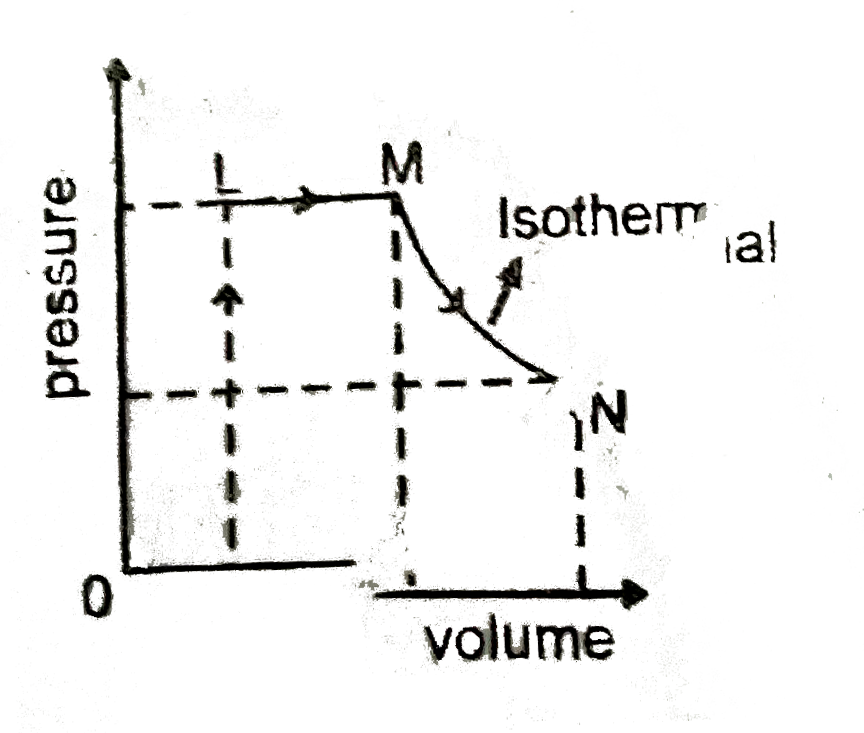
A fixed mass of an ideal gas undergoes changes of pressure and volume starting at L, as shown in Figure. Which of the the following is correct:
 View Solution
At a given volume and temperature the pressure of a gas
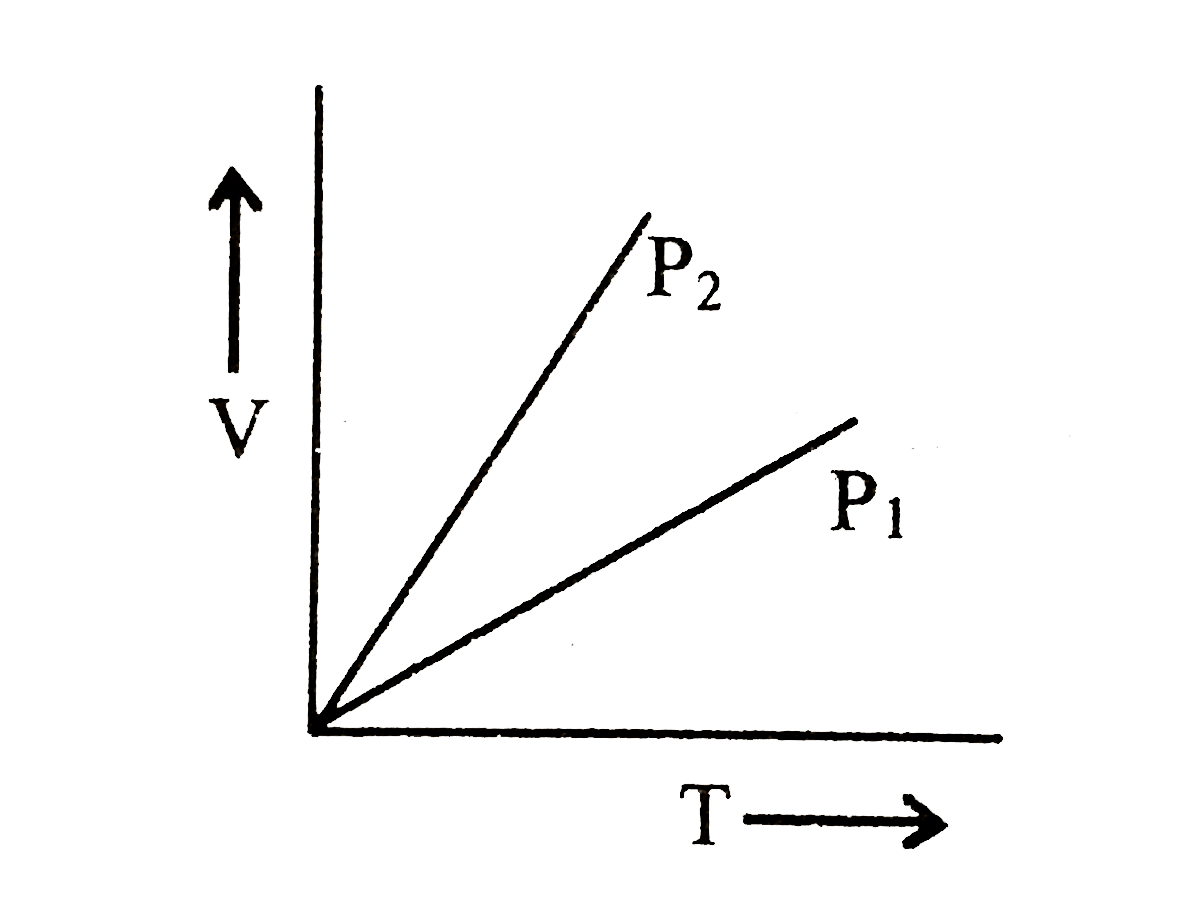
View SolutionFor V versus T curves at constant pressure P1andP2 for and ideal gas shown in figure-
 View Solution
Which of the following will give a linear plot at constant pressure ?
View SolutionIf the P-V diagram of a diatomic gas is plotted, it is a straight line passing through the origin. The molar heat capacity of the gas in the process is IR, where I is an integer. Find the value of I.
View SolutionAssertion: The plot of volume (V) versus pressure (P) at constant temperature is a hyperbola in the first quadrant.
Reason: V∝1/P at constant temperature.View SolutionVolume versus temperature graphs for a given mass of an ideal gas are shown in figure. At two different values of constant pressure. What can be inferred about relation between P1 and P2 ?
 View Solution

