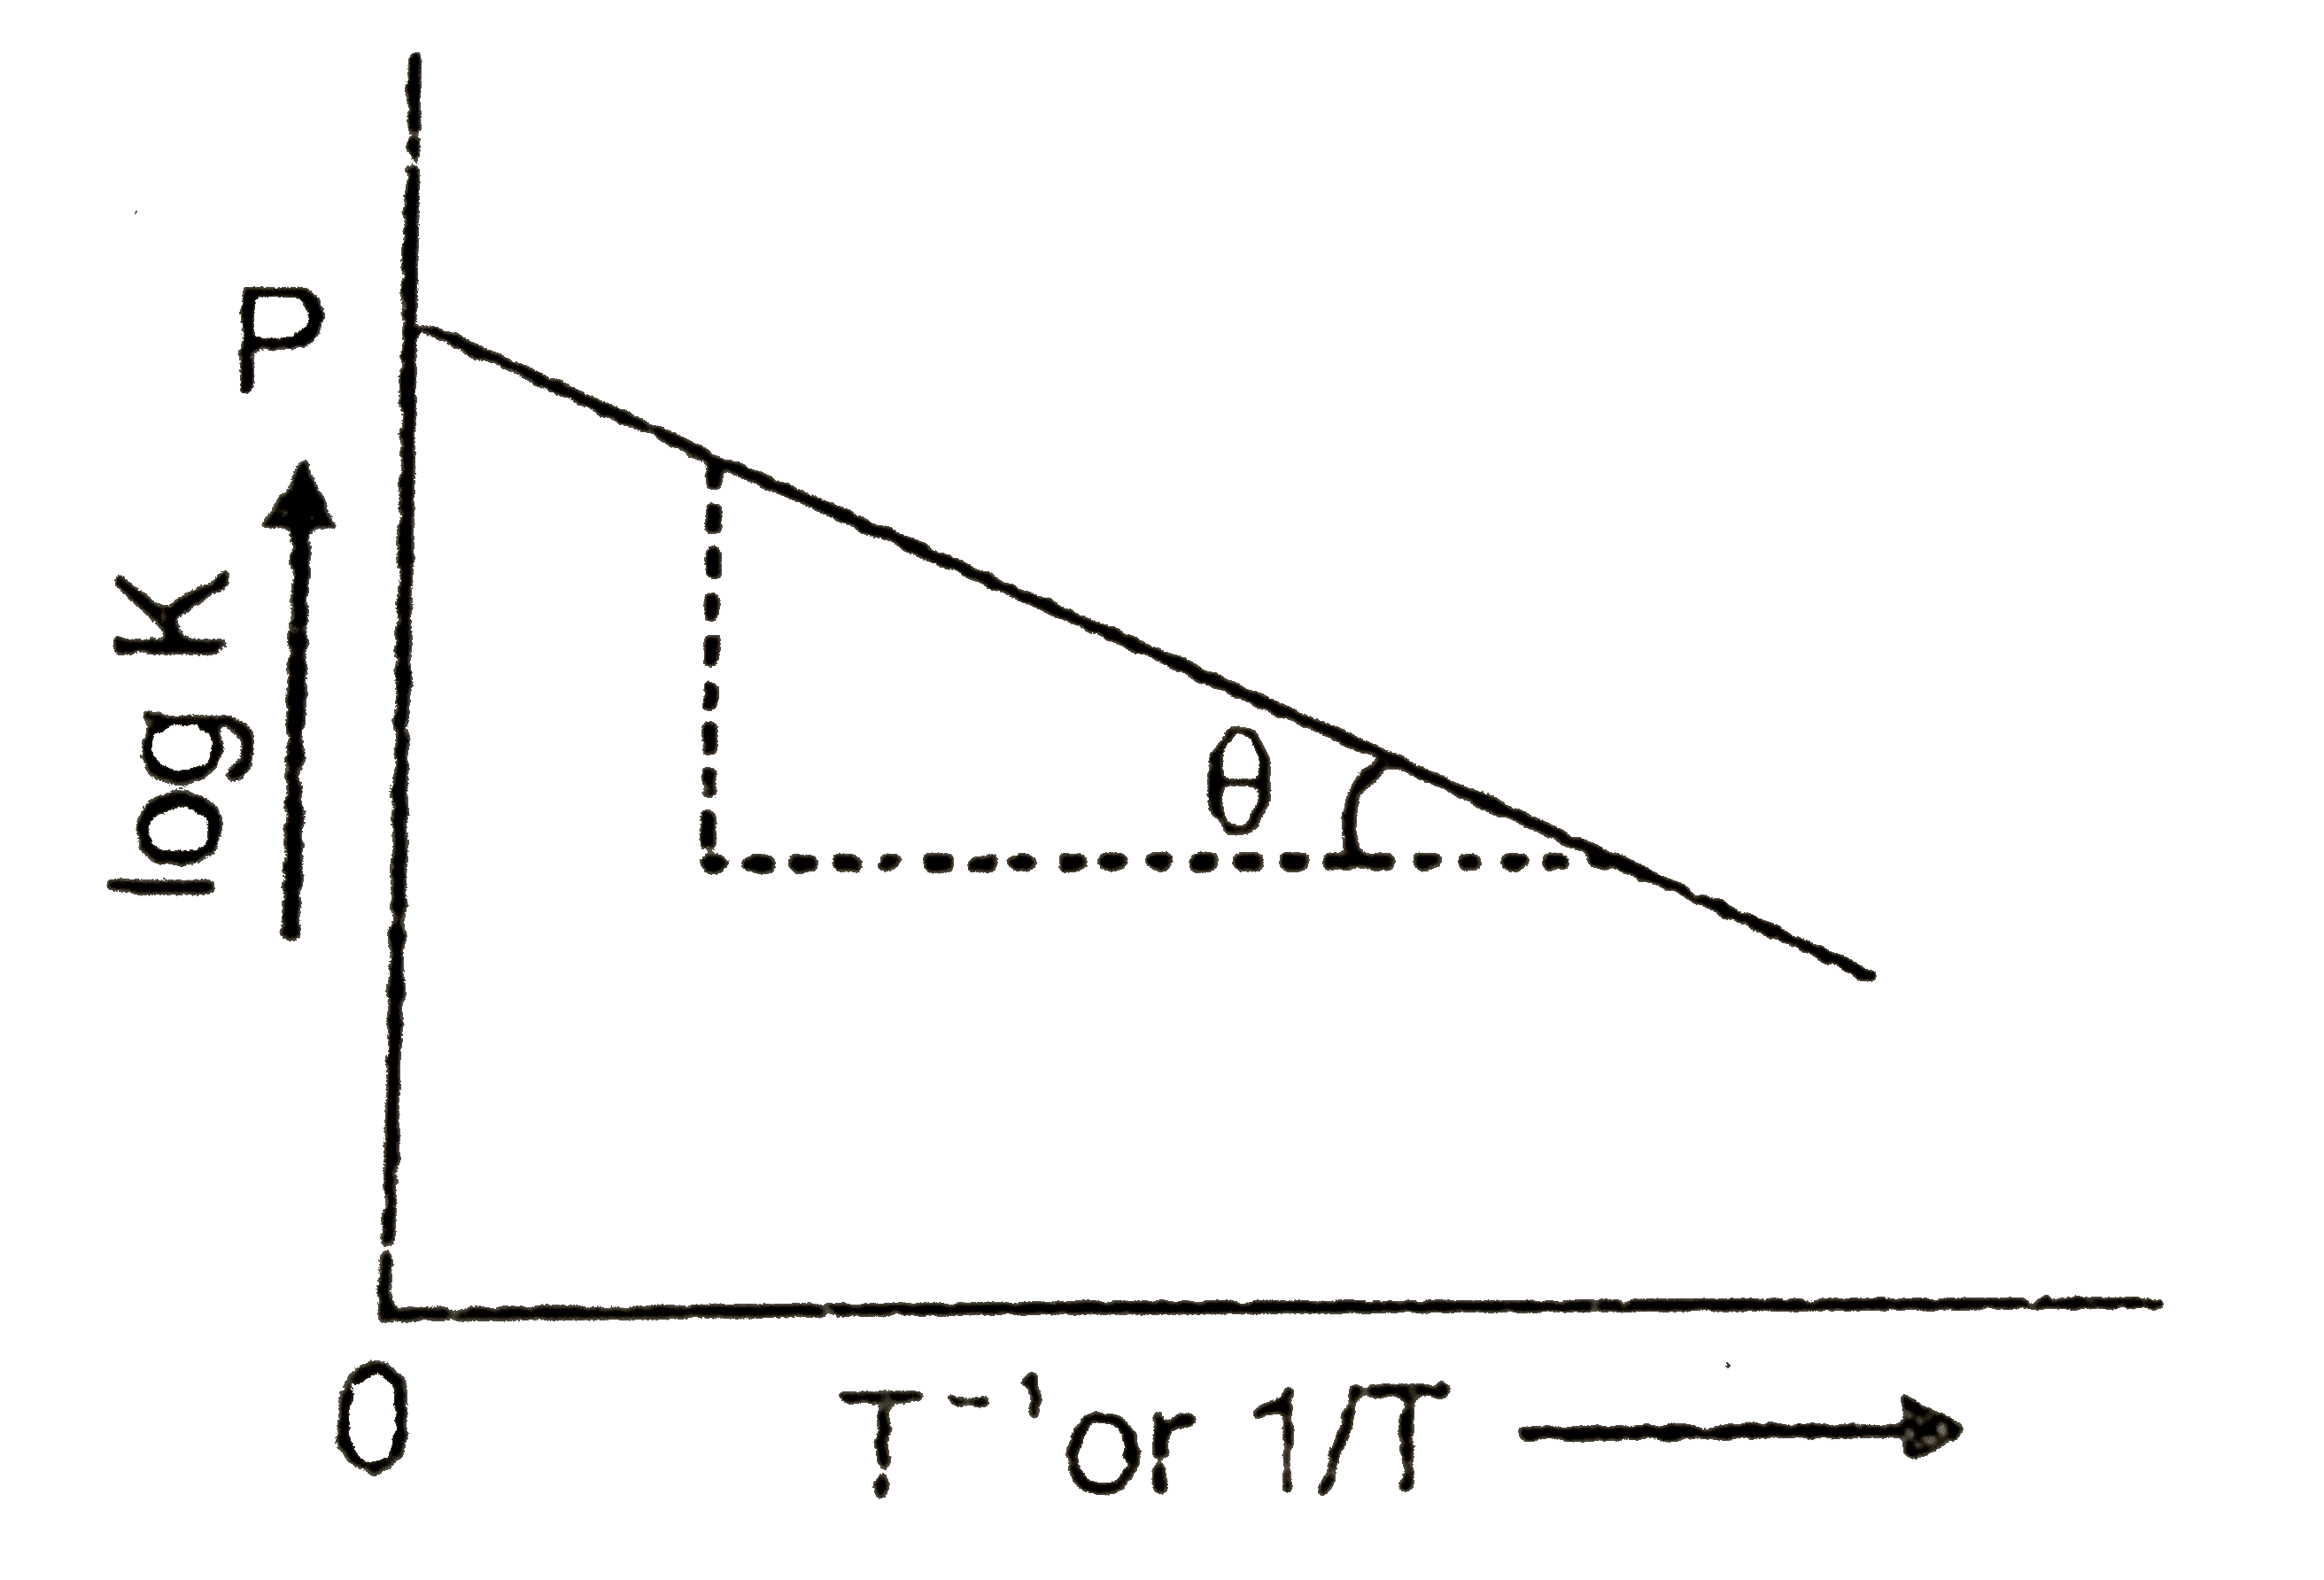
The graph between logk versus 1/T is a straight line.
The correct Answer is:T
Step by step video, text & image solution for The graph between log k versus 1//T is a straight line. by Chemistry experts to help you in doubts & scoring excellent marks in Class 12 exams.
Updated on:21/07/2023Topper's Solved these Questions
- CHEMICAL KINETICSBOOK - CENGAGE CHEMISTRYCHAPTER - CHEMICAL KINETICSEXERCISE - Archives Multiple Correct
5 Videos
- CHEMICAL KINETICSBOOK - CENGAGE CHEMISTRYCHAPTER - CHEMICAL KINETICSEXERCISE - Archives Single Correct
19 Videos
- CHEMICAL KINETICSBOOK - CENGAGE CHEMISTRYCHAPTER - CHEMICAL KINETICSEXERCISE - Exercises Fill In The Blanks
37 Videos
- CARBOXYLIC ACIDS AND THEIR DERIVATIVESBOOK - CENGAGE CHEMISTRYCHAPTER - CARBOXYLIC ACIDS AND THEIR DERIVATIVESEXERCISE - Exercises Archives (Analytical And Descriptive)
34 Videos
- COORDINATION COMPOUNDSBOOK - CENGAGE CHEMISTRYCHAPTER - COORDINATION COMPOUNDSEXERCISE - Archives Subjective
18 Videos
Similar Questions
Rate constant k of a reaction varies with temperature according to the equation
logk= constant−Ea2.303.1T
where Ea is the energy of activation for the reaction. When a graph is plotted for log k versus 1/T, a straight line with a slope -6670 K is obtained. Calculate the energy of activation for this reaction. State the units (R=8.314 JK−1mol−1)
View SolutionRate constant k of a reaction varies with temperature according to the equation
logk = constant −Ea2.303R(1T)
where Ea is the energy of activation for the reaction . When a graph is plotted for log k versus 1T , a straight line with a slope - 6670 K is obtained. Calculate the energy of activation for this reaction
View Solution
Knowledge Check
The graph between the log K versus 1T is a straight line. The slope of the line is
A−2.303REaB−Ea2.303RC2.303REaDEa2.303RWhen a graph between log K and 1/T is drawn a straight line is obtained. The point at which line cuts y-axis and x-axis respectively correspond to the temperature :
A0,En2.303RlogAB∞,Ea/(RlnA)C0,logADnone of theseFor a reaction having rate constant k at a temperature T, when a graph between ln k and 1/T is drawn a straight line is obtained. The point at which line cuts y -axis and x -axis respectively correspond to the temperature:
A0,Ea2.303RlogAB∞,EaR ln AC0,logADNone of these.
The rate constant 'k'. For a reaction varies with temperature 'T' according to the question. logk=logA−Ea2.303R(1T)
Where Ea is the activation energy. When a graph is plotted for logkvs1/T, a straight line with a slope of −4250 K is obtained. Calcualte Ea for this reaction.
View SolutionVariation of equiibrium constant K with temperature T is given by van 't Holf equation,
logK=logA−ΔH∘2.303RT
A graph between log K and T−1 was a straight line as shown in the figure and having θ=tan−1(0.5)andOP=10. Calculate:
(a) ΔH∘ (standard heat of reaction)when T=300K,
(b) A (pre-exponetial factor),
(c) Equilibrium constant K at 300K,
(d) Kat900KifΔH∘ is independent of temperature.

View SolutionMark the statement true (T) or false (F): A particle starts from rest under the action of a constant force. The graph of distance versus time is a straight line.
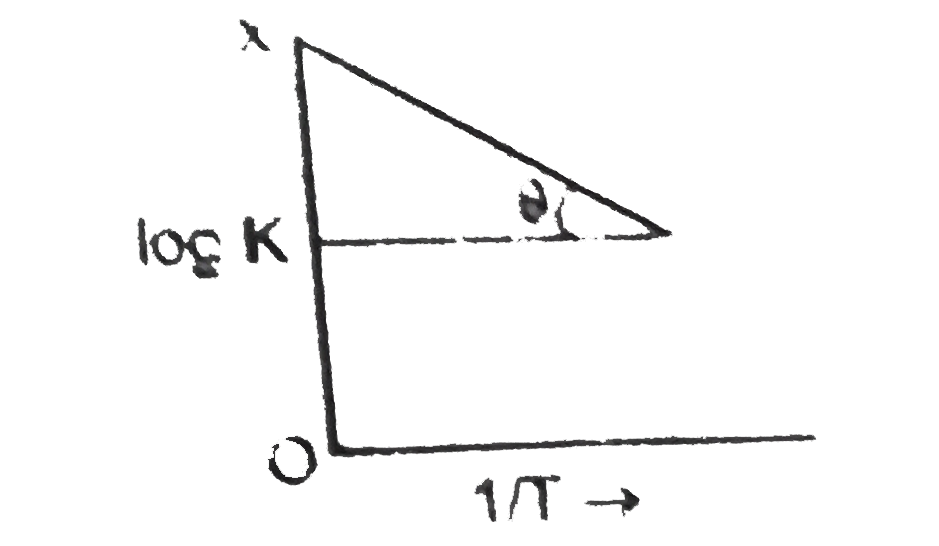
View SolutionThe graph between log k and 1/T[K is rate constant (sec−1) and T the temperature (K)] is a straight line with OX=5andθ=tan−1(−12.303).Calculate the value of Ea is cal. ?

View SolutionRate constant k of a reaction varies with temperature according to the equation, log k = constant -Ea2.303RT When a graph is plotted for logk versus 1/T a straight line with a slope -5632 is obtained. The energy of activation for this reaction is
View Solution