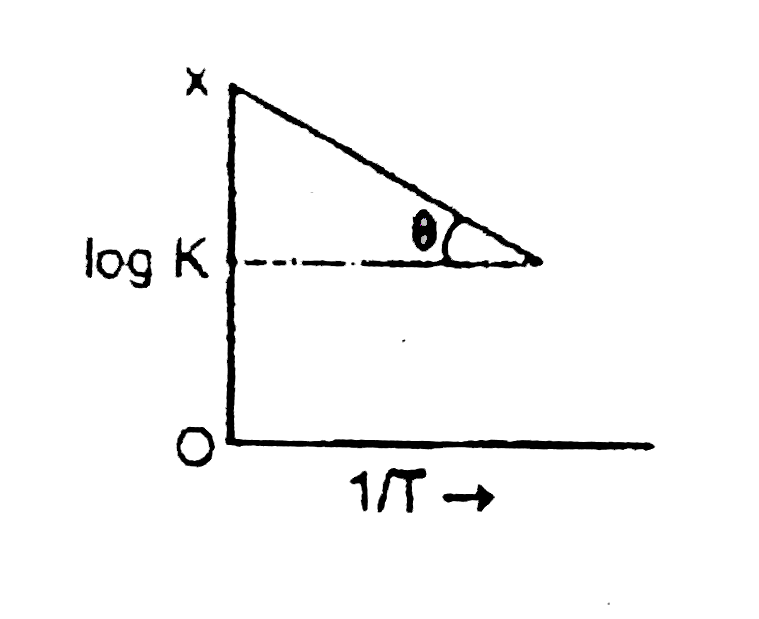
The graph between log k and 1/T[K is rate constant (sec−1) and T the temperature (K)] is a straight line with OX=5andθ=tan−1(−12.303).Calculate the value of Ea is cal. ?
![The graph between log k and 1/T[K is rate constant (sec^(-1)) and T the temperature (K)] is a straight line with OX=5 and theta=tan^(-1)(-1/2.303).Calculate the value of Ea is cal. ?](https://d10lpgp6xz60nq.cloudfront.net/physics_images/RES_PHY_RK_JA_C04_E01_216_Q01.png)
The correct Answer is:2
2.303logK=−EaRT+2.303logÅ
Thus, −Ea2.303R=tanθ=−12.303
∴Ea=R=2 cal.

Topper's Solved these Questions
Similar Questions
Knowledge Check
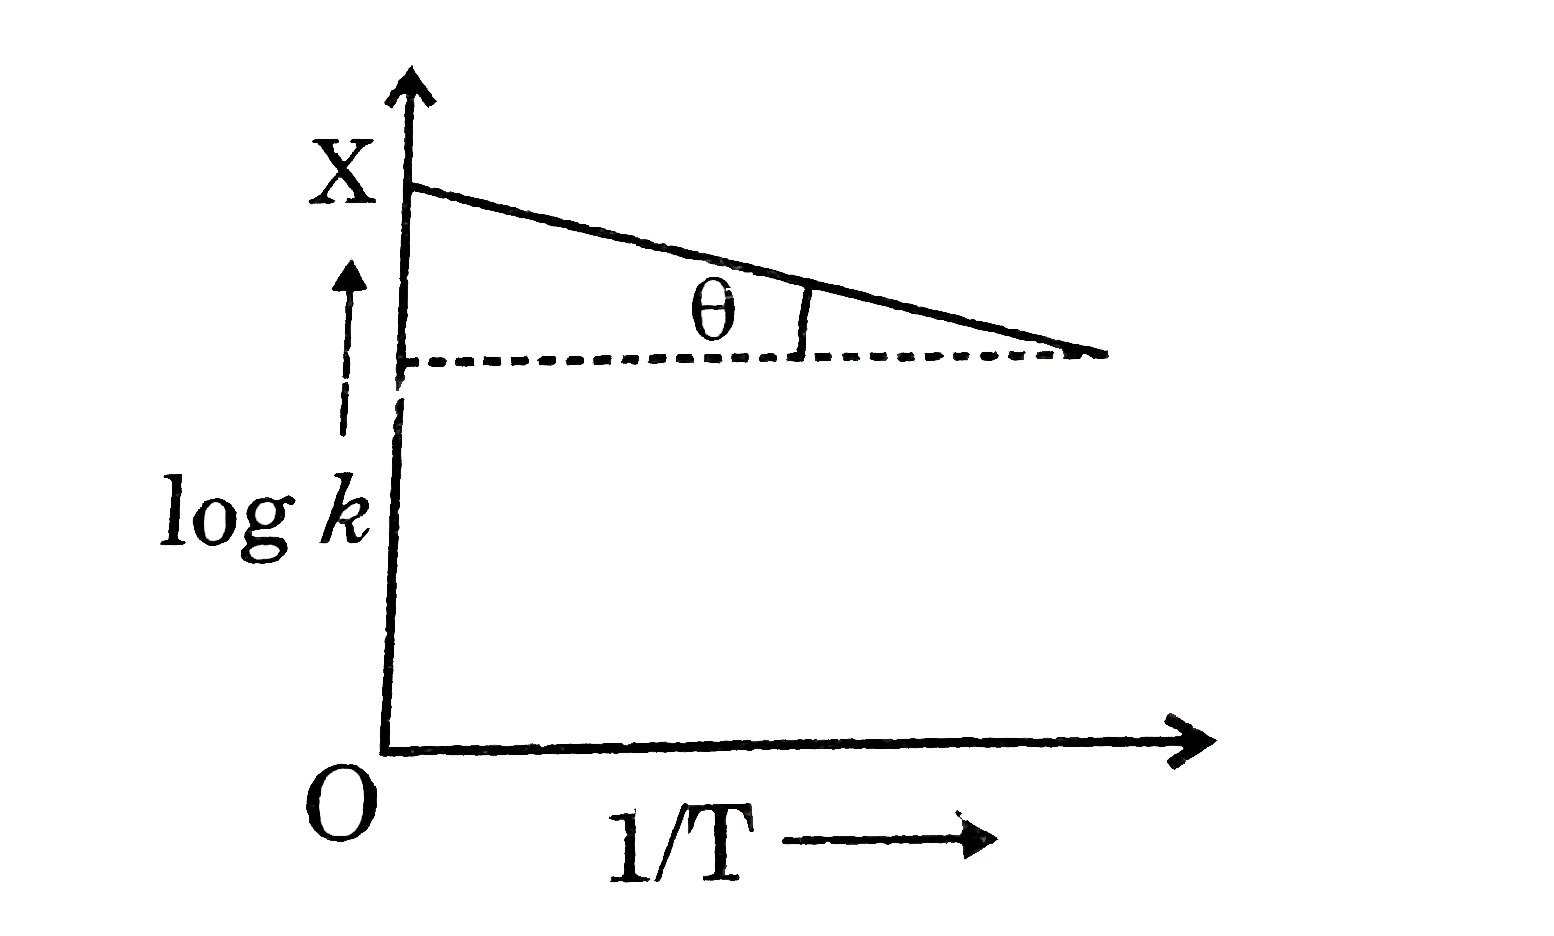
Graph between logk and 1/T [k rate constant (s−1) and T and the temperature (K)] is a straight line with OX=5,θ=tan−1(1/2.303). Hence −Ea will be
 A2.303×2calB2/2.303calC2calDNone
Graph between logk and 1/T [k rate constant (s−1) and T and the temperature (K)] is a straight line with OX=5,θ=tan−1(1/2.303). Hence −Ea will be
 A2.303×2 calB2/2.303 calC2 calDnone
Graph between log k and 1/T [where K is rate constant in s−1 and T is the temperature (in K) is a straight line with Hence, Ea will be
 A2.303×2 calB22.303calC2 calDNone of these
The graph between logk versus 1/T is a straight line.
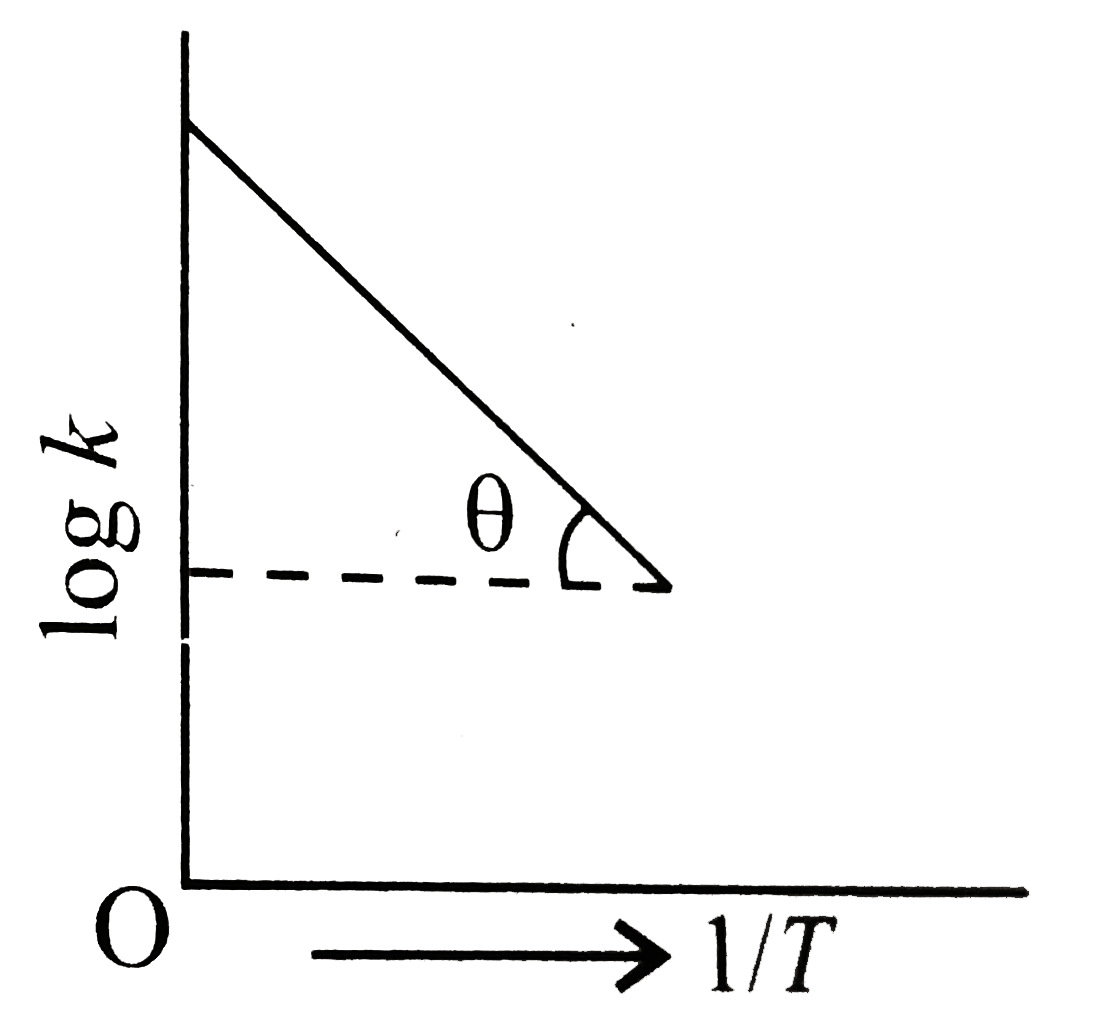
View SolutionGraph between log k and 1T (k is rate constant in s−1 and T is the temperature in K) is a straight line. As shown in figure if OX = 5 and slope of the line =−12.303then Ea is :

View SolutionVariation of equiibrium constant K with temperature T is given by van 't Holf equation,
logK=logA−ΔH∘2.303RT
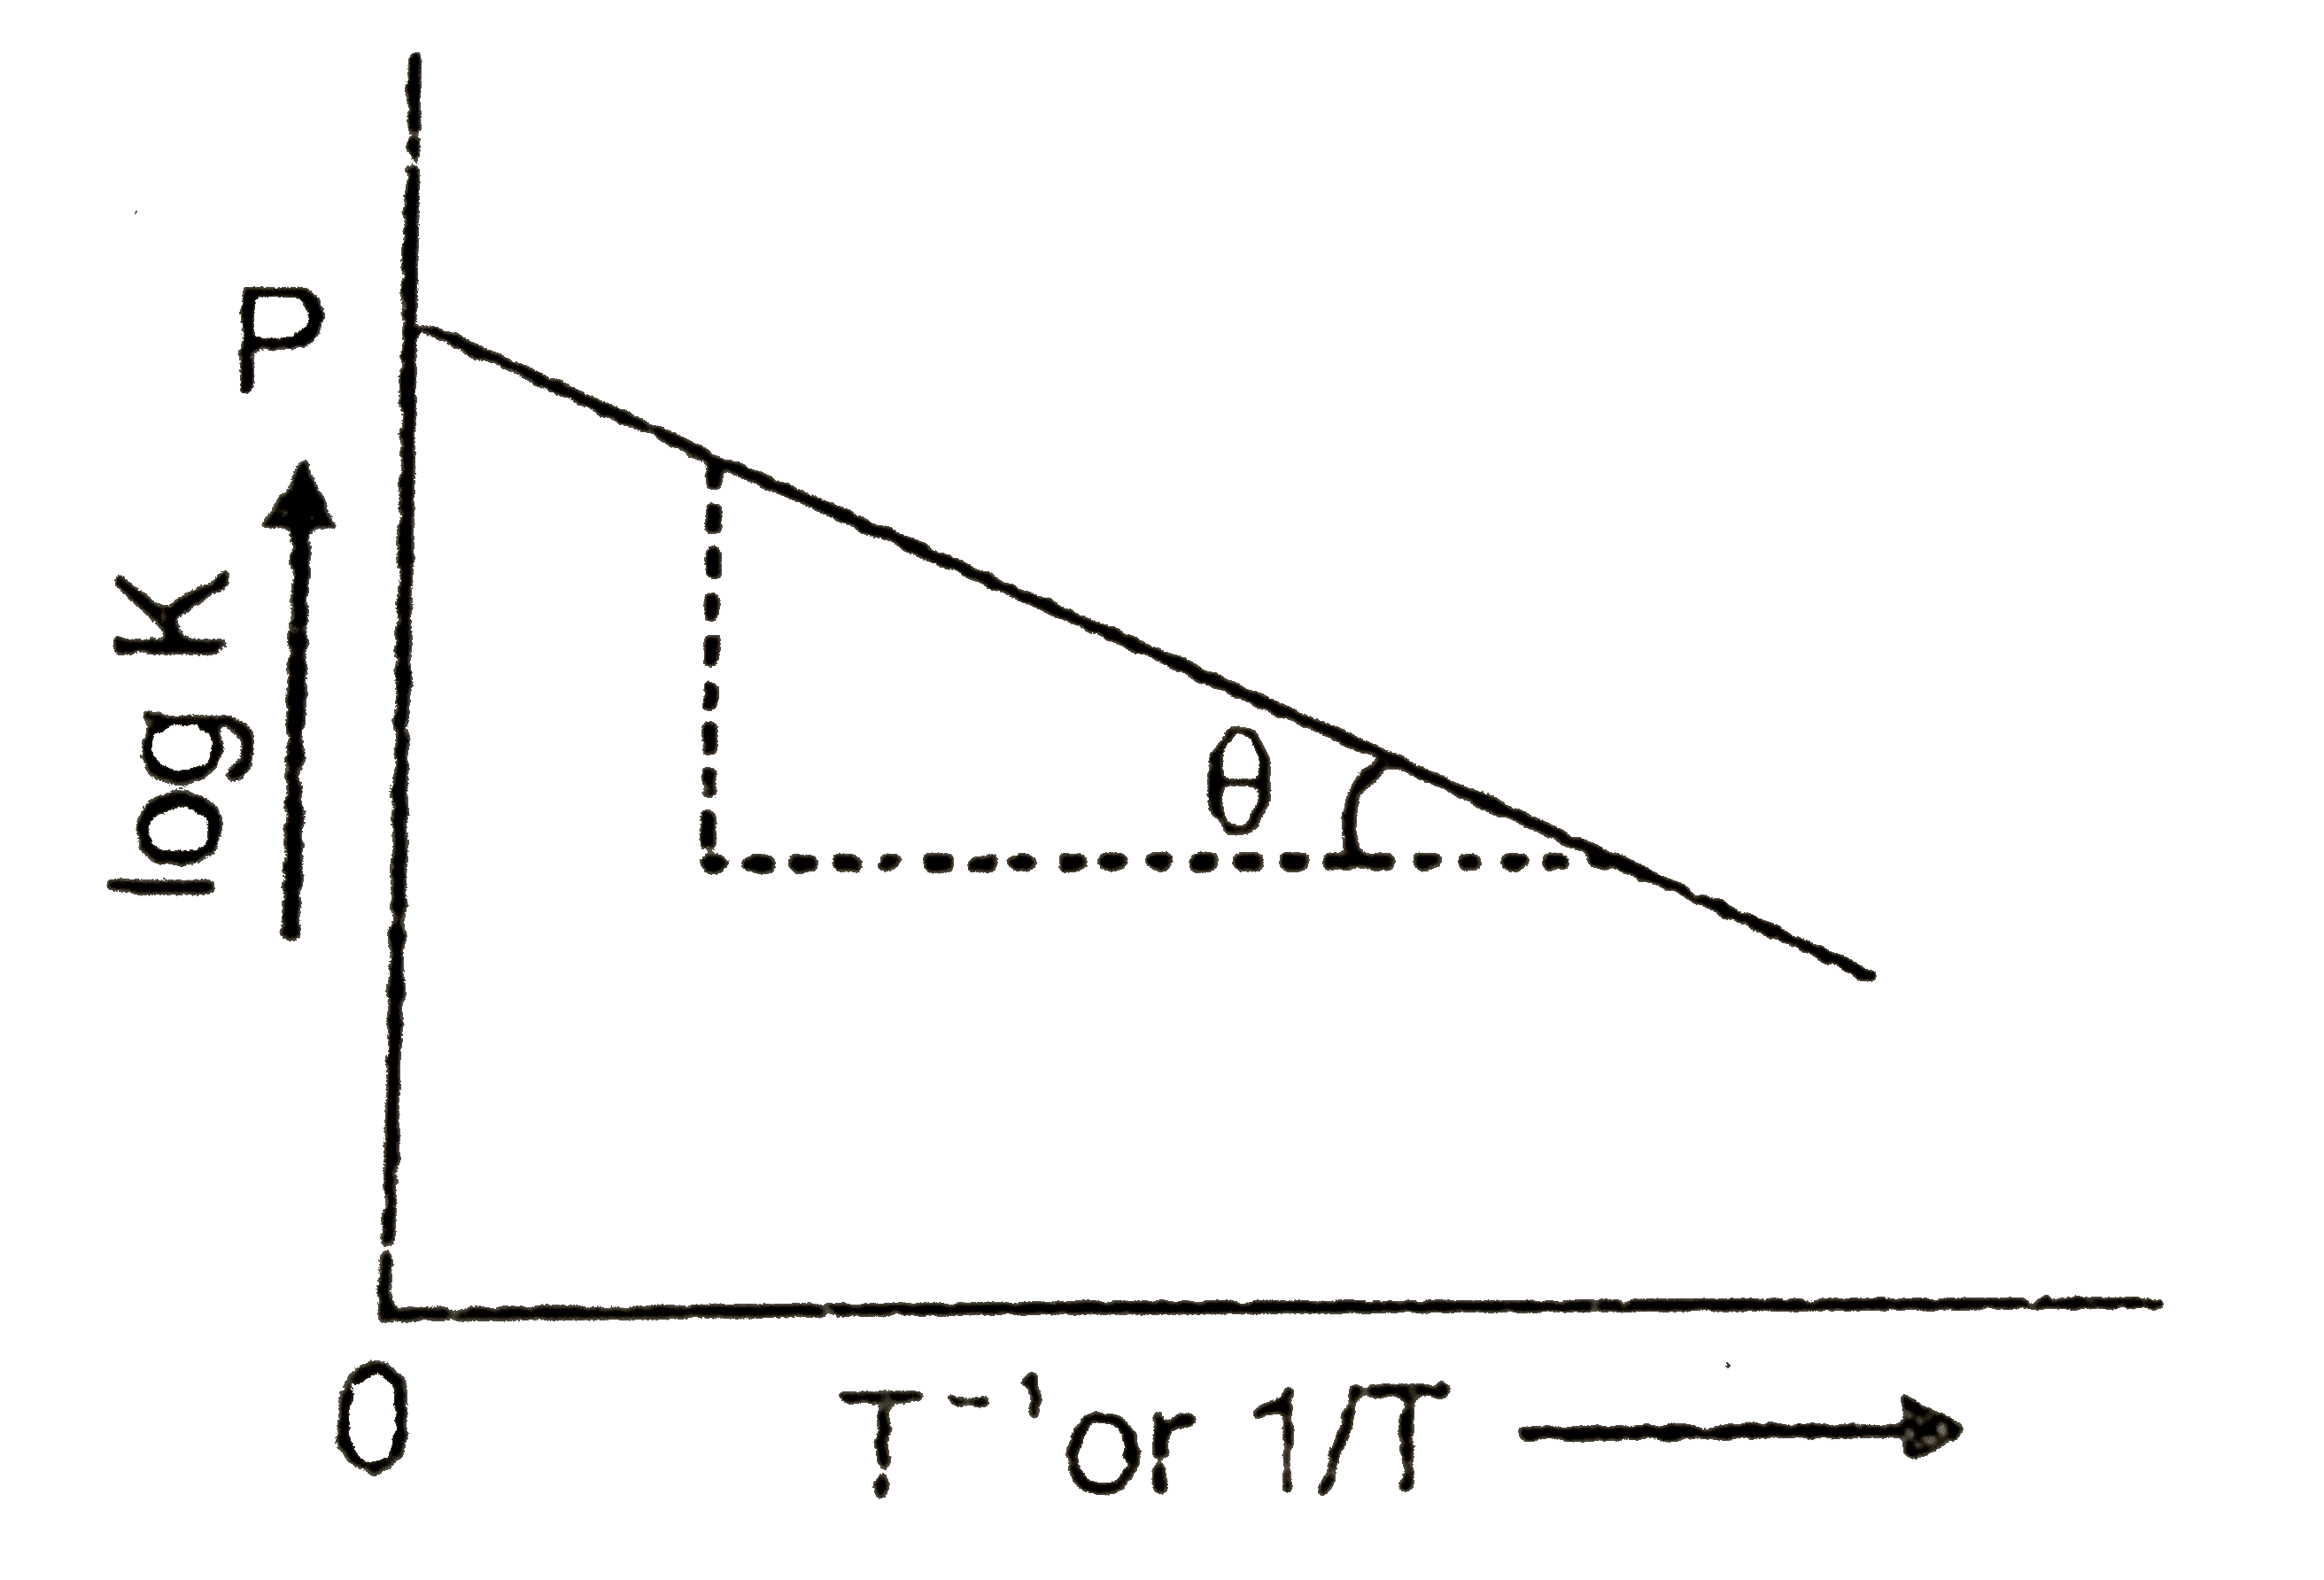
A graph between log K and T−1 was a straight line as shown in the figure and having θ=tan−1(0.5)andOP=10. Calculate:
(a) ΔH∘ (standard heat of reaction)when T=300K,
(b) A (pre-exponetial factor),
(c) Equilibrium constant K at 300K,
(d) Kat900KifΔH∘ is independent of temperature.

View SolutionGraph between log k and 1T (k is rate constant in s−1 and T is the temperature in K) is a straight line. As shown in figure if OX = 5 and slope of the line =−12.303then Ea is :

View SolutionThe graph between the log K versus 1T is a straight line. The slope of the line is
View Solution
