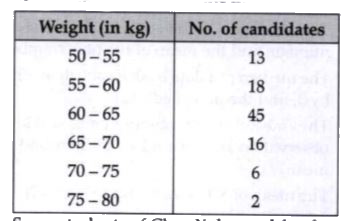
The following table shows the distribution of weights of seeds. Draw a frequency polygon.

Step by step video & image solution for The following table shows the distribution of weights of seeds. Draw a frequency polygon. by Maths experts to help you in doubts & scoring excellent marks in Class 10 exams.
Updated on:21/07/2023Topper's Solved these Questions
- CHALLENGING QUESTIONS BOOK - NAVNEET PUBLICATION - MAHARASHTRA BOARDCHAPTER - CHALLENGING QUESTIONS EXERCISE - EXAMPLE FOR PRACTICE
22 Videos
- BOARD'S QUESTION PAPER : MARCH 2019BOOK - NAVNEET PUBLICATION - MAHARASHTRA BOARDCHAPTER - BOARD'S QUESTION PAPER : MARCH 2019EXERCISE - QUESTION
30 Videos
- CHALLENGING QUESTIONSBOOK - NAVNEET PUBLICATION - MAHARASHTRA BOARDCHAPTER - CHALLENGING QUESTIONSEXERCISE - SECTION 3 (MODEL QUESTION PAPER FOR PRACTICE ) Solve any one of the following subquestions :
1 Videos
Similar Questions
The following table shows the distribution of weights of 100 candiates appearing for a competition . Determine the modal weight .

View SolutionThe following table gives the distribution of students of two sections according to the marks obtained by them. Represent the marks of the students of botht the sections on the same graph by two frequency polygon. From the two polygons compare the performance of the two sections.
View Solution
Knowledge Check
The following table gives the frequency distribution of number of peas per pea pod of 198 pods :

What is the median of this distribution ?A3B4C5D6
The following table shows frequency distribution of marks secured by 100 students in a particular examination. Find the mean of the marks.

View SolutionThe following table shows the frequency distribution of the time required for each worker to complete a work. From the table find the mean time required to complete the job for a worker.

View SolutionThe following table shows the weights of children and the number of children. Draw a frequency polygon showing the information.

View SolutionThe following is the distribution of weights (in kg) of 40 persons.

Construct a cumulative frequency distribution (of the less than type) table for the data above.
View SolutionThe following table shows frequency distribution of the number of saplings planted by the students of a school :

Find the modal number of saplings planted.
View SolutionThe following table shows frequency distribution of marks of 100 students of 10th class which they obtianed in a practice examination. Find the median of the marks.

View SolutionThe following table shows the classification of percentages of marks of students and the number of students. Draw a frequency polygon from the table.

View Solution
