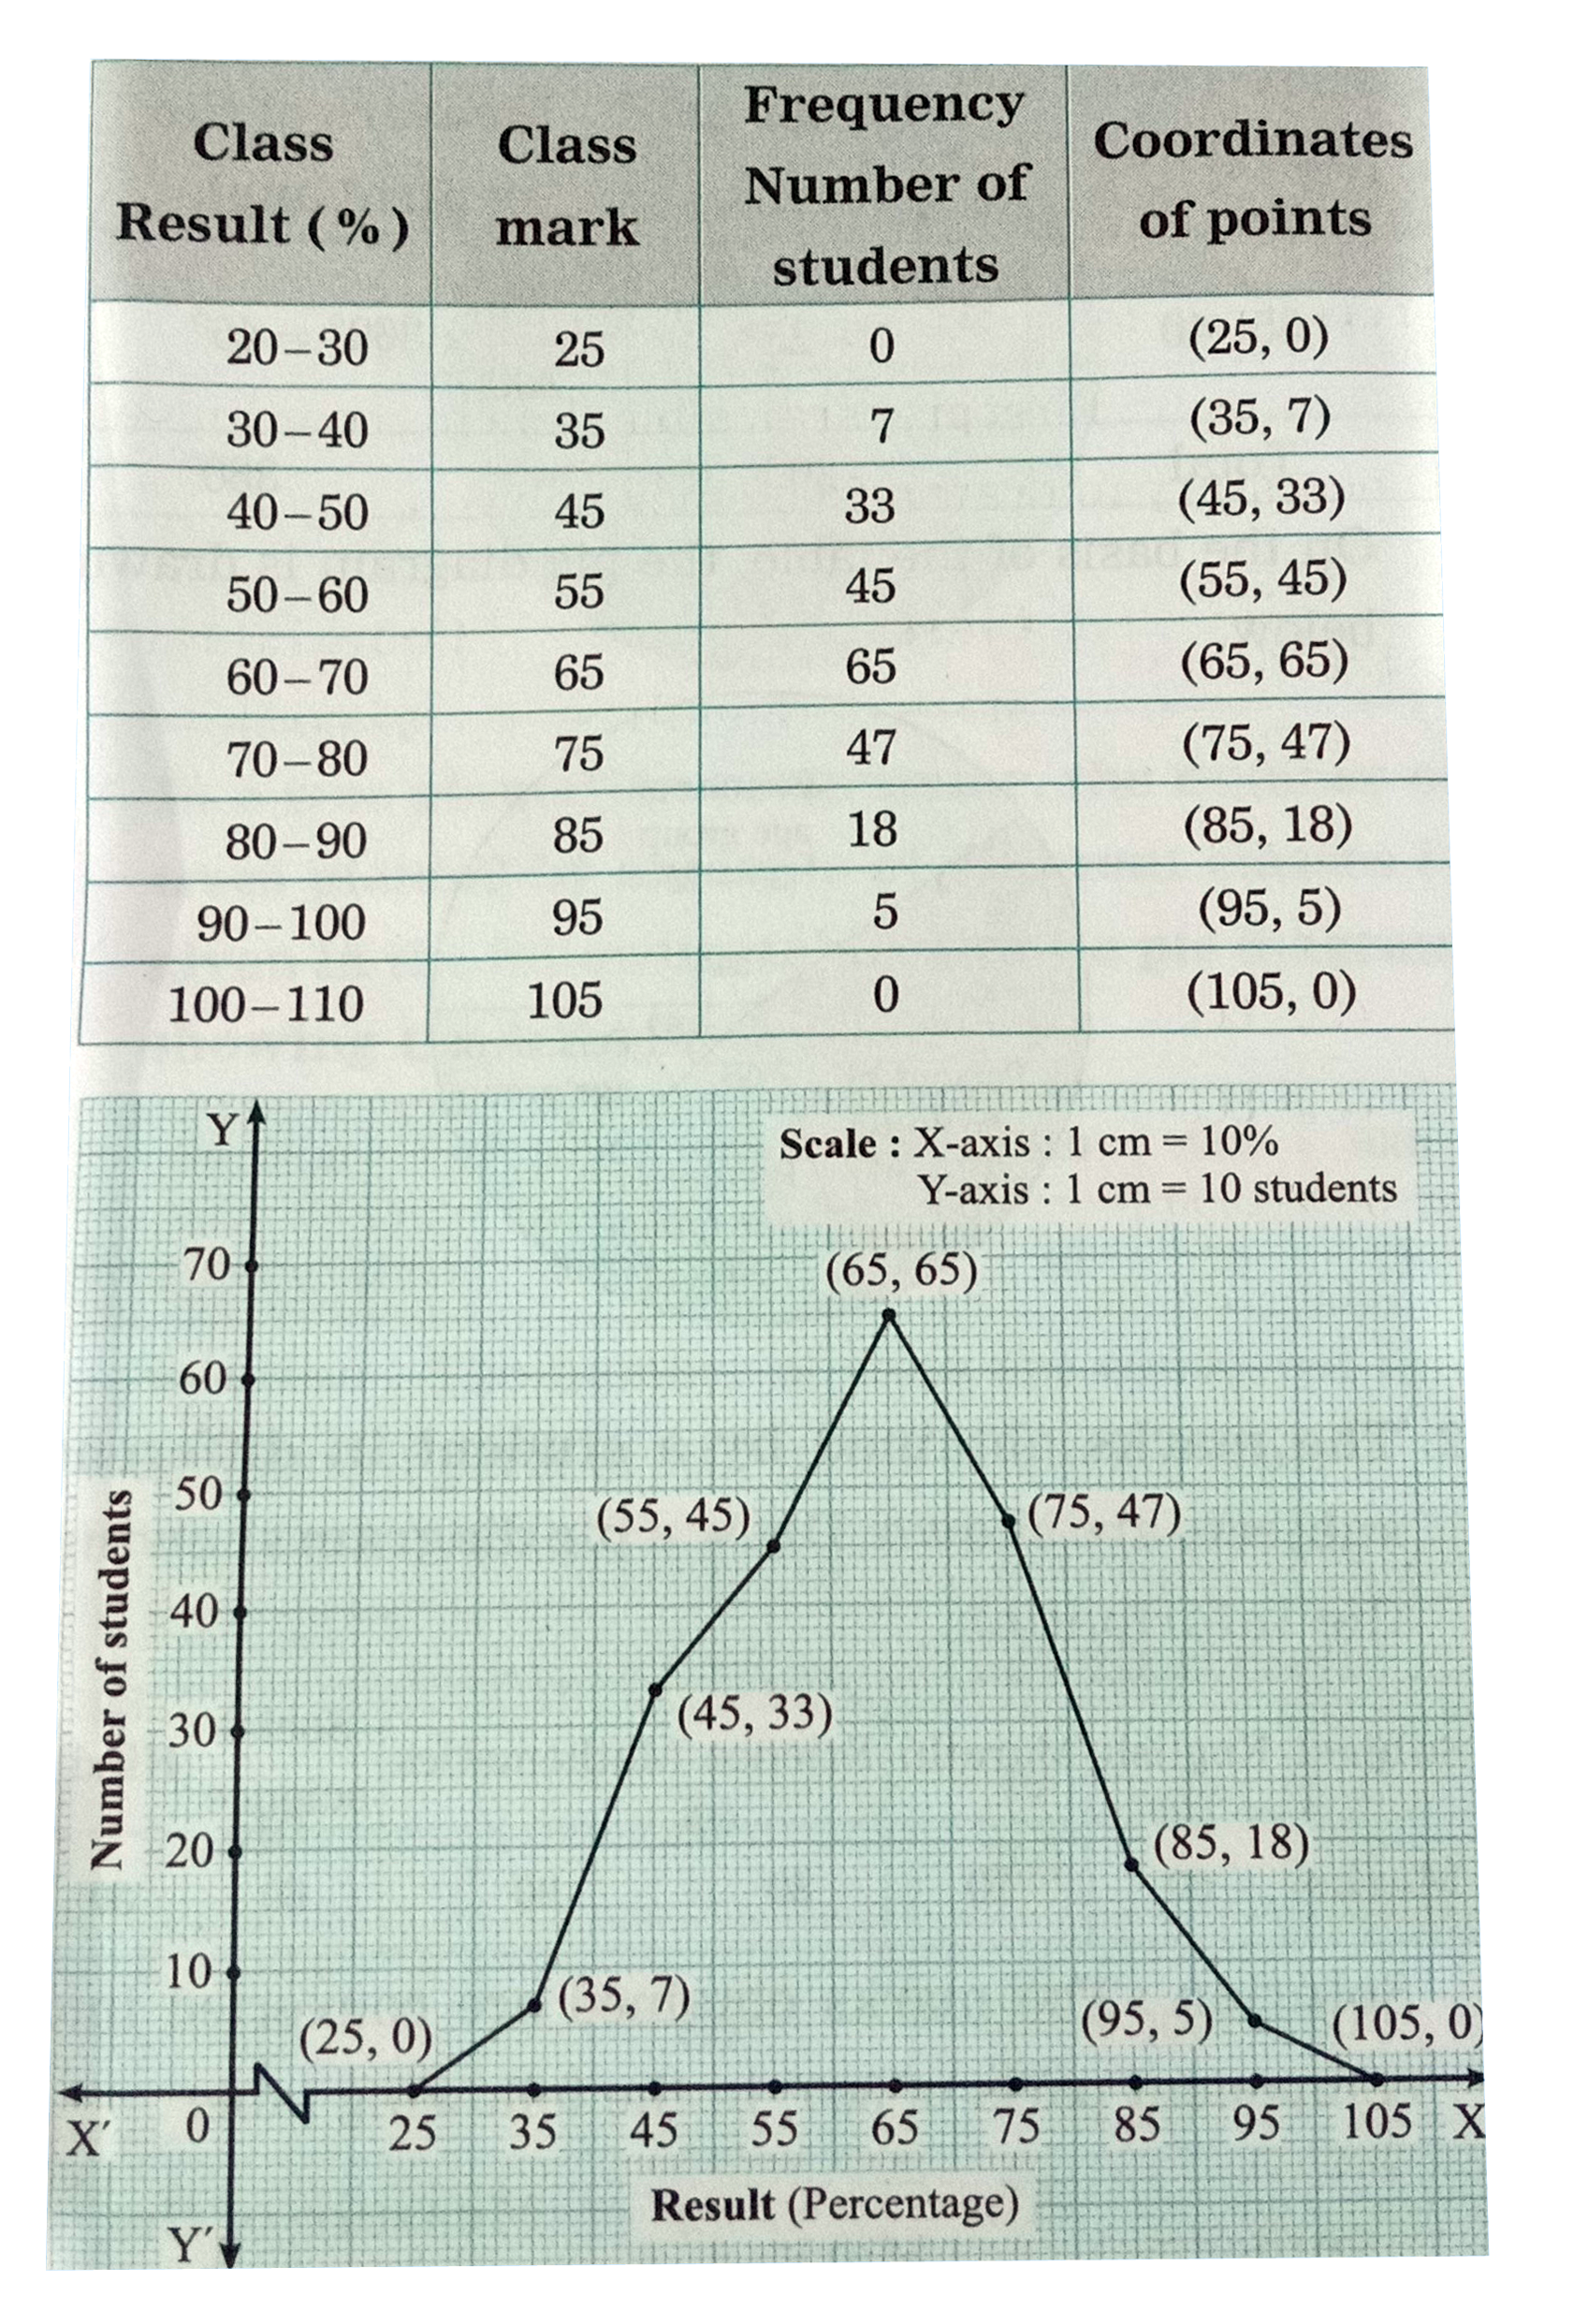
The following table shows the classification of percentages of marks of students and the number of students. Draw a frequency polygon from the table.

First prepare a table showing coordinates necessary to draw a frequency polygon.
Topper's Solved these Questions
- BOOK - NAVNEET PUBLICATION - MAHARASHTRA BOARDCHAPTER - STATISTICSEXERCISE - PRACTICE SET 6.66videos
STATISTICS
- BOOK - NAVNEET PUBLICATION - MAHARASHTRA BOARDCHAPTER - STATISTICSEXERCISE - Challenging Questions2videos
STATISTICS
- BOOK - NAVNEET PUBLICATION - MAHARASHTRA BOARDCHAPTER - STATISTICSEXERCISE - PRACTICE SET 6.44videos
STATISTICS
- BOOK - NAVNEET PUBLICATION - MAHARASHTRA BOARDCHAPTER - SIMILARITYEXERCISE - SUBJECTIVE TYPE20videos
SIMILARITY
- BOOK - NAVNEET PUBLICATION - MAHARASHTRA BOARDCHAPTER - THEOREMS EXERCISE - CIRCLE15videos
THEOREMS
Similar Questions
The following table shows the classification of percentages of marks of students and the number of students.Draw a frequency polygen from the table.
 View Solution
The following table shows the weights of children and the number of children. Draw a frequency polygon showing the information.
 View Solution
Knowledge Check
- Question 1 - Select One
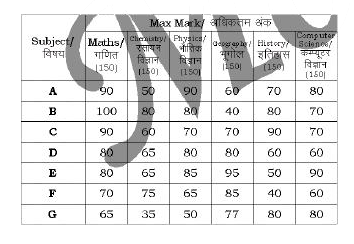
Table shows the percentage of marks obtained by seven students in six different subjects in an examination. The numbers in the brackets are the examination . The number in each subjects are the maximum marks in each subject
what are the average marks obtained by all the seven students in Physics ?A80.15B75.9C89.14D85.12 - Question 2 - Select One
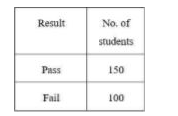
The following table shows the results of the students who have attended an examination . What percentage of students passed
 A0.3B0.4C0.6D0.5
The following table shows the distribution of weights of seeds. Draw a frequency polygon.
 View Solution
The following table show tha cumulative frequency distribution of marks of 800 students in an examination.
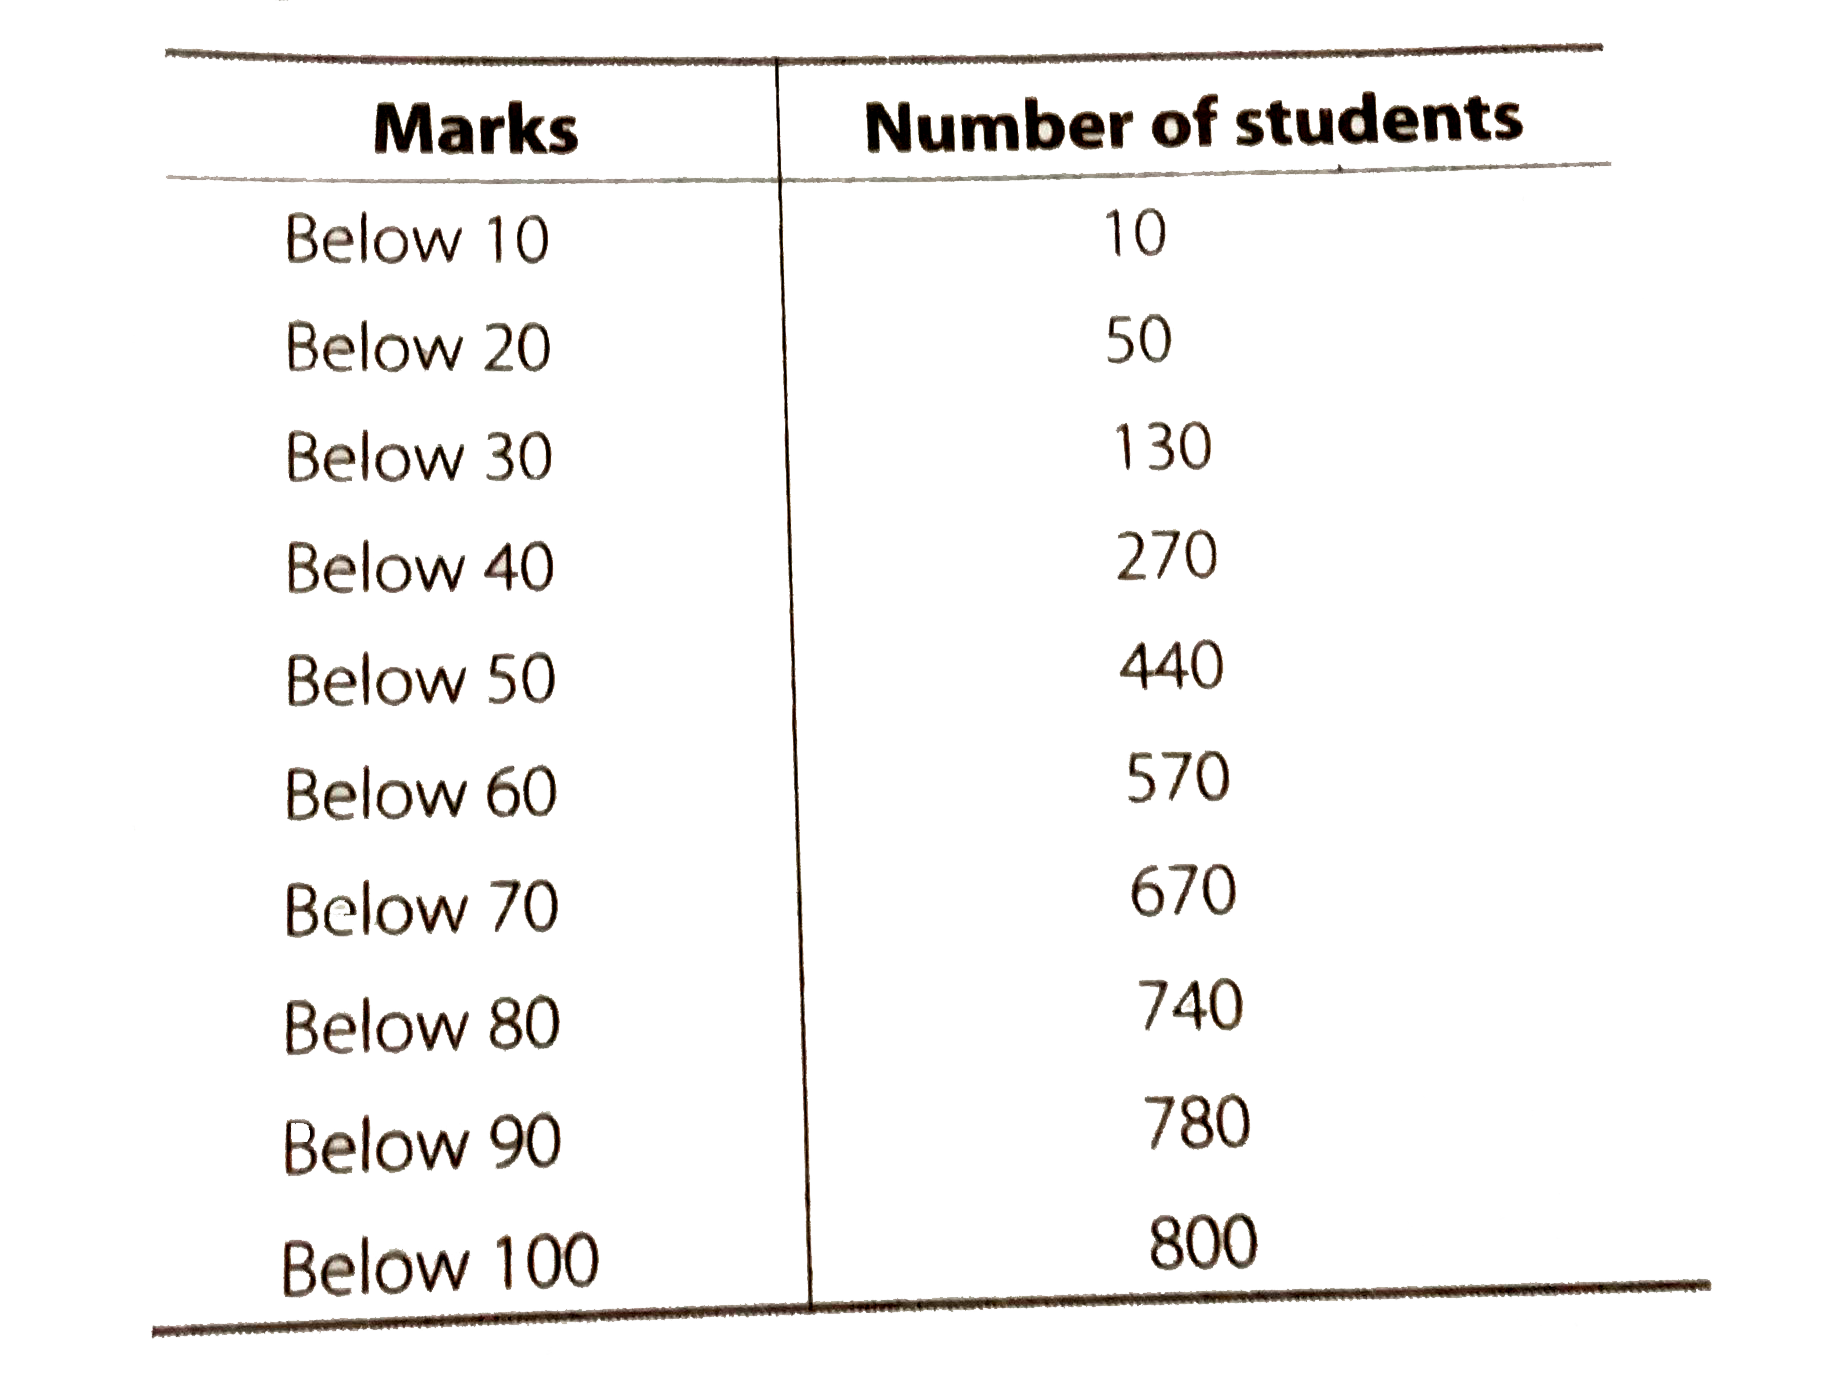
Construct a frequency distribution table for the data above.View SolutionThe following table represent marks obtained by 100 students in a test.

Find mean marks of the students.View SolutionFollowing table shows number of students of a college corresponding to different range of marks in Statistics.Make a frequency polygon.
 View Solution
The following table represents the percentage marks of four students in six subjects. Consider the table and answer questions based on it.
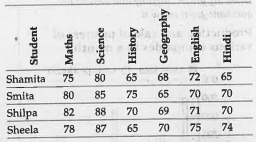
The average marks obtained by the students in Geography and History areView SolutionThe following table represents the percentage marks of four students in six subjects. Consider the table and answer questions based on it.
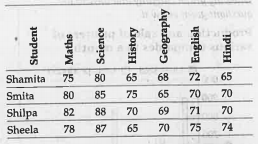
Who has the highest total marksView Solution

