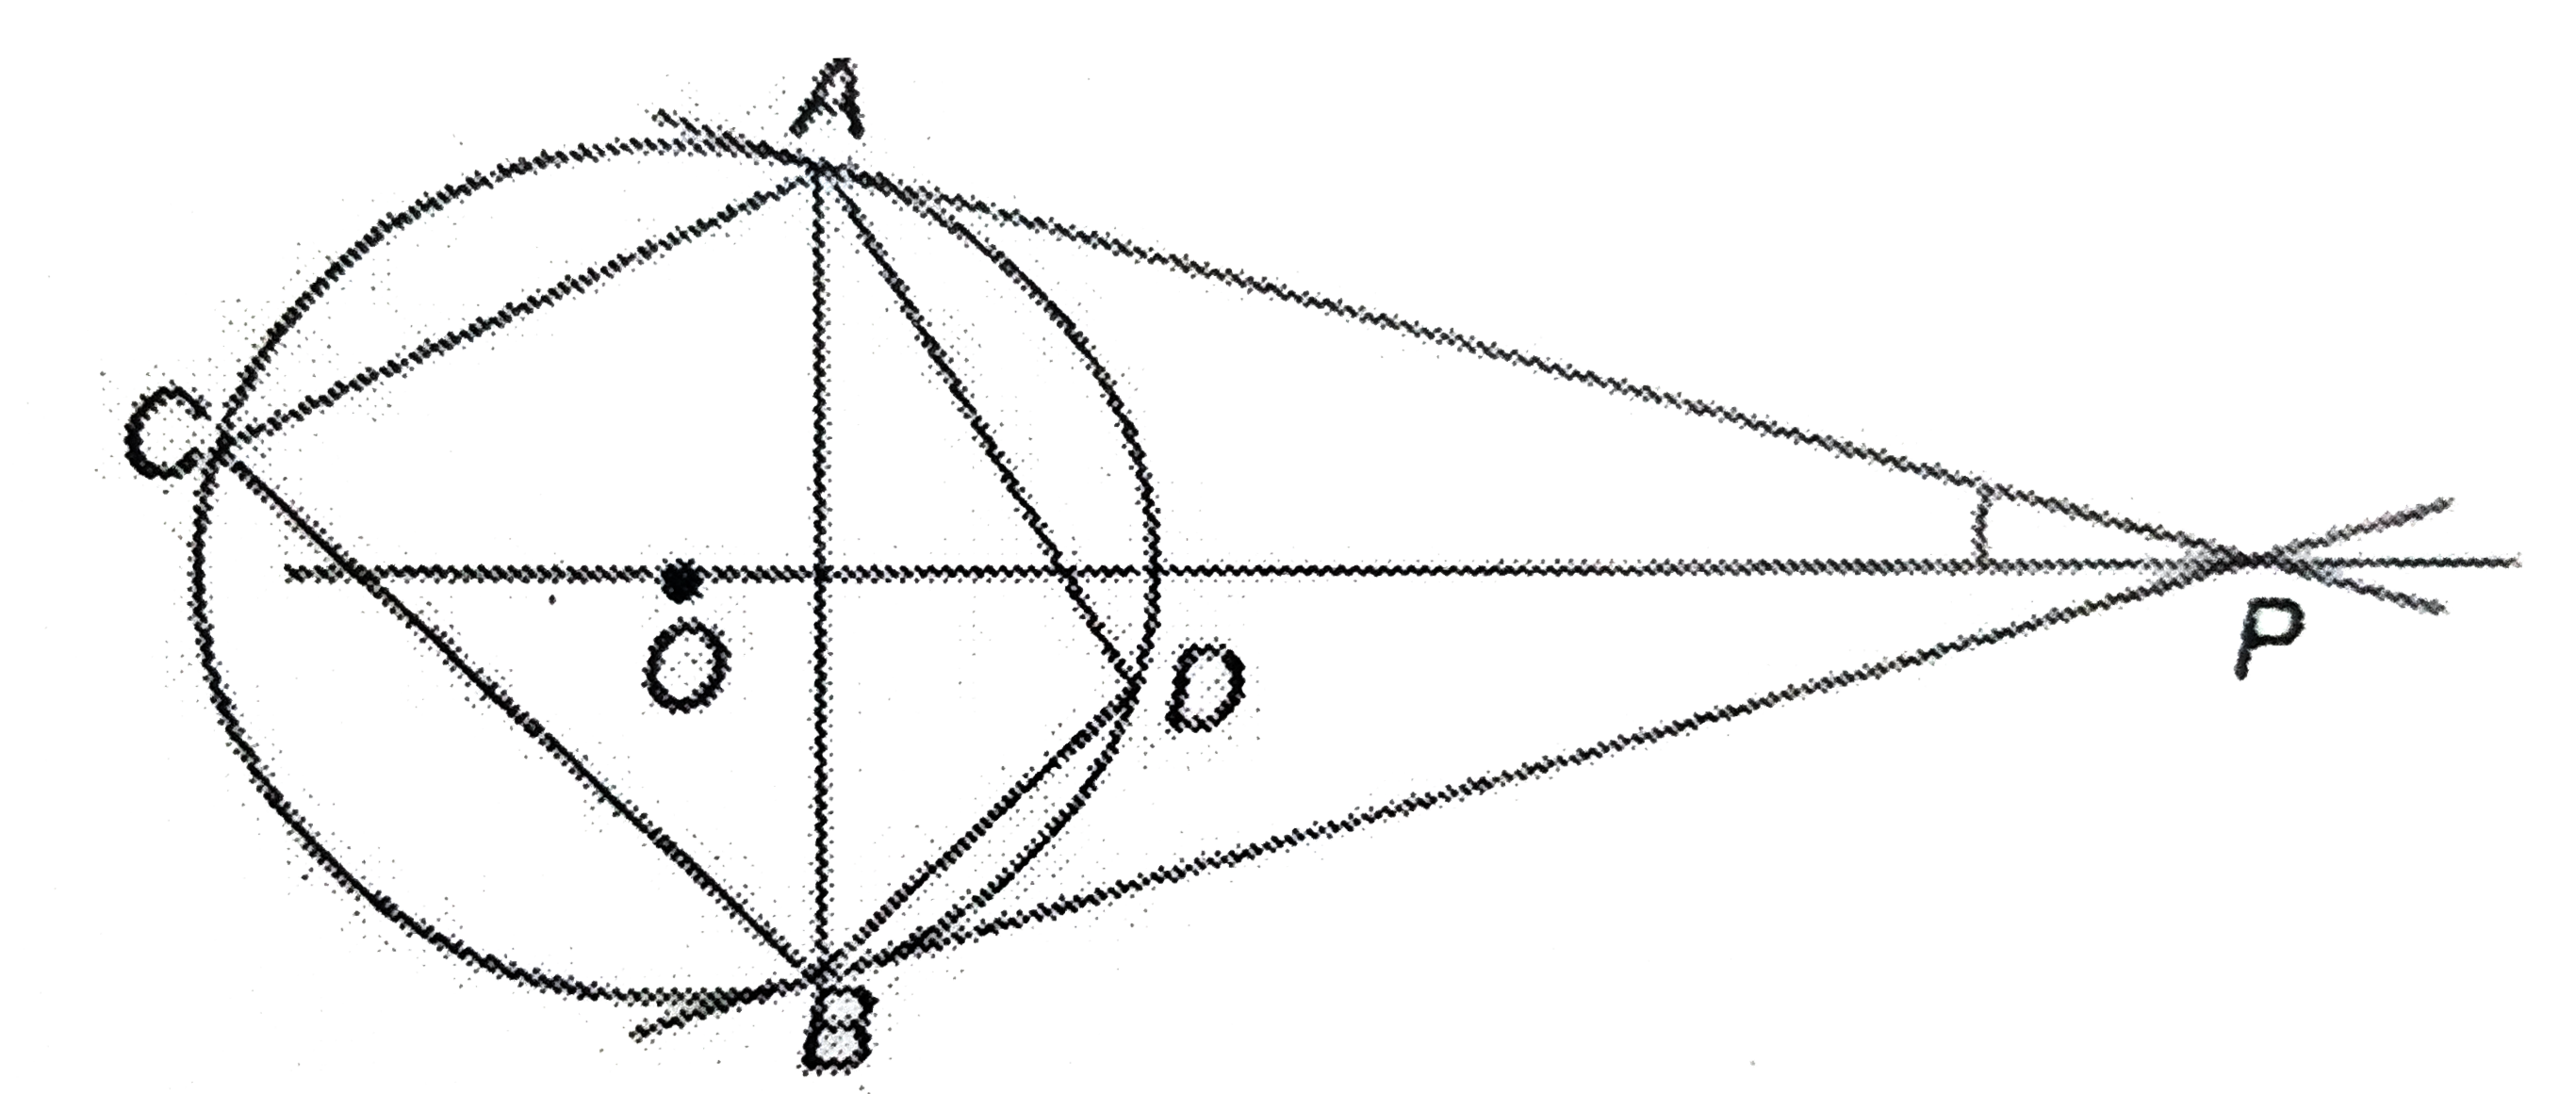
चित्र में, O वृत्त का केन्द्र है तथा ∠ACB व ∠ADB समान वृत्तखण्ड के कोण हैं तब ∠ADB व ∠ACB में सम्बन्ध ज्ञात कीजिए
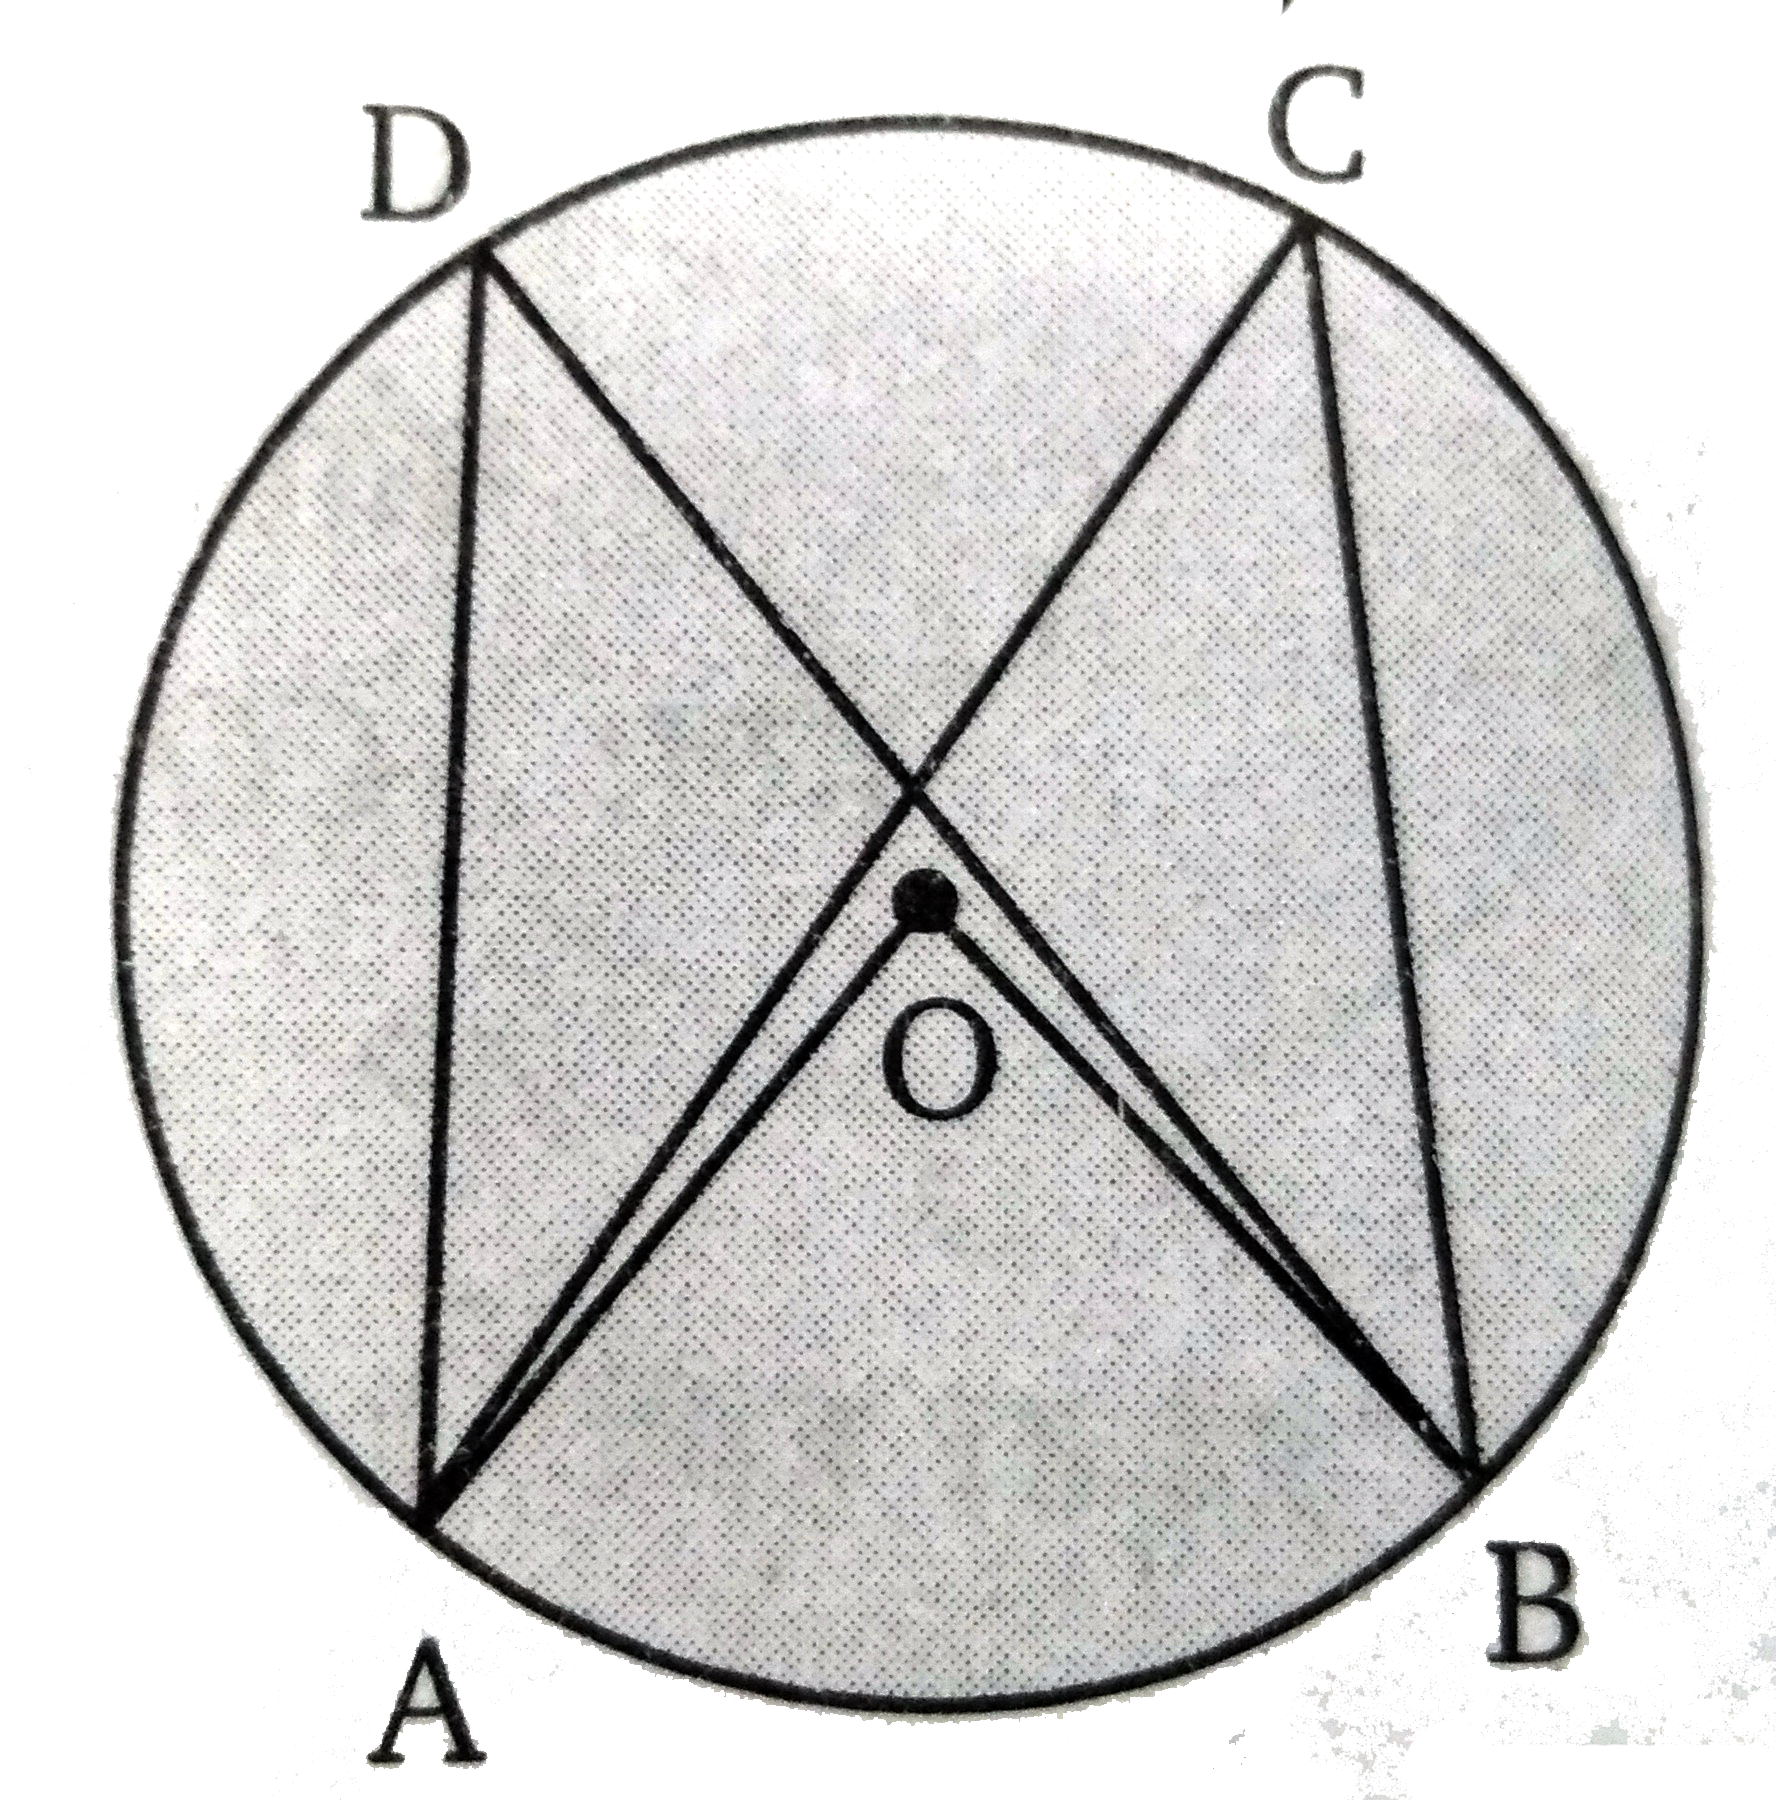
The correct Answer is:∠ADB=∠ACB
Step by step video & image solution for चित्र में, O वृत्त का केन्द्र है तथा angle ACB व angle ADB समान वृत्तखण्ड के कोण हैं तब angle ADB व angle ACB में सम्बन्ध ज्ञात कीजिए by Maths experts to help you in doubts & scoring excellent marks in Class 9 exams.
Updated on:21/07/2023Topper's Solved these Questions
- वृत्त BOOK - BALAJI PUBLICATIONCHAPTER - वृत्त EXERCISE - अभ्यास 15.2 (लघु उत्तरीय प्रश्न-I)
4 Videos
- वृत्त BOOK - BALAJI PUBLICATIONCHAPTER - वृत्त EXERCISE - अभ्यास 15.2 (लघु उत्तरीय प्रश्न-II)
2 Videos
- वृत्त BOOK - BALAJI PUBLICATIONCHAPTER - वृत्त EXERCISE - अभ्यास 15.1 (लघु उत्तरीय प्रश्न-II)
1 Videos
- वास्तविक संख्याओं के घातांक BOOK - BALAJI PUBLICATIONCHAPTER - वास्तविक संख्याओं के घातांक EXERCISE - स्वमूल्याकन परीक्षण
13 Videos
- शेषफल प्रमेय तथा गुणनखण्ड प्रमेय BOOK - BALAJI PUBLICATIONCHAPTER - शेषफल प्रमेय तथा गुणनखण्ड प्रमेय EXERCISE - स्वमूल्यांकन परिक्षण
20 Videos
Similar Questions
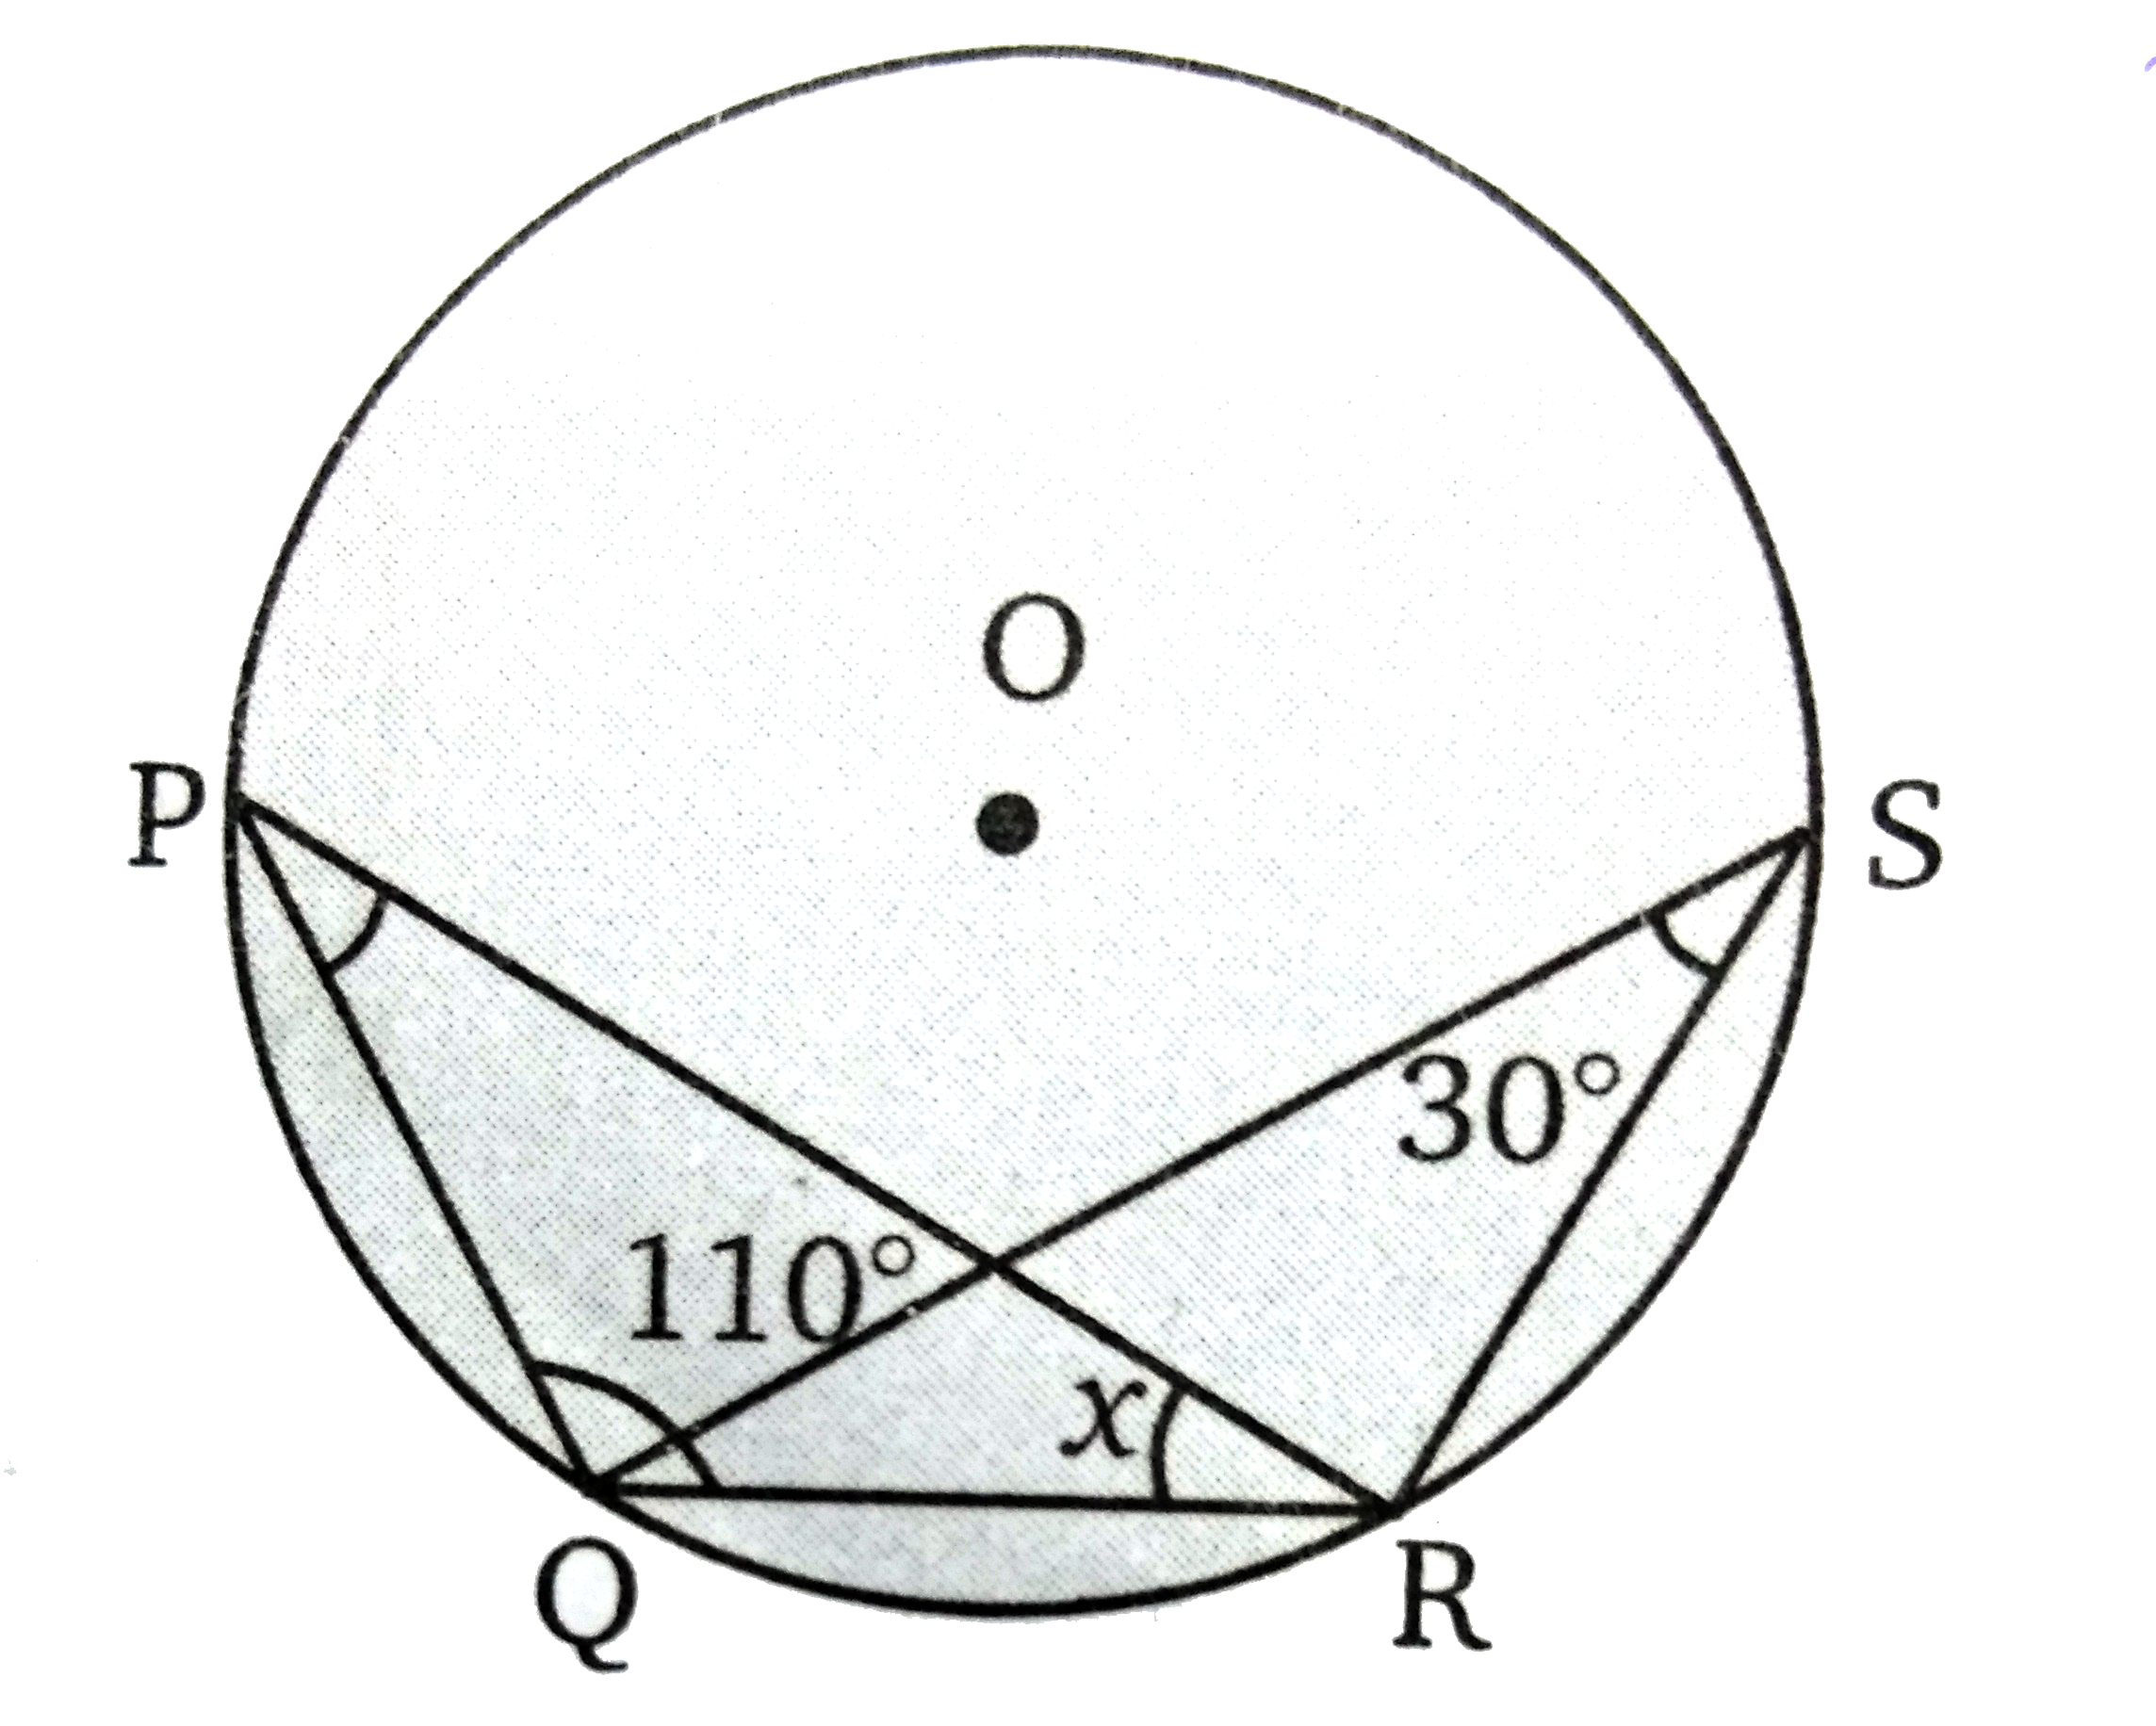
चित्र में x का मान ज्ञात कीजिए।
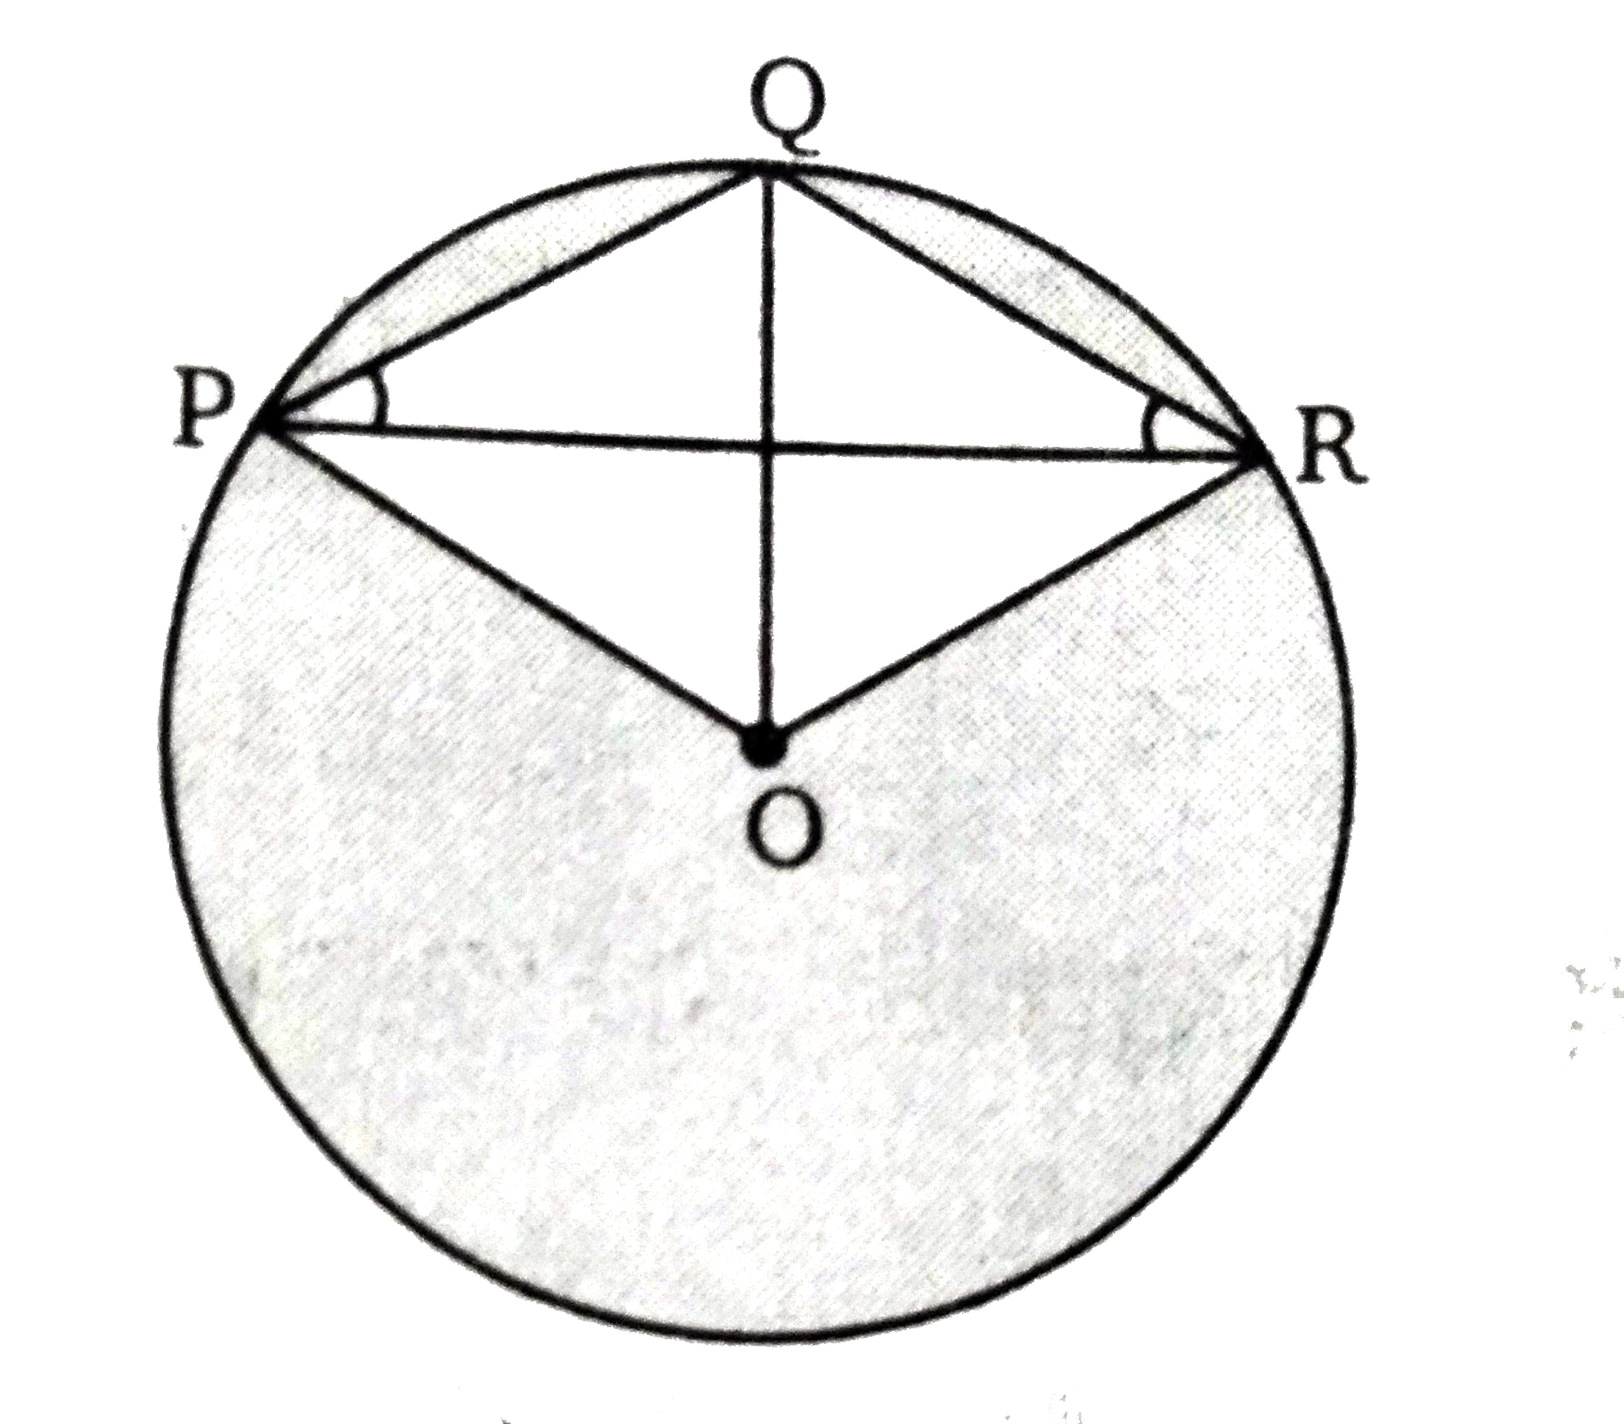
View Solutionचित्र में , O वृत्त का केन्द्र है तब सिद्ध कीजिए कि ∠POR=2(∠PRQ+∠QPR)
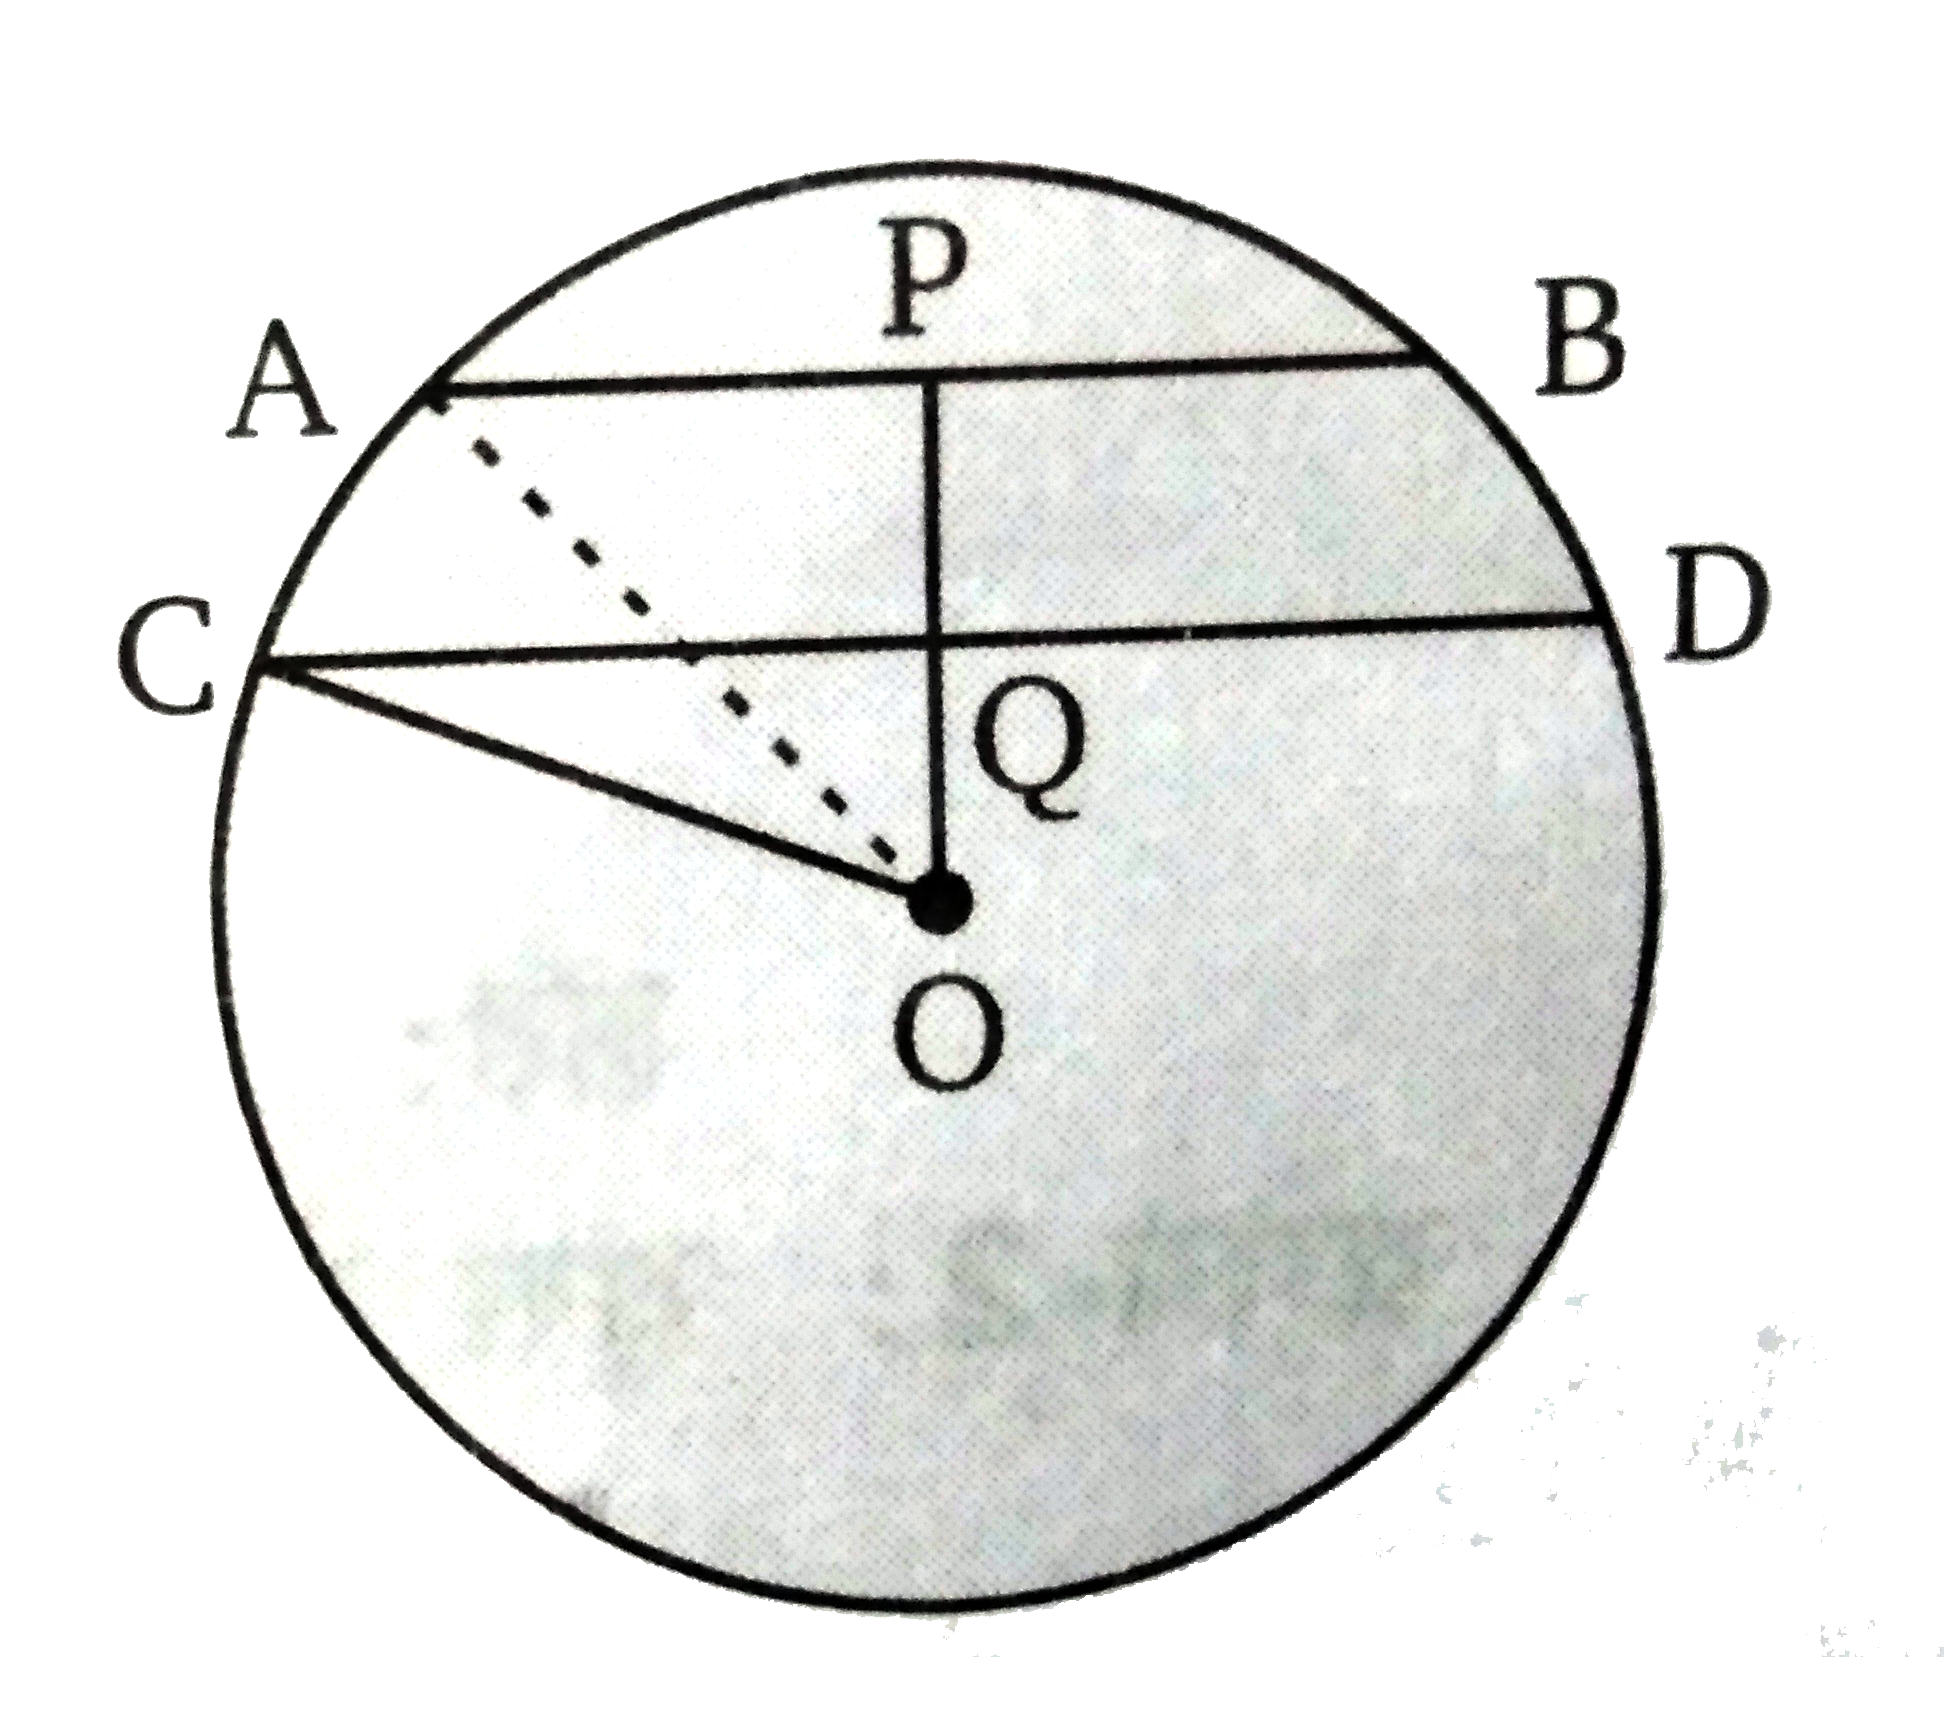
View Solutionचित्र में, O वृत्त का केन्द्र, त्रिज्या 5 सेमी तथा OP⊥AB,OQ⊥CD व AB।।CD AB = 6 सेमी, CD = 8 सेमी है। PQ का मान ज्ञात कीजिए।
View Solutionनिम्न का सरलीकरण कीजिए-
(24332)−4/5
View Solutionx3+3x2+3x+1 को 5+2x से भाग करने पर शेषफल ज्ञात कीजिए।
View SolutionDetermine the point of symmetry of a regular hexagon.
View SolutionIn the figure above (not to scale), ¯¯¯¯¯¯AB⊥¯¯¯¯¯¯CDandAD is the bisector of ∠BAE.AB=3cm and AC=5cm. Find CD.
View SolutionIn the given figure, AB is a diameter, O is the center of the circle and ∠OCB=50∘ then find ∠DBC.
View SolutionIn the diagram , O is the centre of the circle and ∠OPA=30∘, Find ∠ACBand∠ADB respectively.
View SolutionMatch the following Column A to Column B

View SolutionMatch the following Column A to Column B

View SolutionMatch the following Column A to Column B

View SolutionThe inequation represented by the graph given below is :
View SolutionThe inequation that best describes the graph given below is _________
View SolutionThe inequation that best describes the following graph is _________
View Solution
