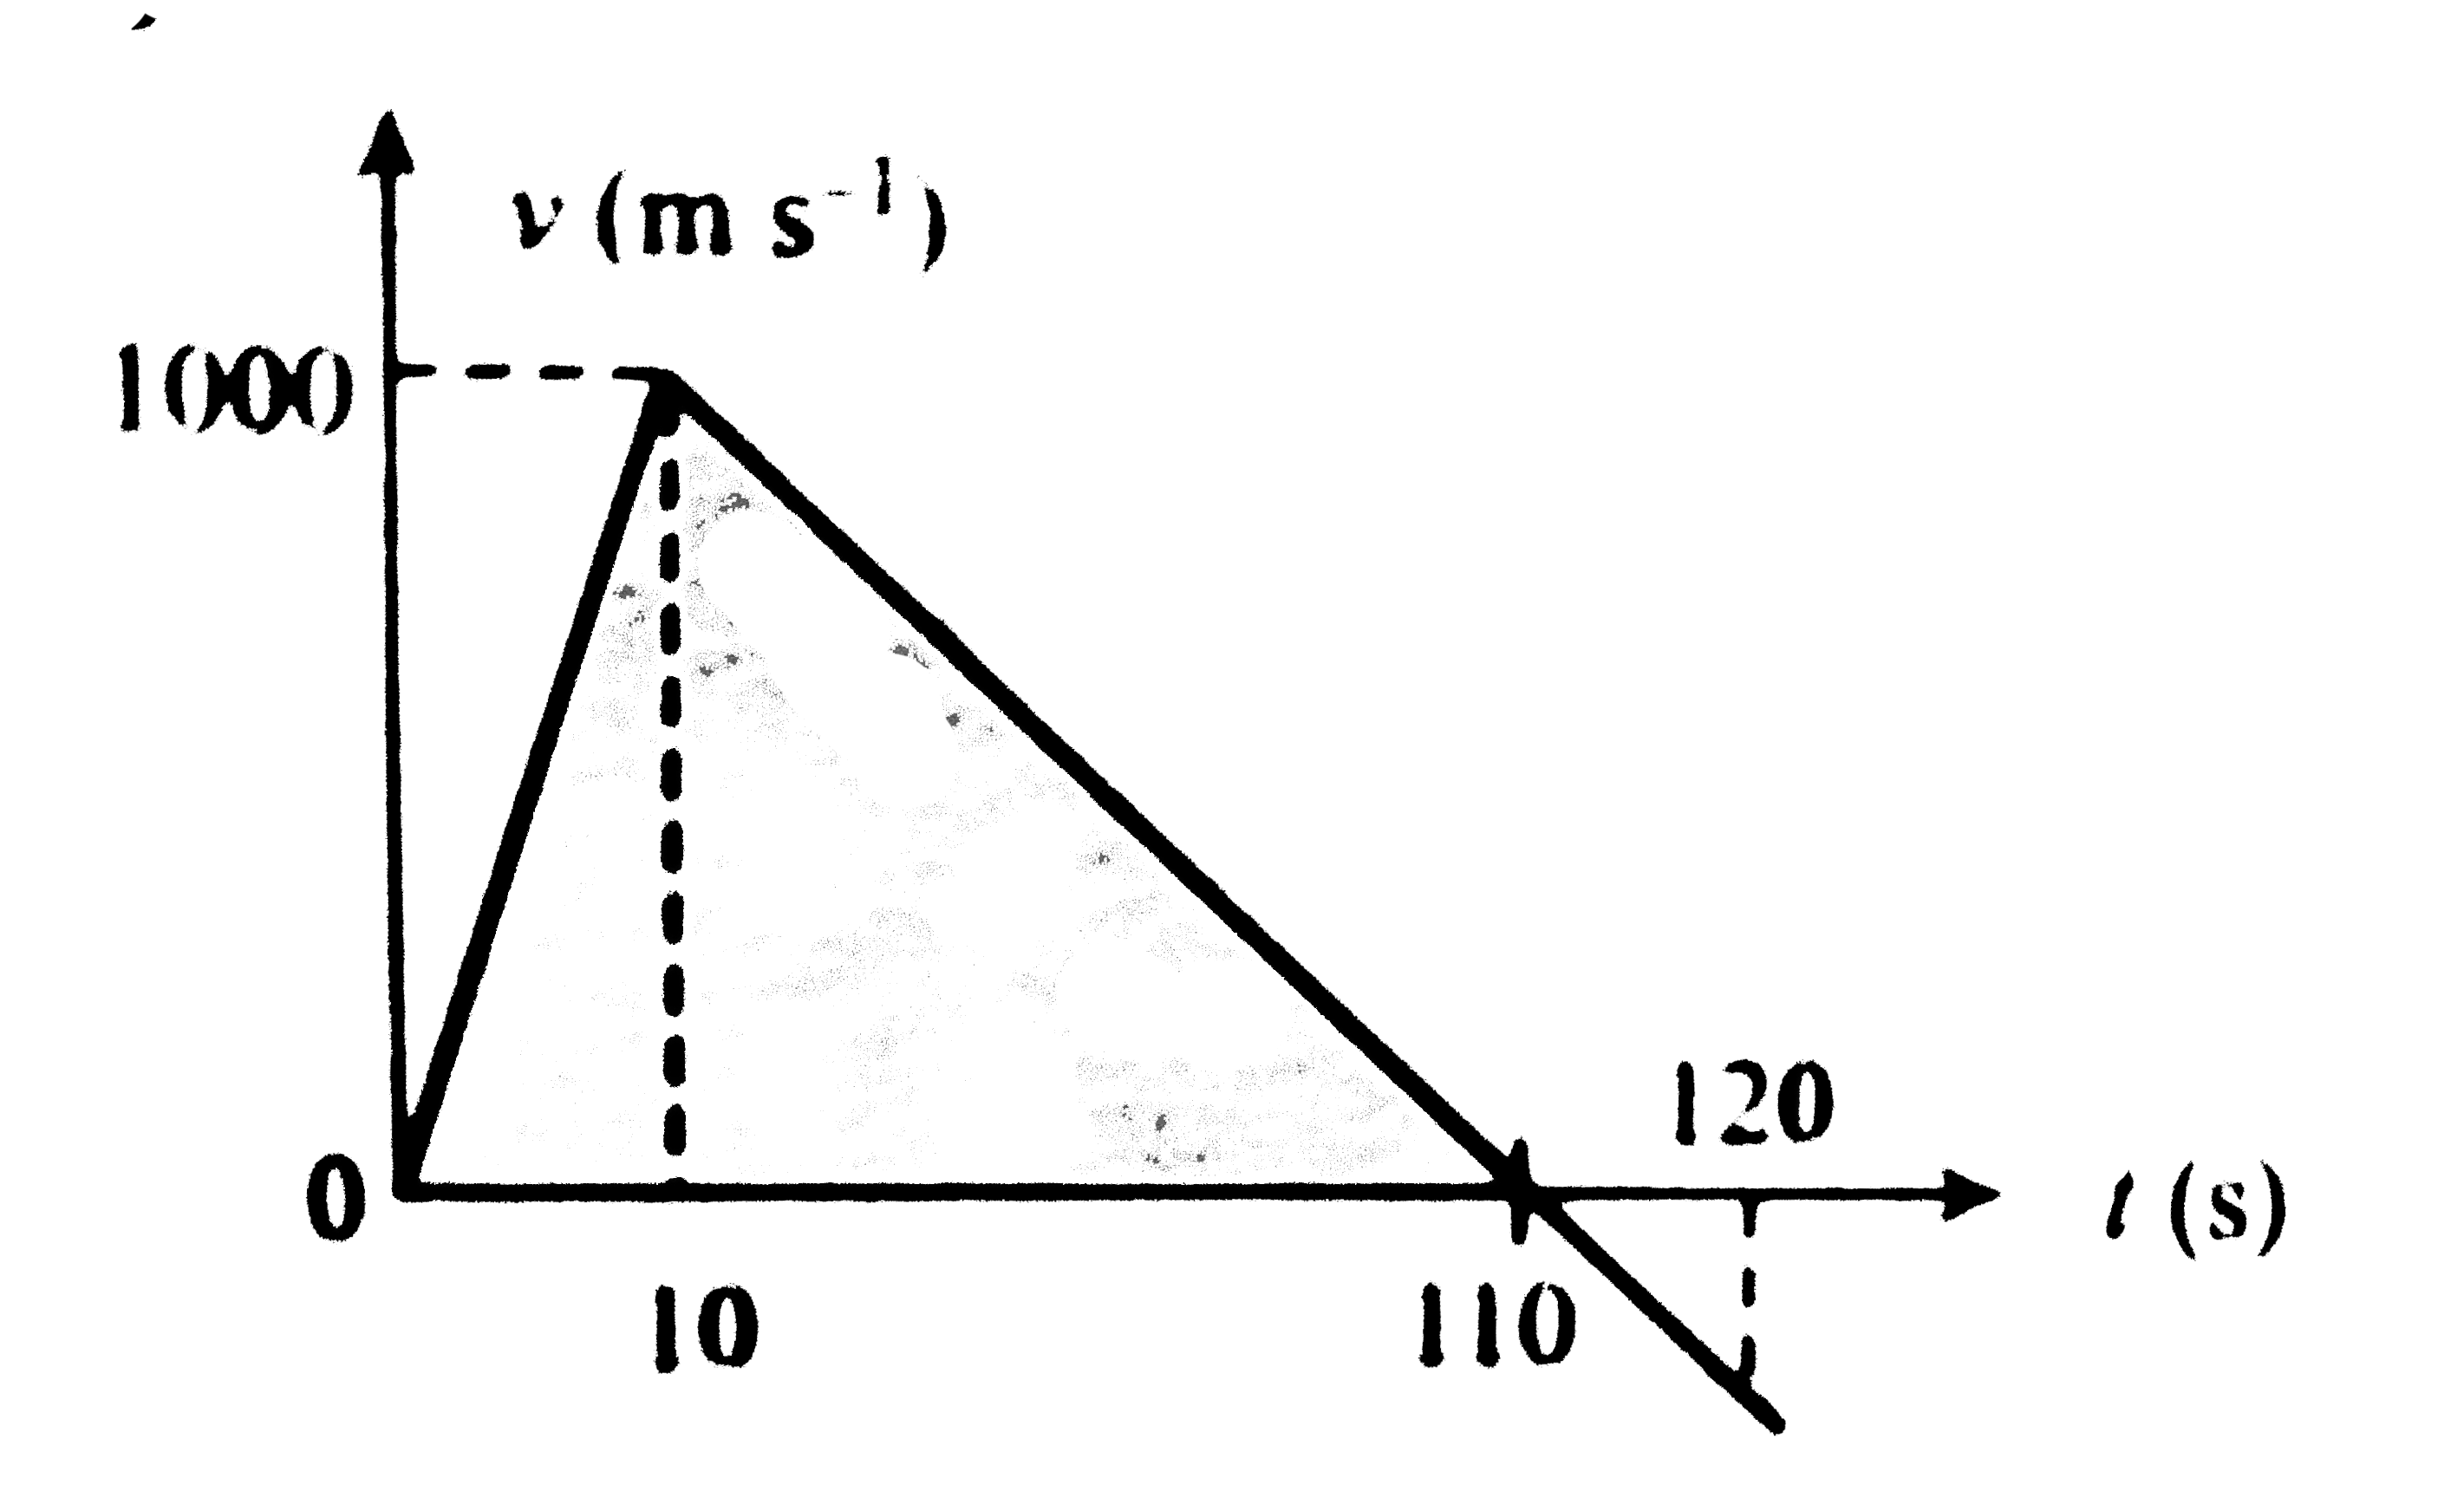
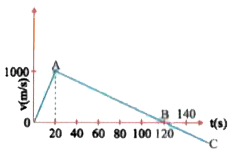
The follwing graph shows the variation of velocity of a rocker with time. Then the mximum height attained by the rocket is.
 .
.
1.1km
5km
55km
None of these
The correct Answer is:C
Maximum height will be attained at 110s. Because after 110s. Velocity becomes negative and rocket will start coming down.
Area from 0 to 110s is
12×110×1000=55,00m=55km.
Topper's Solved these Questions
- KINEMATICS-1Book:CENGAGE PHYSICSChapter:KINEMATICS-1Exercise:Graphical cancept
Explore 1 Video
- KINEMATICS-1Book:CENGAGE PHYSICSChapter:KINEMATICS-1Exercise:Multiple Correct
Explore 16 Videos
- KINEMATICS-1Book:CENGAGE PHYSICSChapter:KINEMATICS-1Exercise:Single Correct
Explore 52 Videos
- GRAVITATIONBook:CENGAGE PHYSICSChapter:GRAVITATIONExercise:INTEGER_TYPE
Explore 1 Video
- KINEMATICS-2Book:CENGAGE PHYSICSChapter:KINEMATICS-2Exercise:Exercise Integer
Explore 9 Videos
Similar Questions
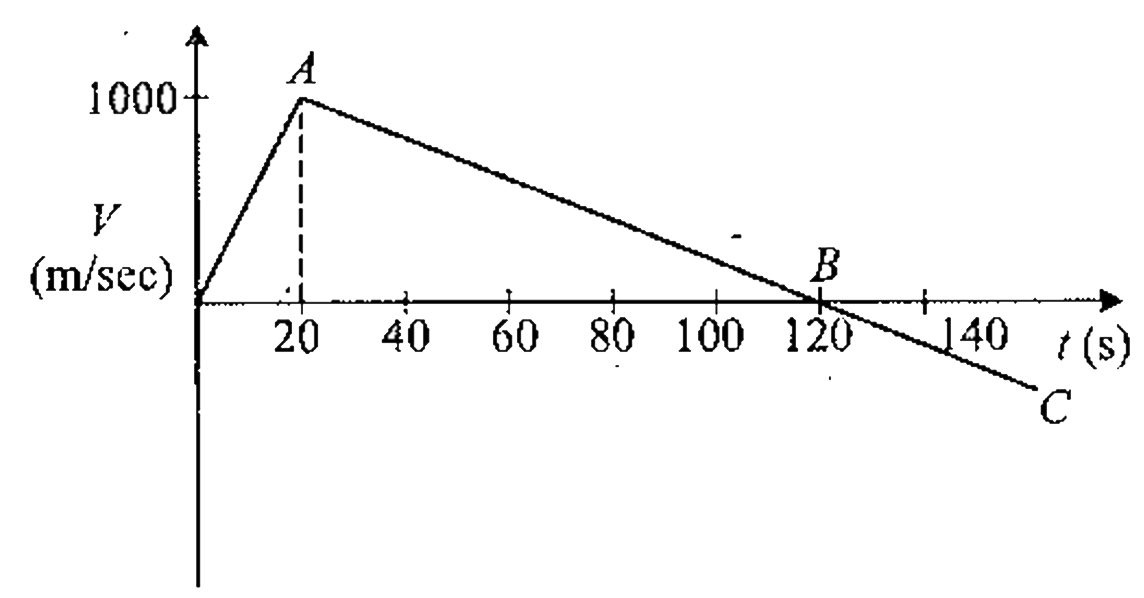
A rocket is projected vertically upwards and its time velocity graph is shown in the figure-1.115. The maximum height attained by the rocket is :
View SolutionA rocket is fired upwards such that its engine takes 10 s to explods fully. Its velocity- time graph is as shown in the figure. Acceleration due to gravity is 10m/s2.
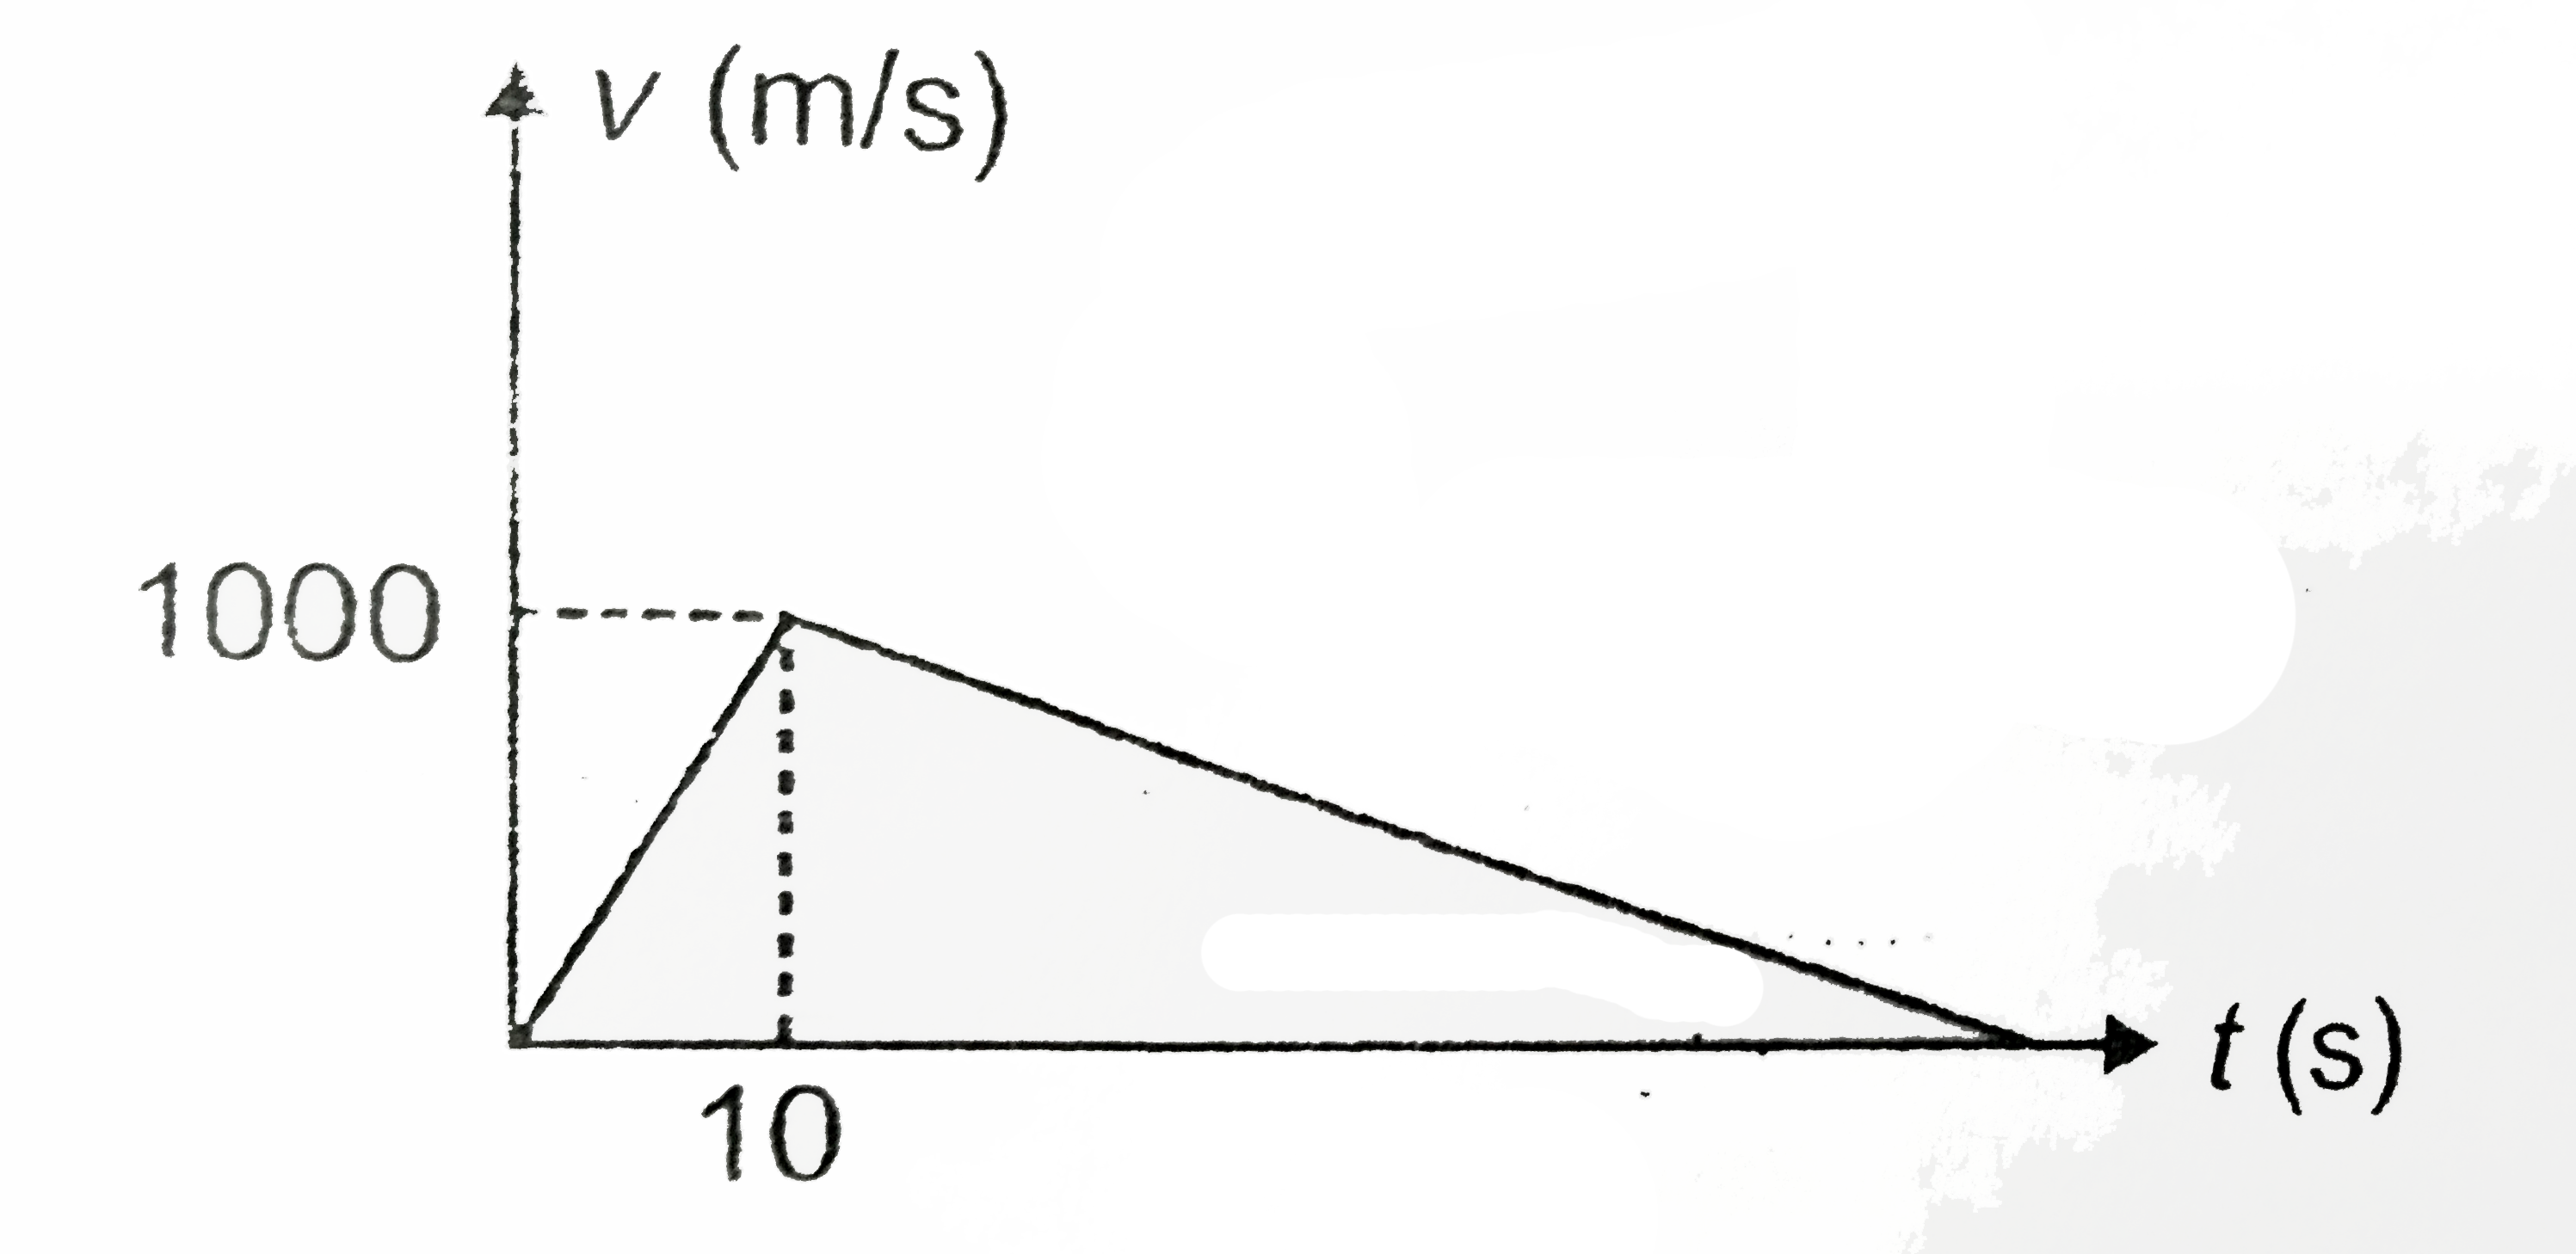
The maximum height attained by the rocket is
View Solution
Knowledge Check
The graph shown the variation of velocity of a rocket with time. Then, the maximum height attained by the rocket is.
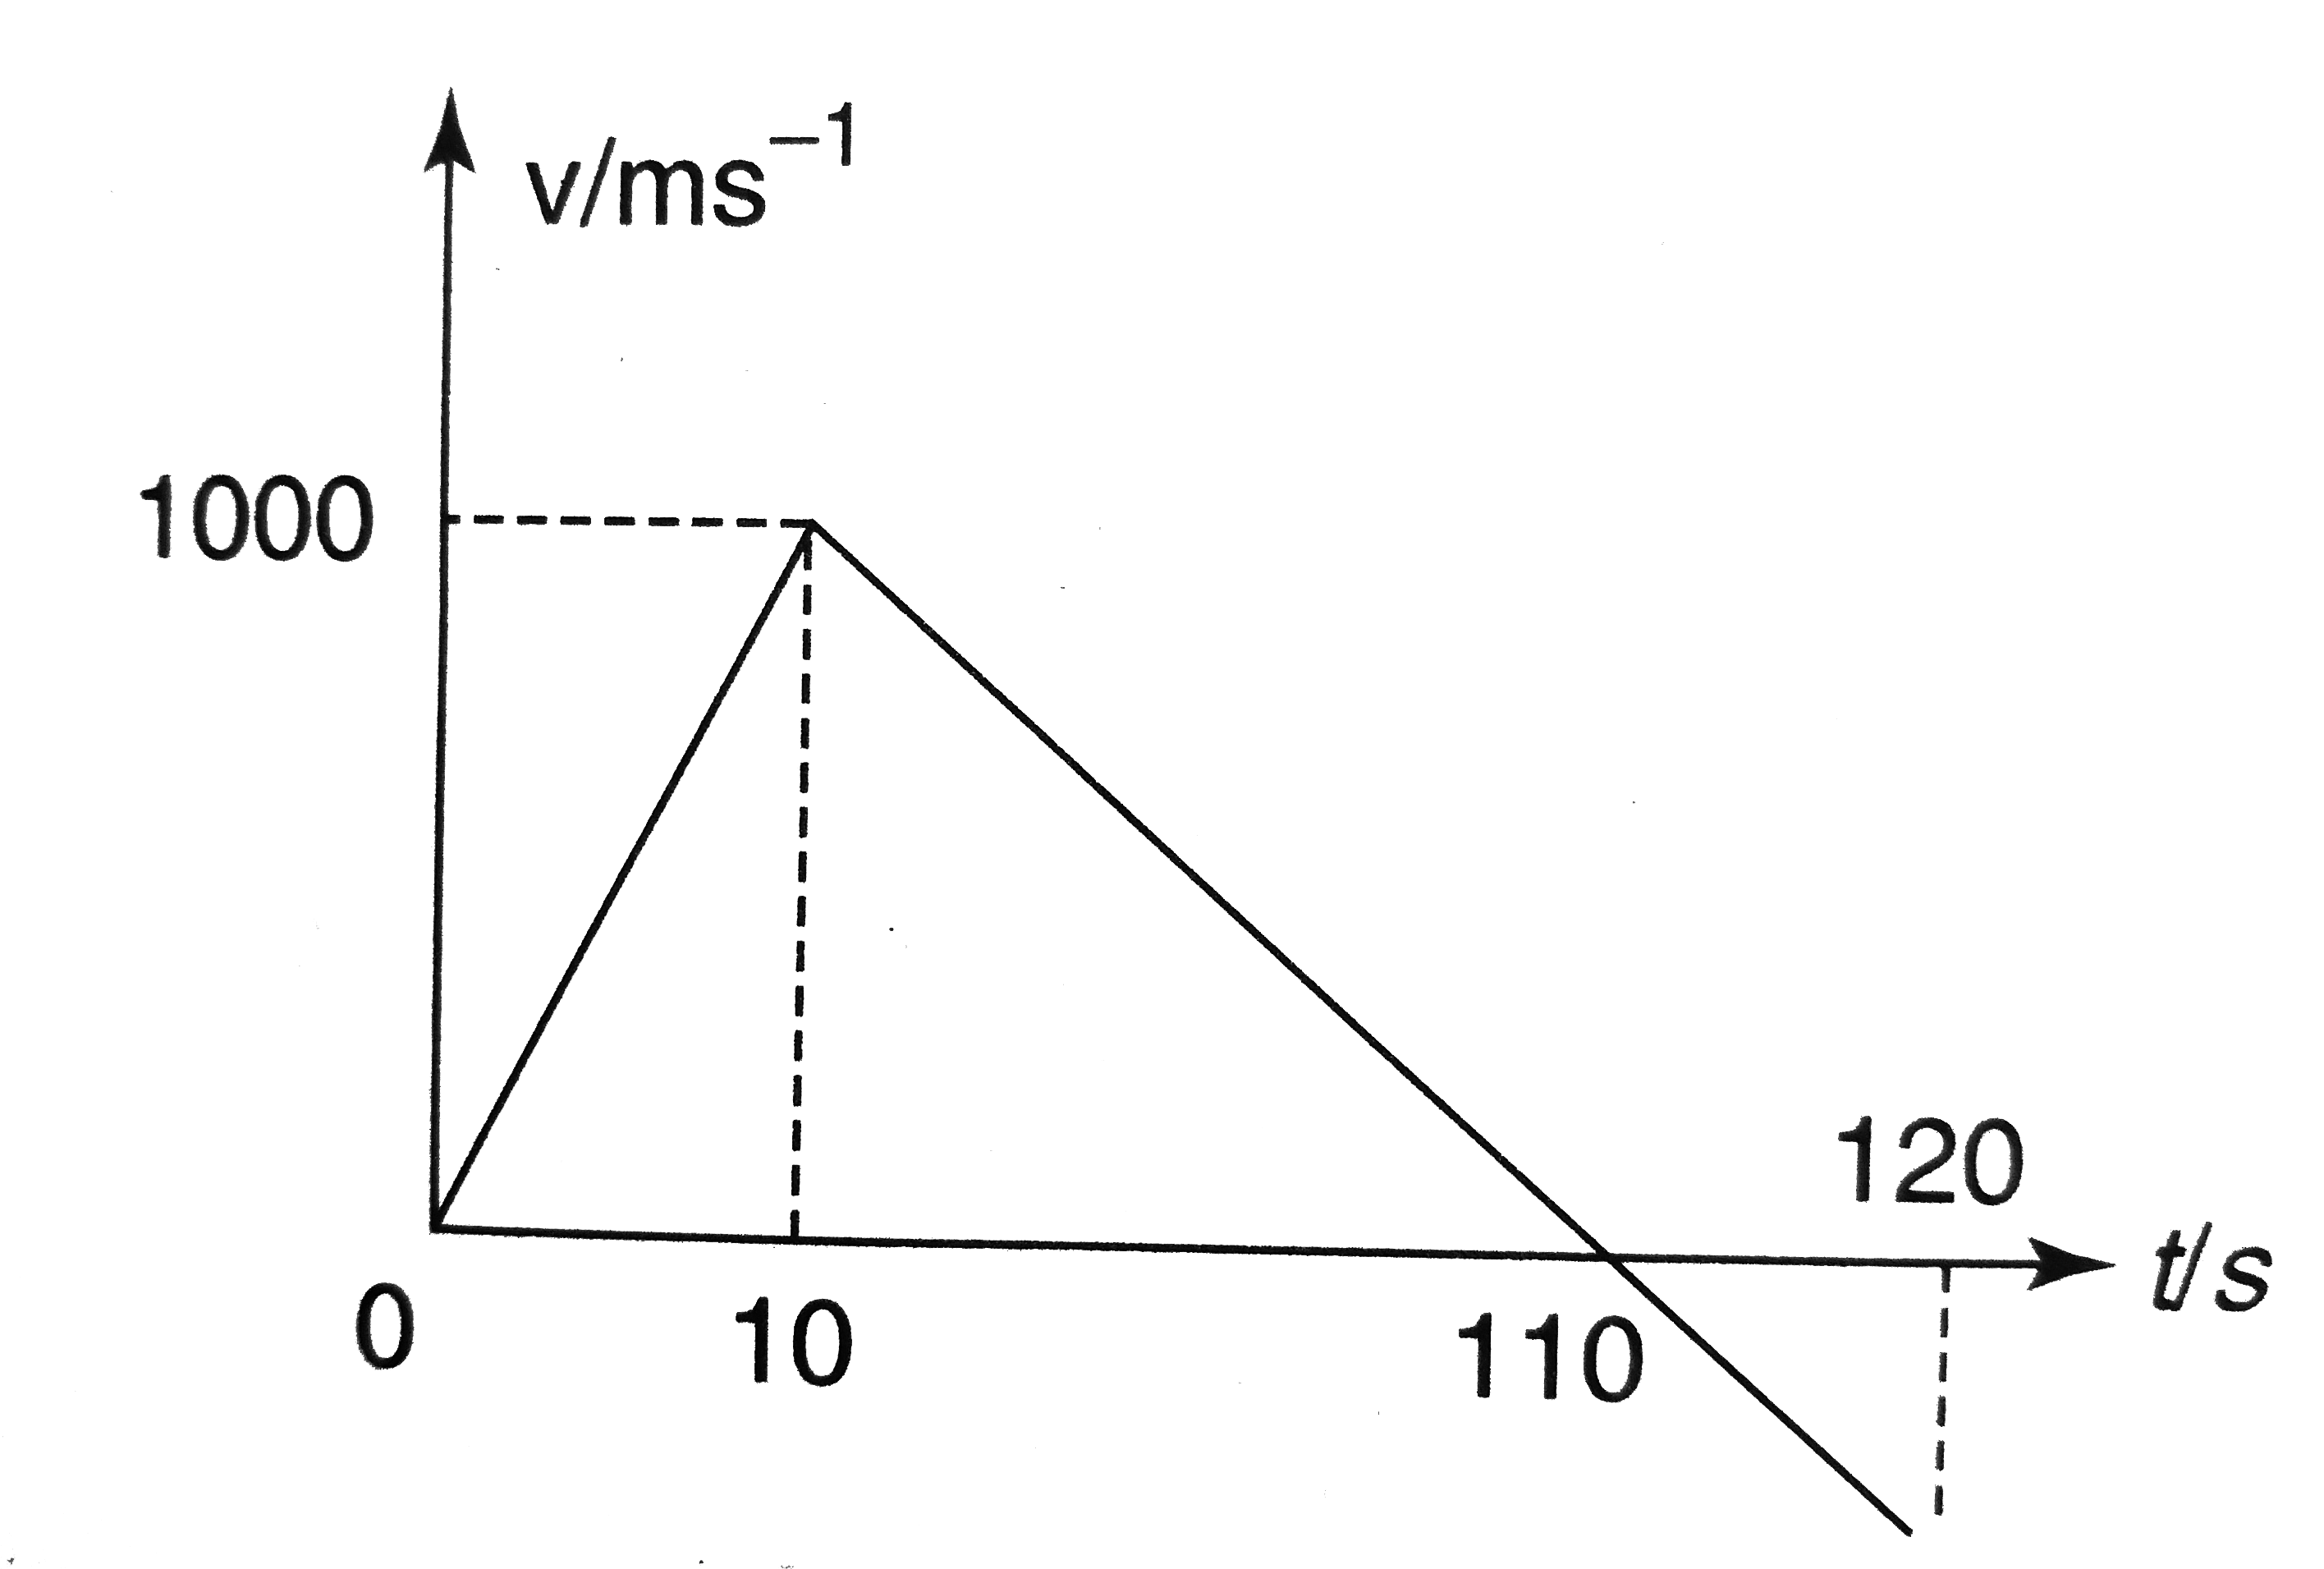 A1.1kmB5kmC55kmDnone of these
A rocket is launched upward from the earth surface whose velocity time graph shown in figure. Then maximum height attained by the rocket is :-
 A1 kmB10 kmC100 kmD70 km
A rocket is launched upward from the earth surface whose velocity time graph shown in figure. Then maximum height attained by the rocket is :-
 A1 kmB10 kmC20 kmD60 km
Draw a graph showing the variation of decay rate with number of active nuclei.
View SolutionDraw a graph showing the variation of decay rate with number of active nuclei.
View SolutionThe graph showing the variation of decay rate with number of nuclei is:
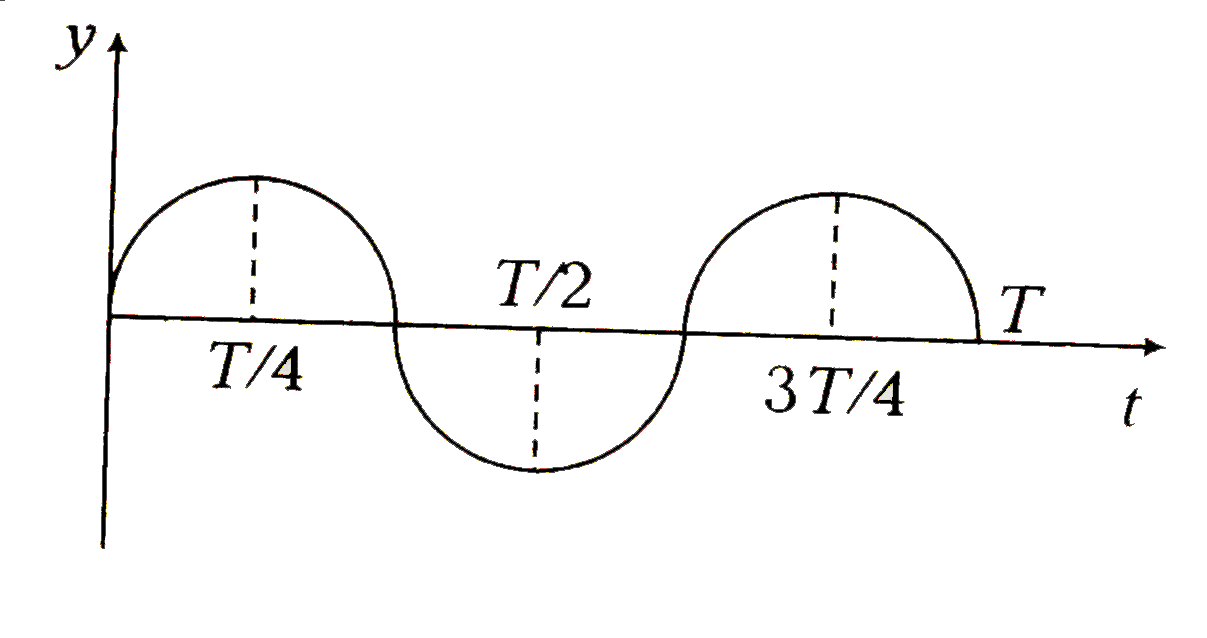
View SolutionThe graph shows the variation of displacement of a particle executing SHM with time . We infer from this graph that
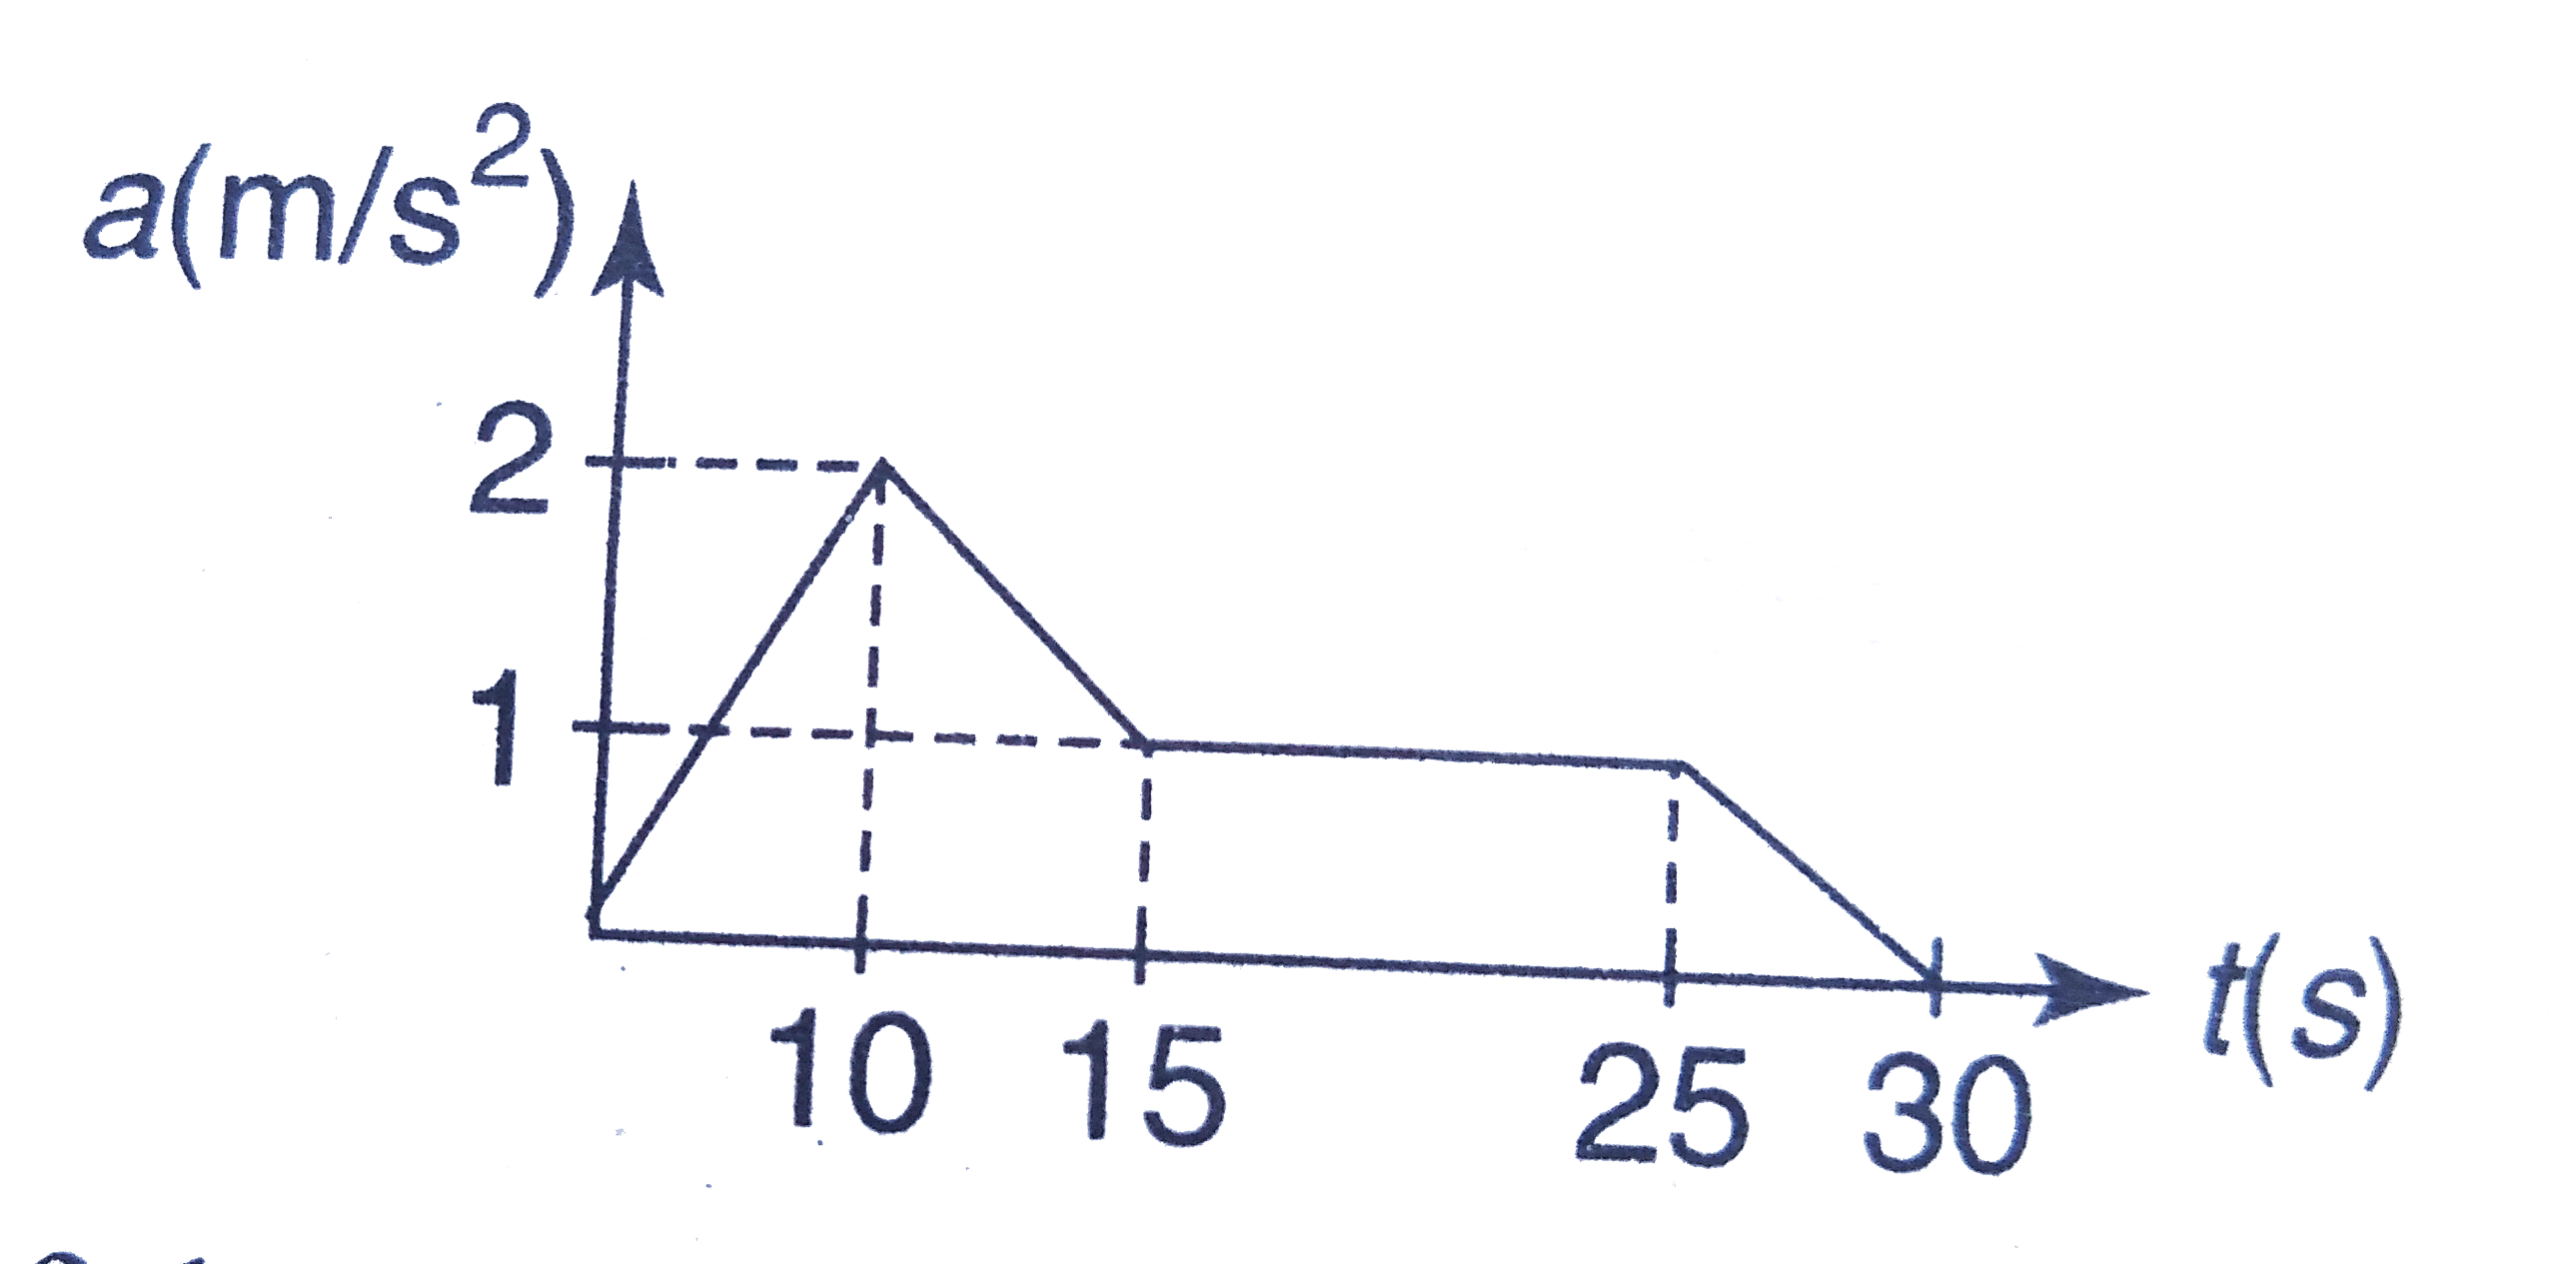
View SolutionIn figure shown, the graph shows the variation of acceleration of body with time t. The velcocity of the body at t=0 is zero. The velocity of the body at t=30s is.
View Solution