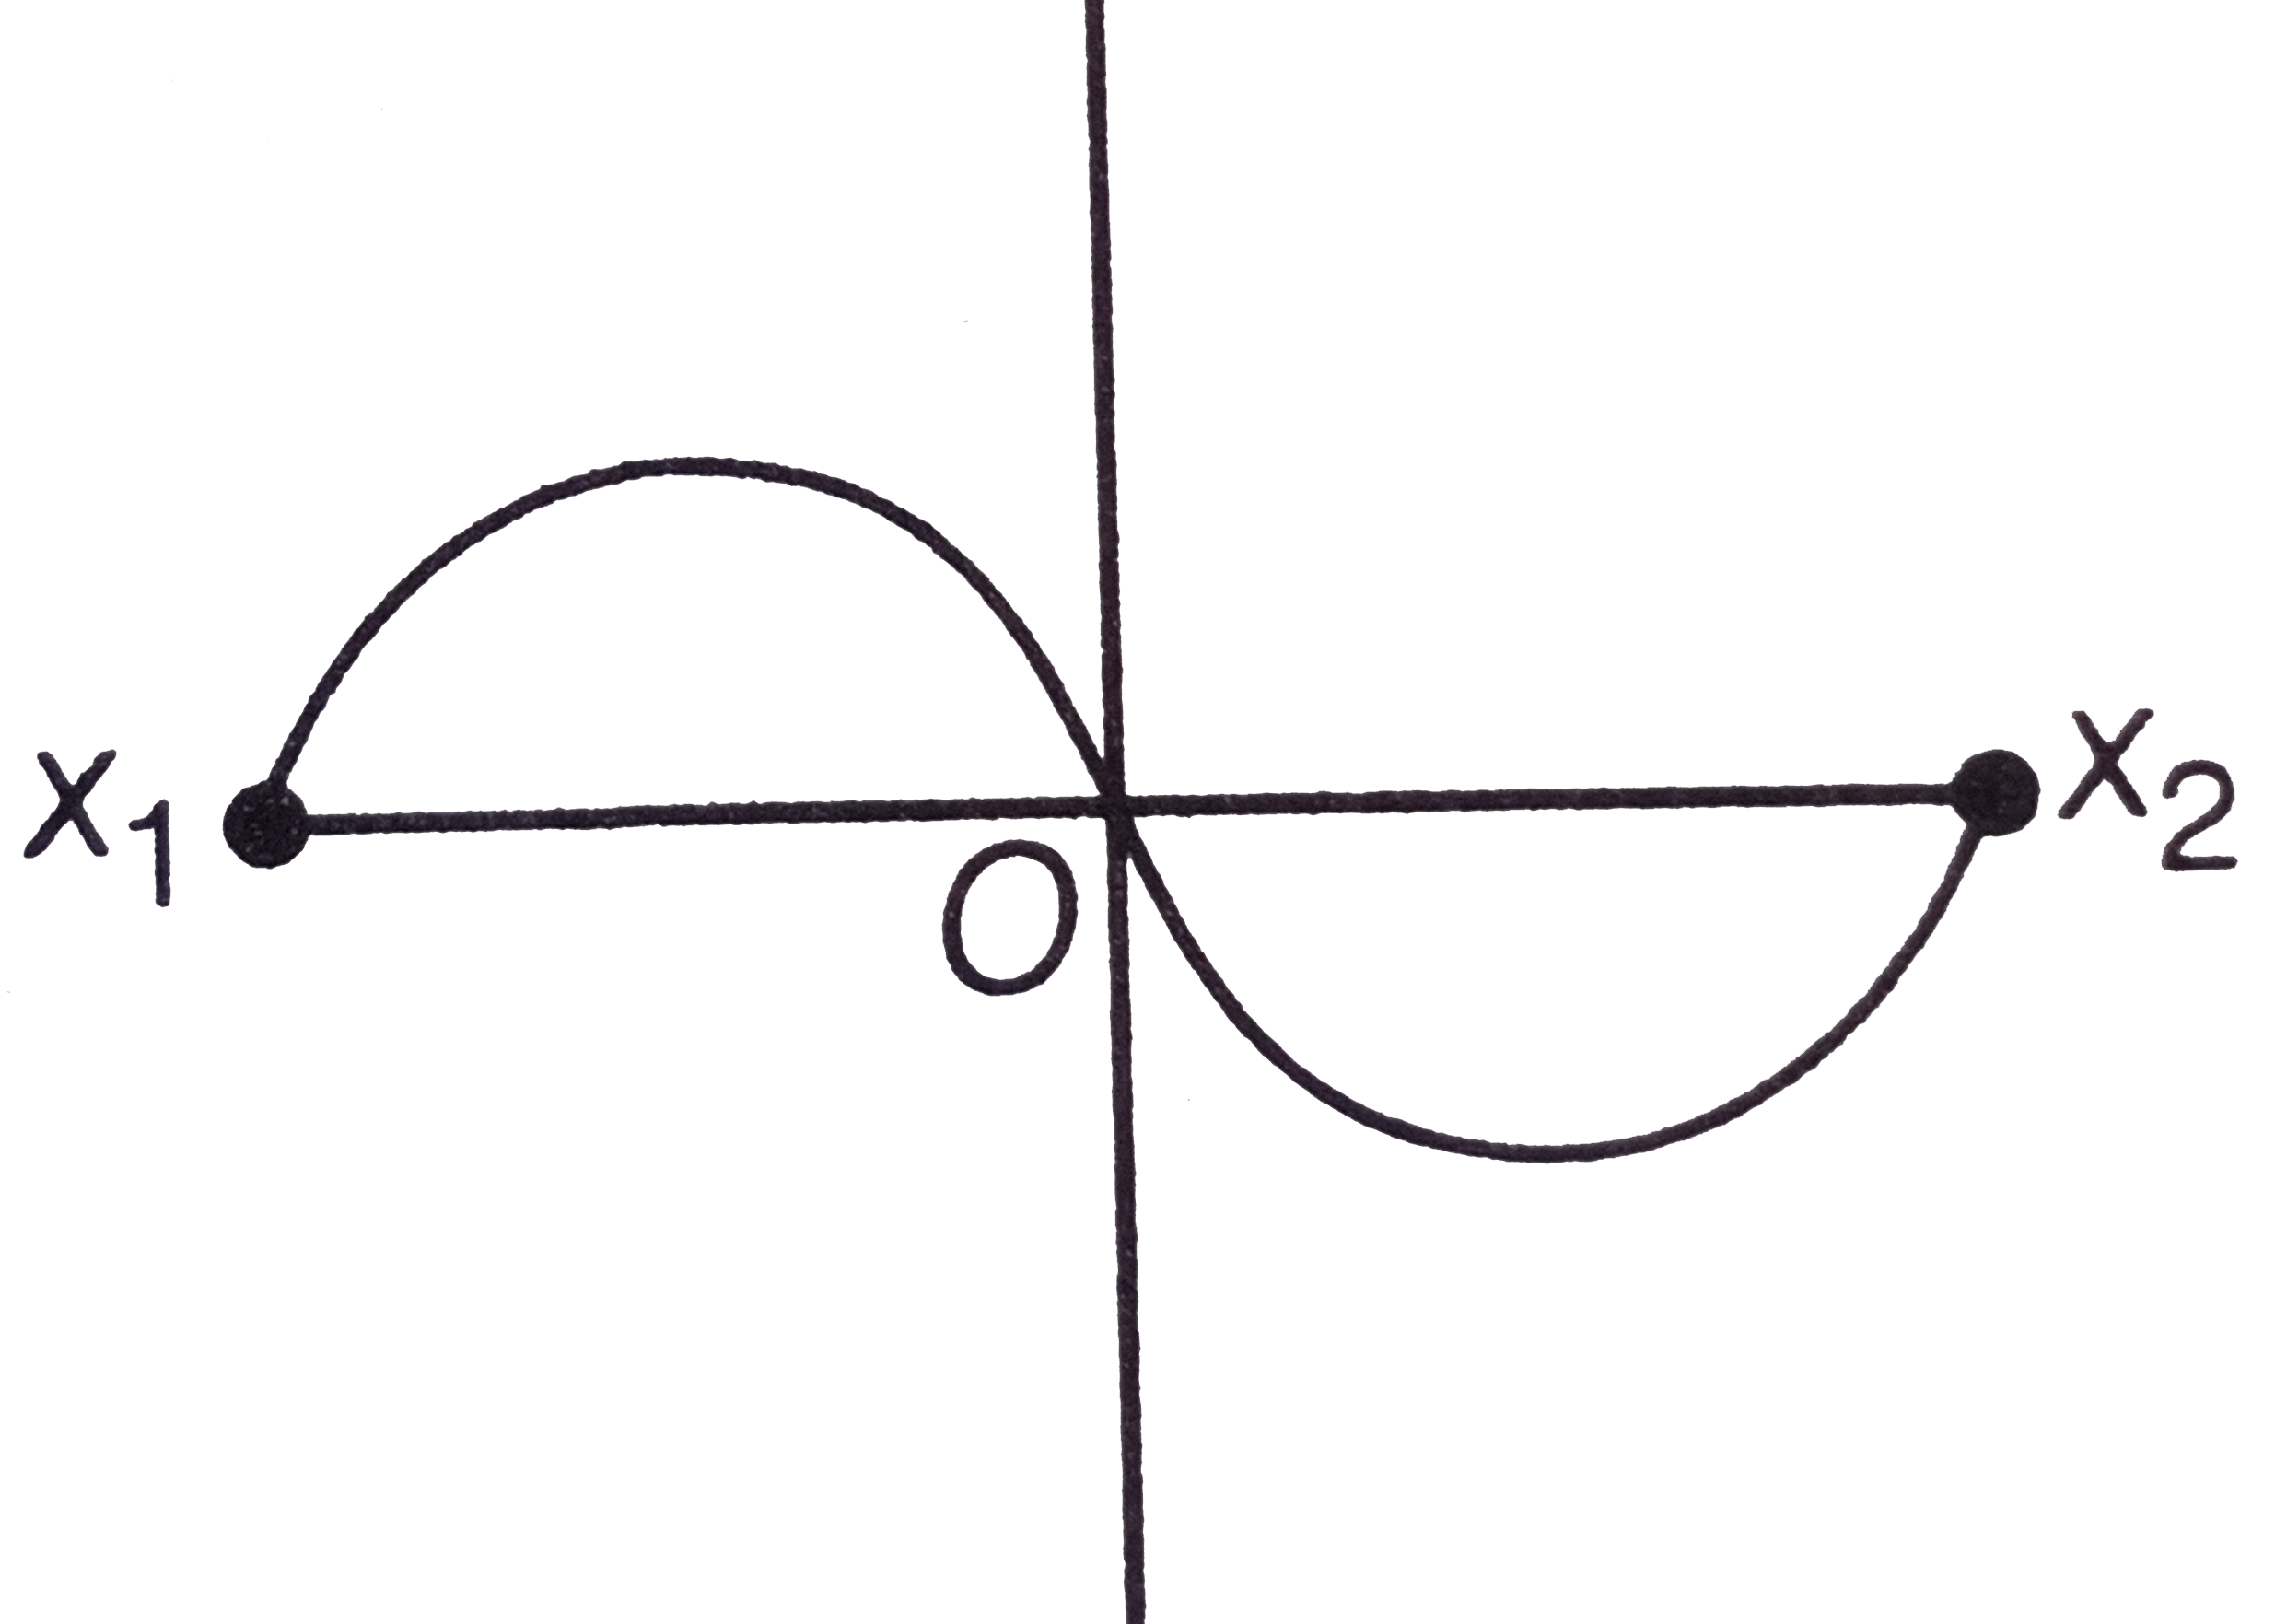
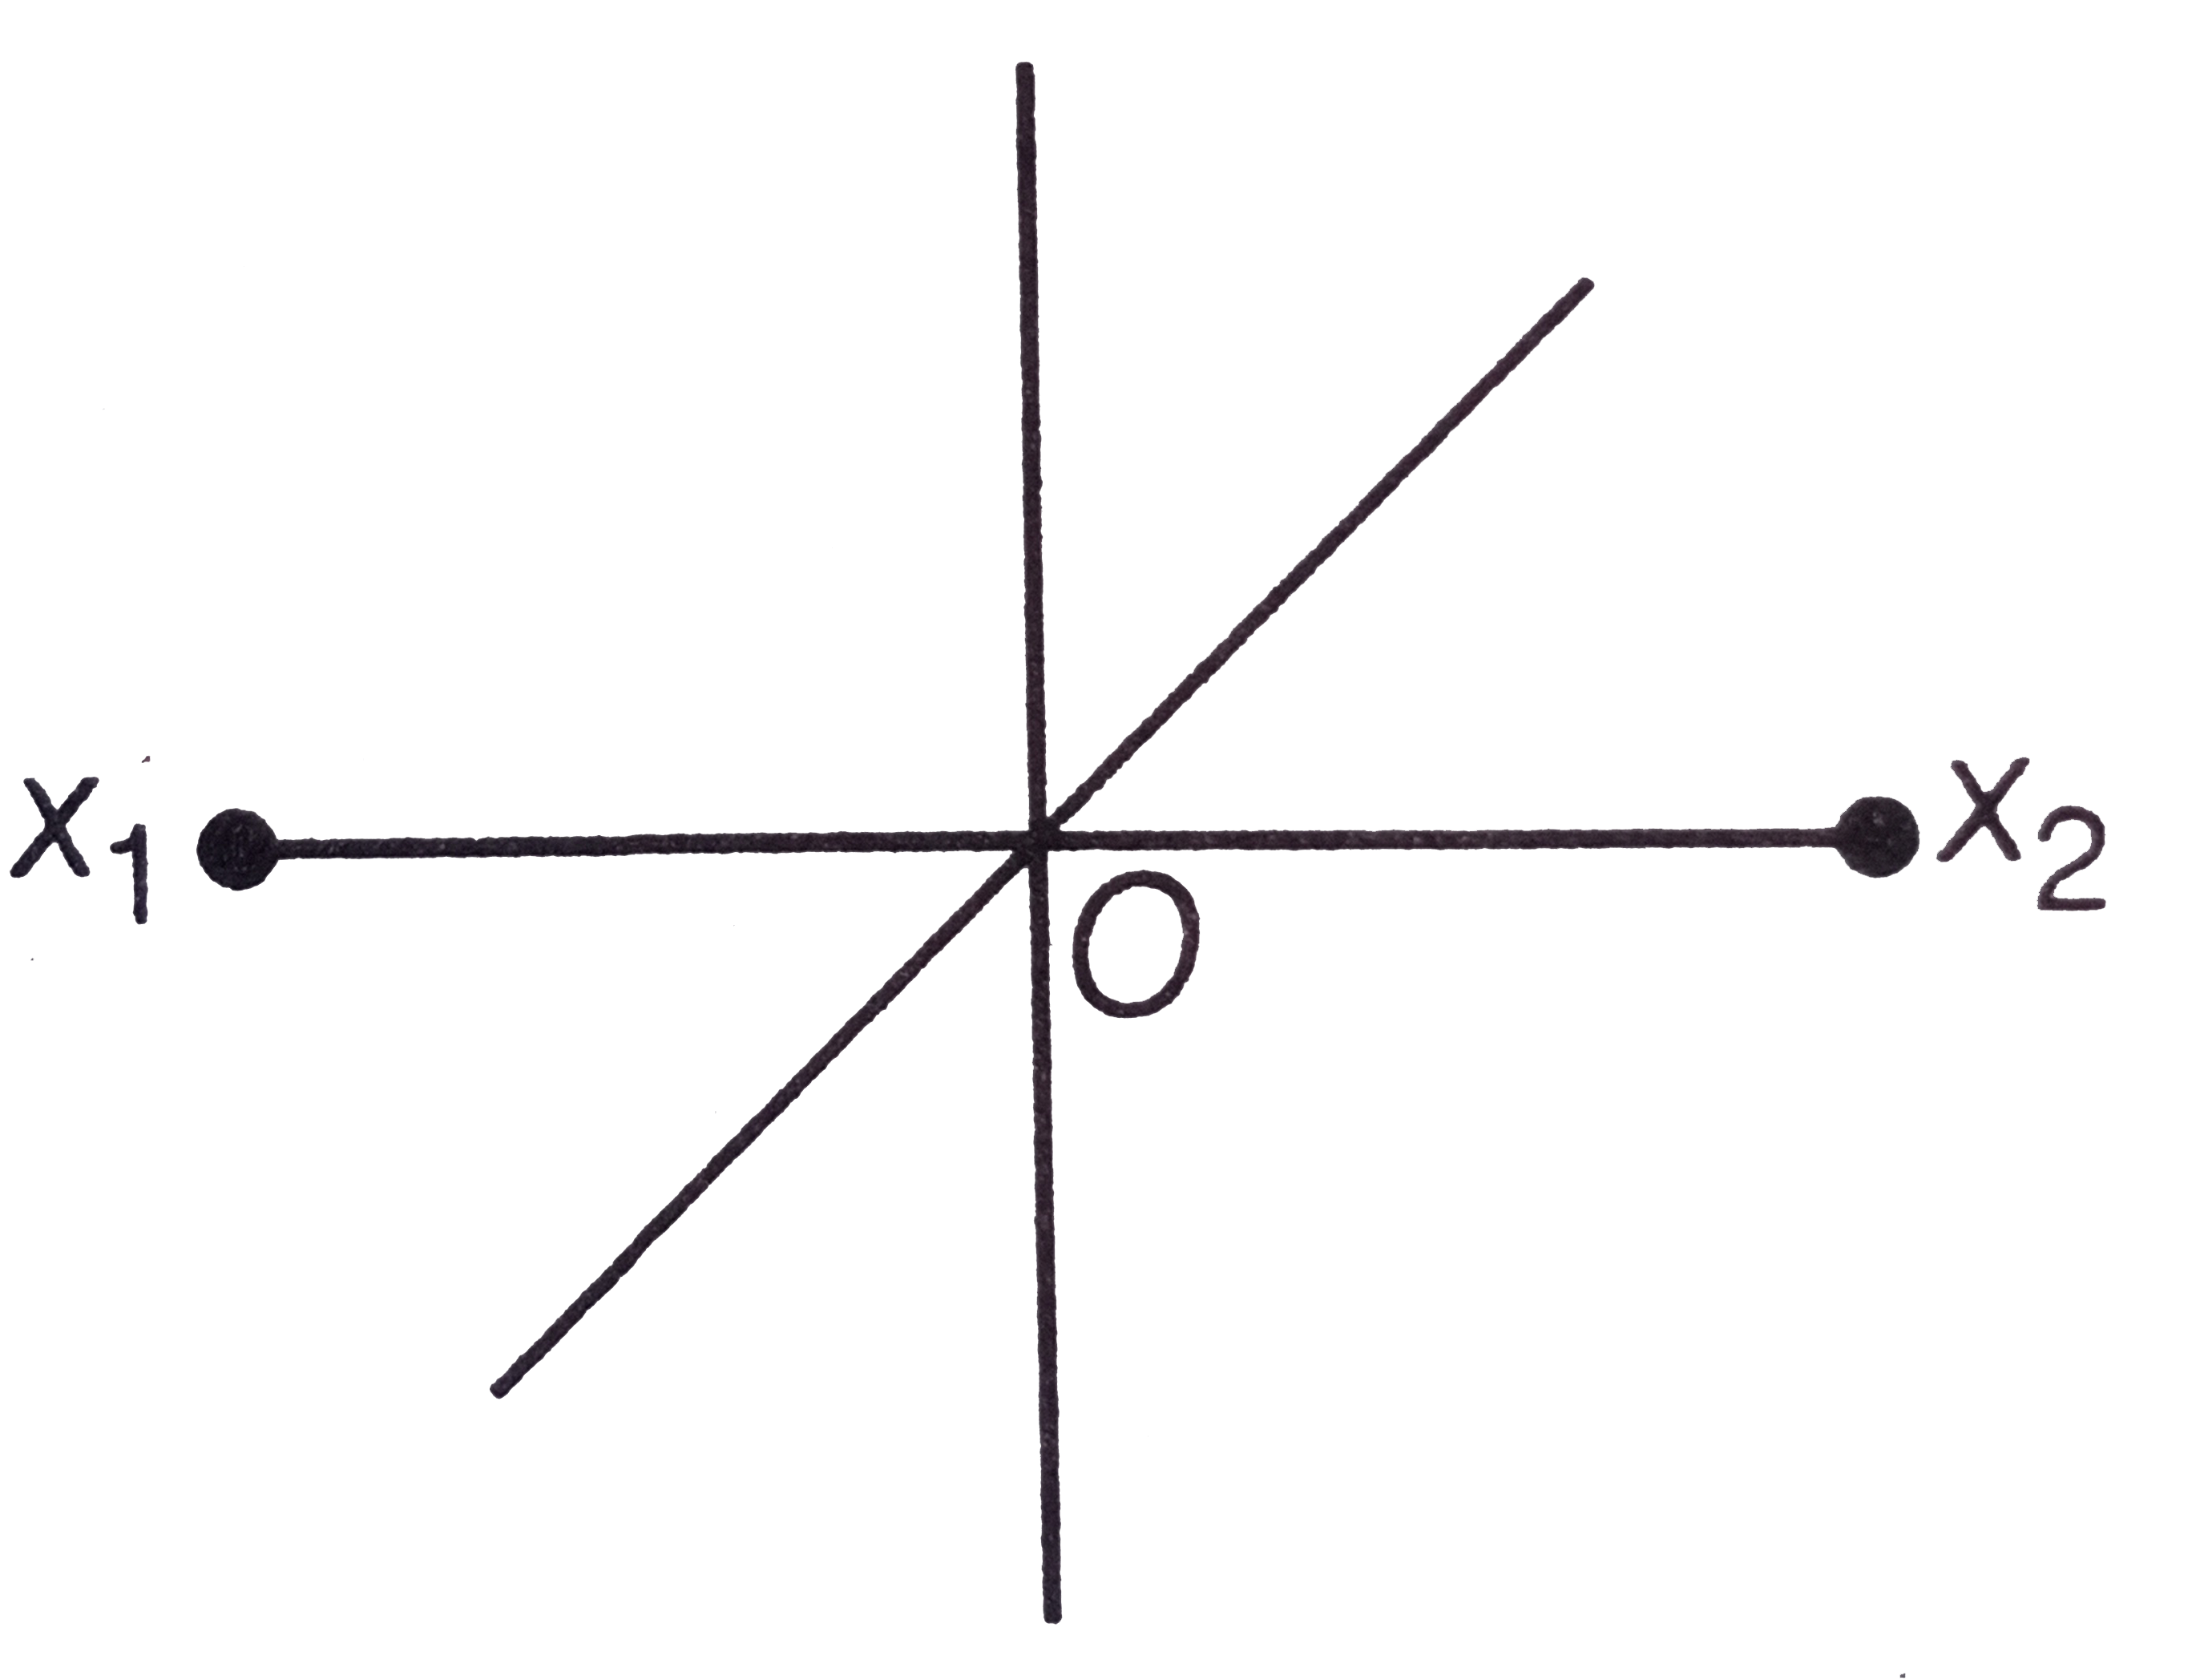
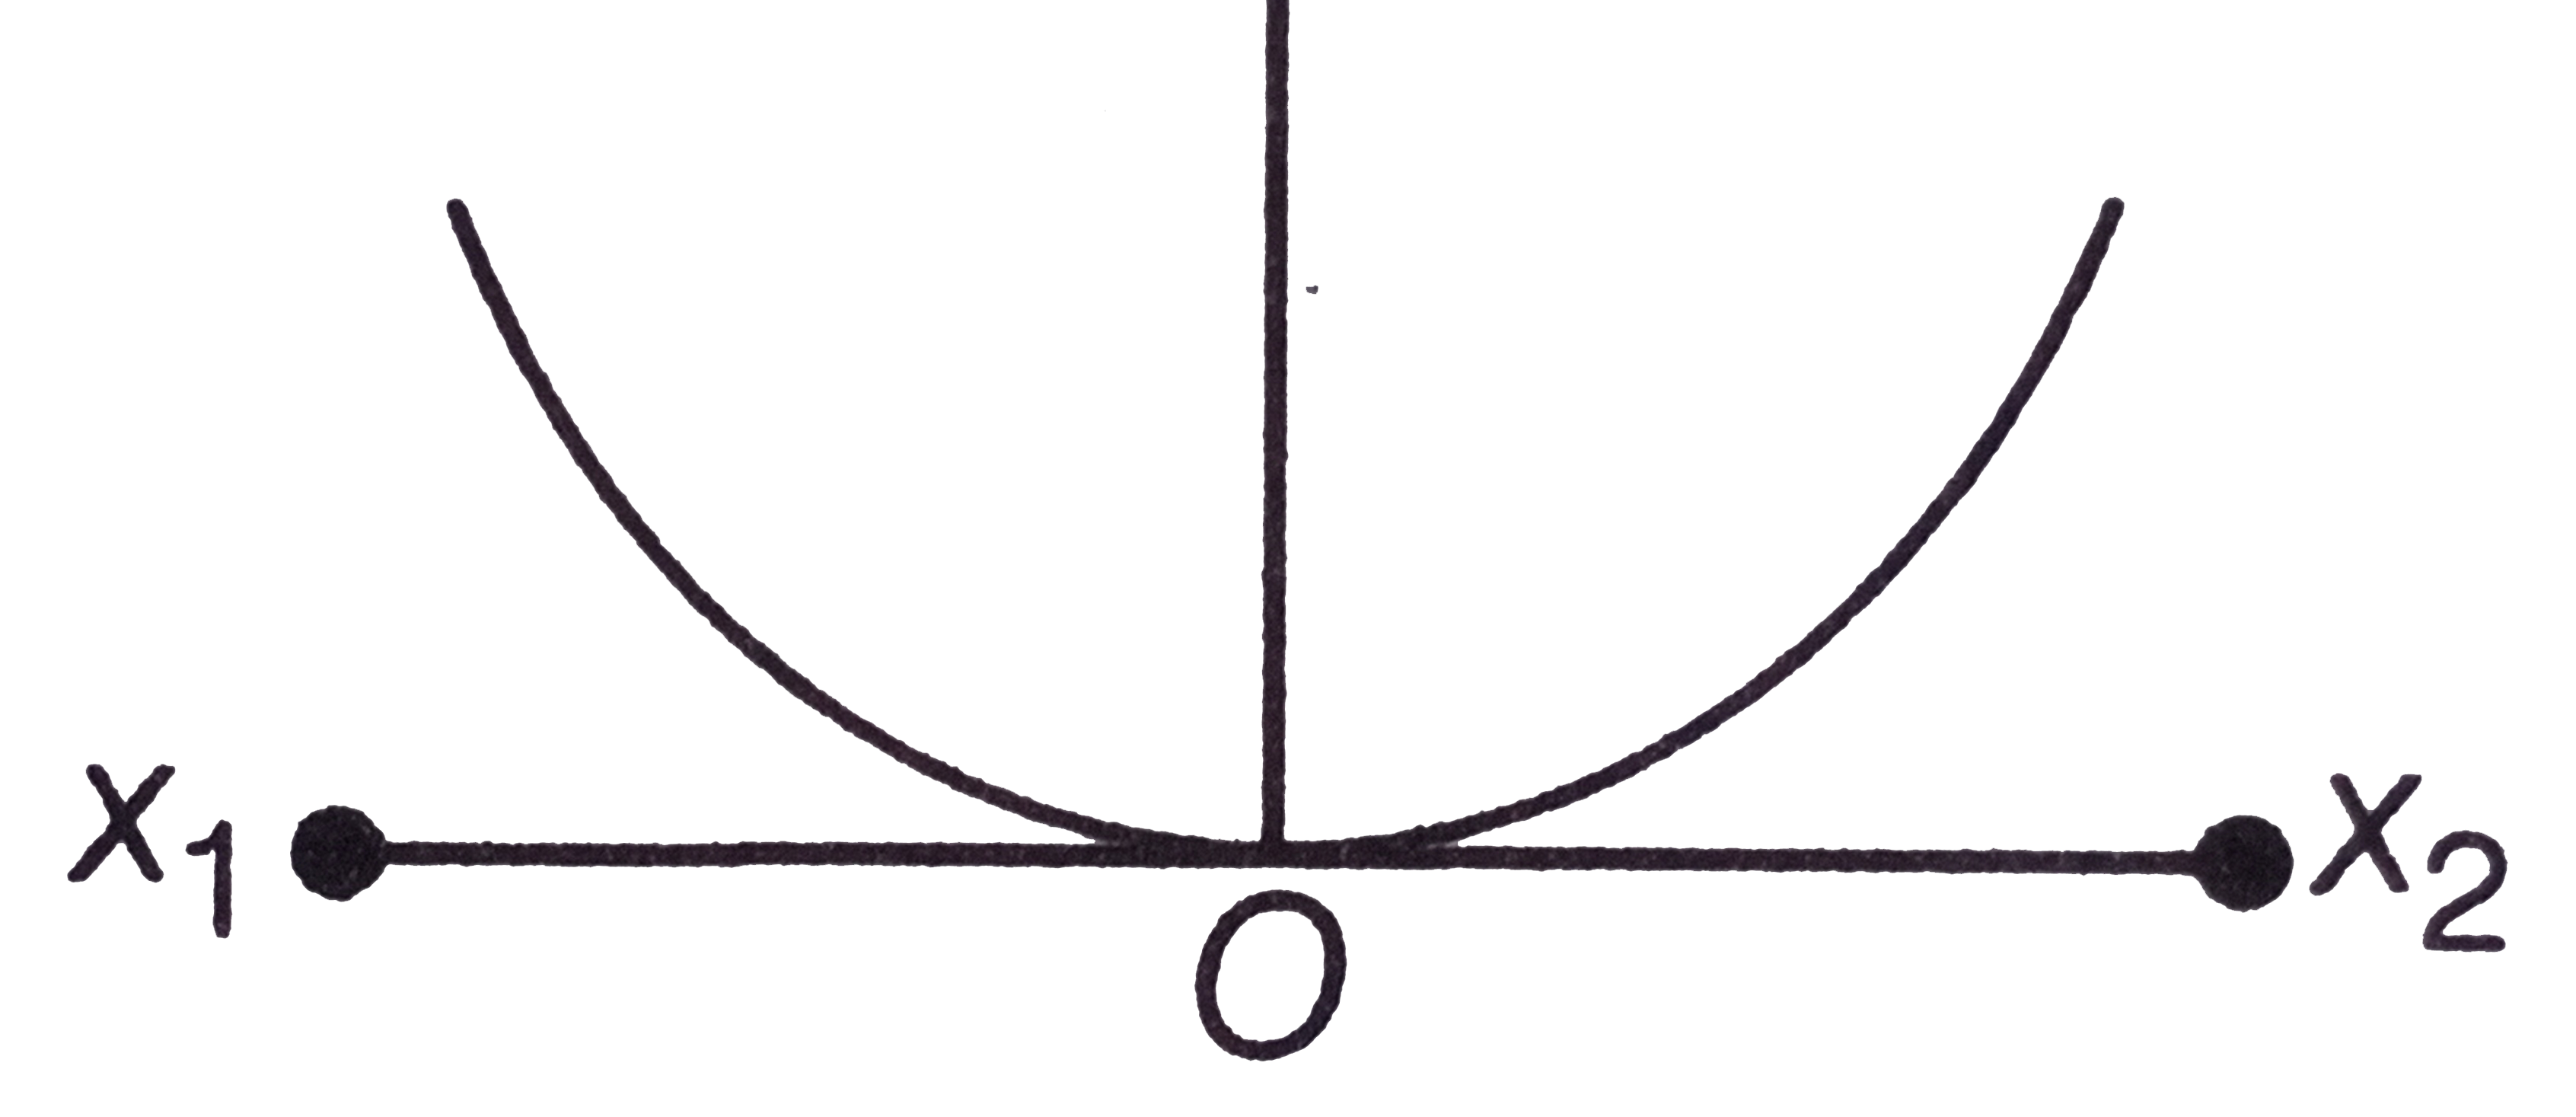
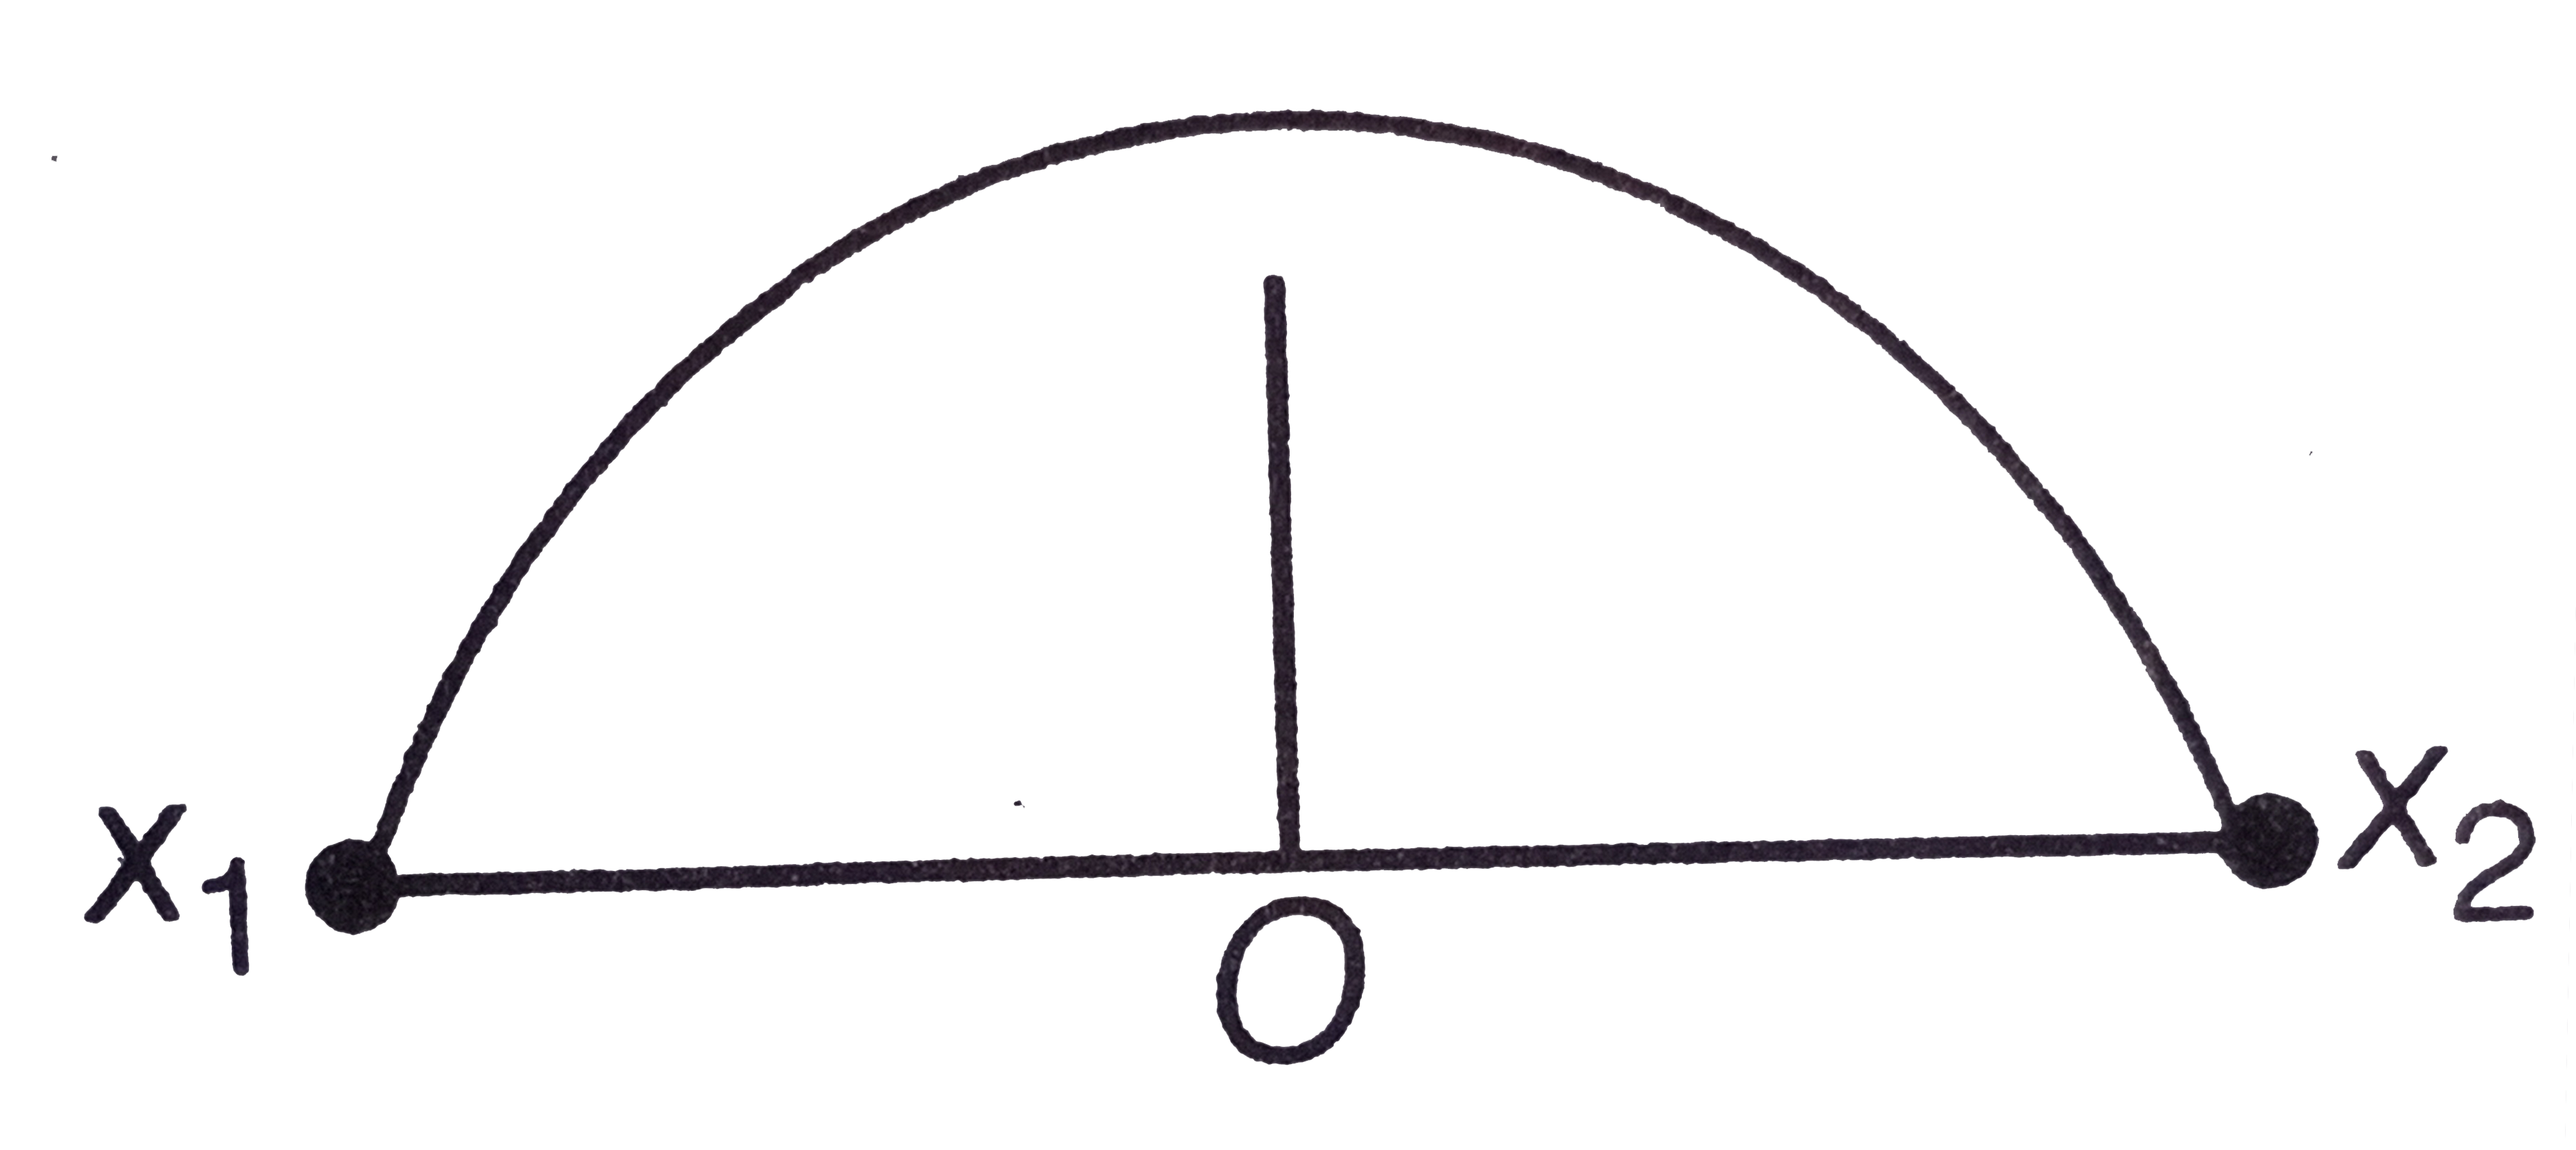
A particle of mass m oscillates with simple harmonic motion between points x1 and x2 the equilibrium position being O its potential energy in plotted it will be as given bellow in the graph


The correct Answer is:A
Potential energy is given by U=12kx2
The corresponding graph is shown in figure.

At equilibrium position (x = 0), potential energy is minimum. At extreme positions x1andx2, its potential energies are
U1=12kx21andU2=12kx22
Topper's Solved these Questions
- BOOK - MHTCET PREVIOUS YEAR PAPERS AND PRACTICE PAPERSCHAPTER - OSCILLATIONSEXERCISE - EXERCISE 249videos
OSCILLATIONS
- BOOK - MHTCET PREVIOUS YEAR PAPERS AND PRACTICE PAPERSCHAPTER - OSCILLATIONSEXERCISE - MHT CET CORNER29videos
OSCILLATIONS
- BOOK - MHTCET PREVIOUS YEAR PAPERS AND PRACTICE PAPERSCHAPTER - OSCILLATIONSEXERCISE - MHT CET CORNER29videos
OSCILLATIONS
- BOOK - MHTCET PREVIOUS YEAR PAPERS AND PRACTICE PAPERSCHAPTER - MOCK TEST 5EXERCISE - MCQs42videos
MOCK TEST 5
- BOOK - MHTCET PREVIOUS YEAR PAPERS AND PRACTICE PAPERSCHAPTER - PRACTICE SET 01EXERCISE - PAPER 1 (PHYSICS & CHEMISTRY)50videos
PRACTICE SET 01
Similar Questions
The potential energy of a particle, executing a simple harmonic motion, at a dis"tan"ce x from the equilibrium position is proportional to
View SolutionA particle executes simple harmonic motion of ampliltude A. At what distance from the mean position is its kinetic energy equal to its potential energy?
View Solution
Knowledge Check
- Question 1 - Select One
A particle of mass m oscillates with simple harmonic motion between points x1 and x2, the equilibrium position being O. Its potential energy is plotted. It will be as given below in the graph
A B
B C
C D
D
- Question 2 - Select One
A particle of mass m oscillates with simple harmonic motion between two points x1 and x2 the equilibrium position being O its potential energy is plotted on the graph which of the following curve represents the phenomenon?
A B
B C
C D
D
- Question 3 - Select One
A particle of mass m oscillates with simple harmonic motion between two points x1 and x2 the equilibrium position being O its potential energy is plotted on the graph which of the following curve represents the phenomenon?
A B
B C
C D
D
A particle oscillates simple harmonic motion with a period of 16s. Two second after crossing the equilibrium position its velocity becomes 1m/s. The amplitude is
View SolutionA particle is executing simple harmonic motion between exterme positions given by (−1,−2,−3)cm and (1,2,1)cm. Its amplitude of oscillation is
View SolutionA particle is vibrating in a simple harmonic motion with an amplitude of 4 cm . At what displacement from the equilibrium position, is its energy half potential and half kinetic
View SolutionA particle starts oscillating simple harmonically from its equilibrium position then, the ration of kinetic energy and potential energy of the particle at the time T/12 is: (T=time period)
View SolutionA body is executing a simple harmonic motion such that its potential energy is U1at U2aty When the displacement is x+y the potential energy will be
View Solution

