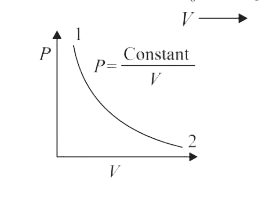
Consider p_V diagram for an ideal gas shown in figure
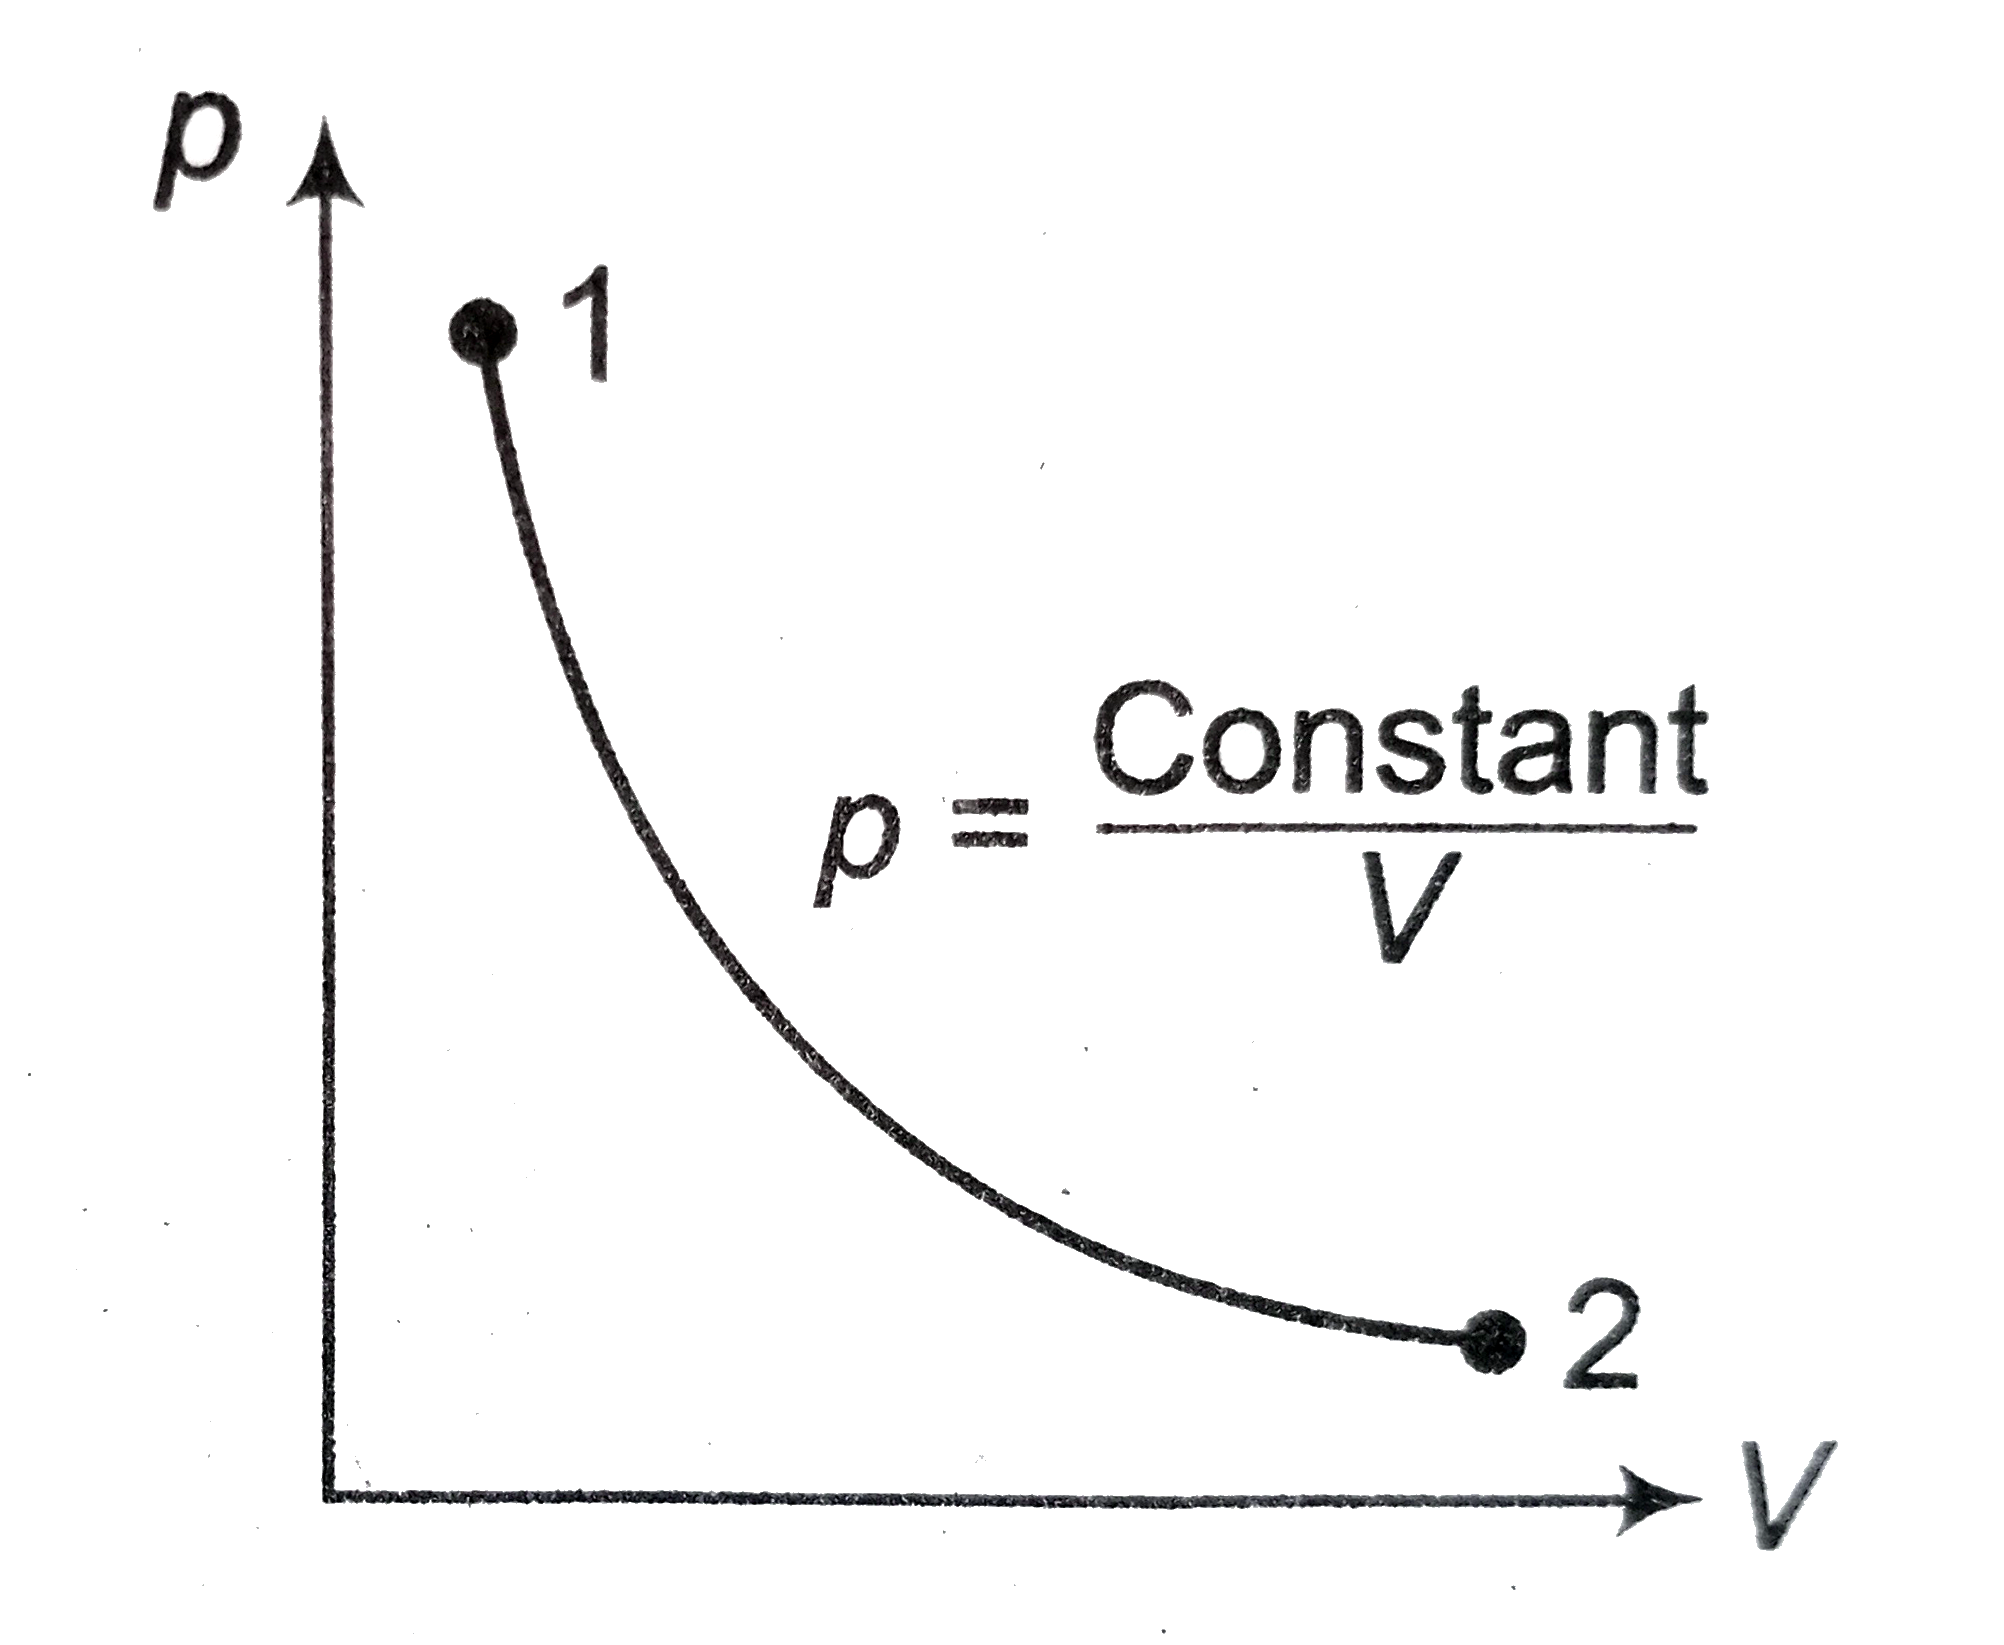
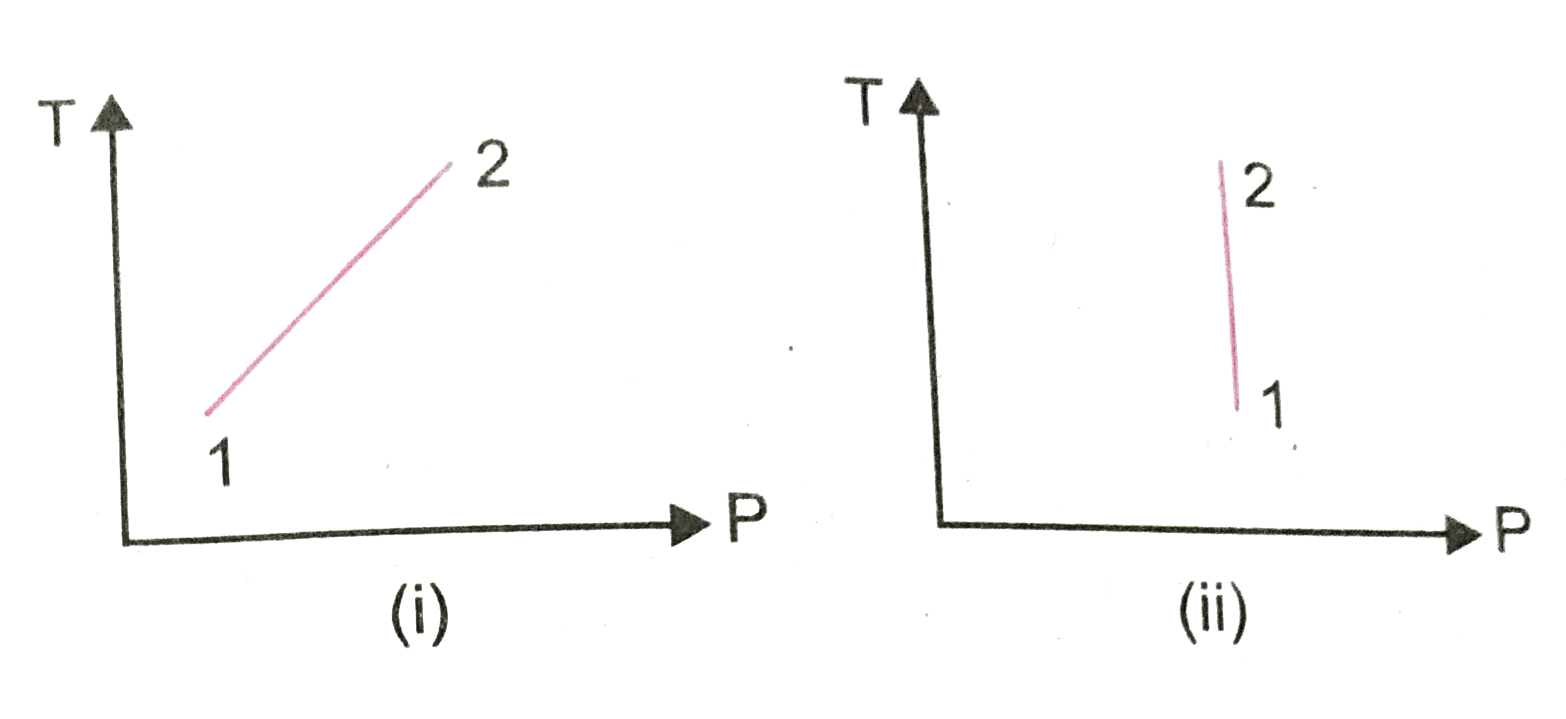
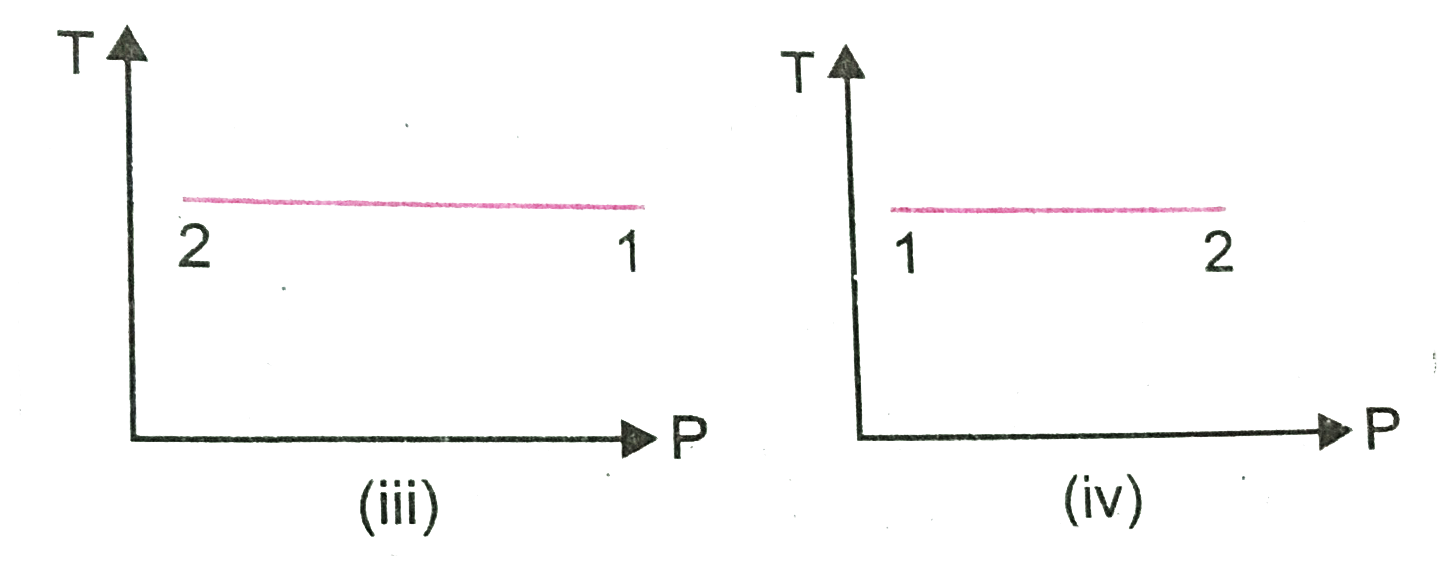
Out of the following diagrams which represents the T-p diagram ?
A
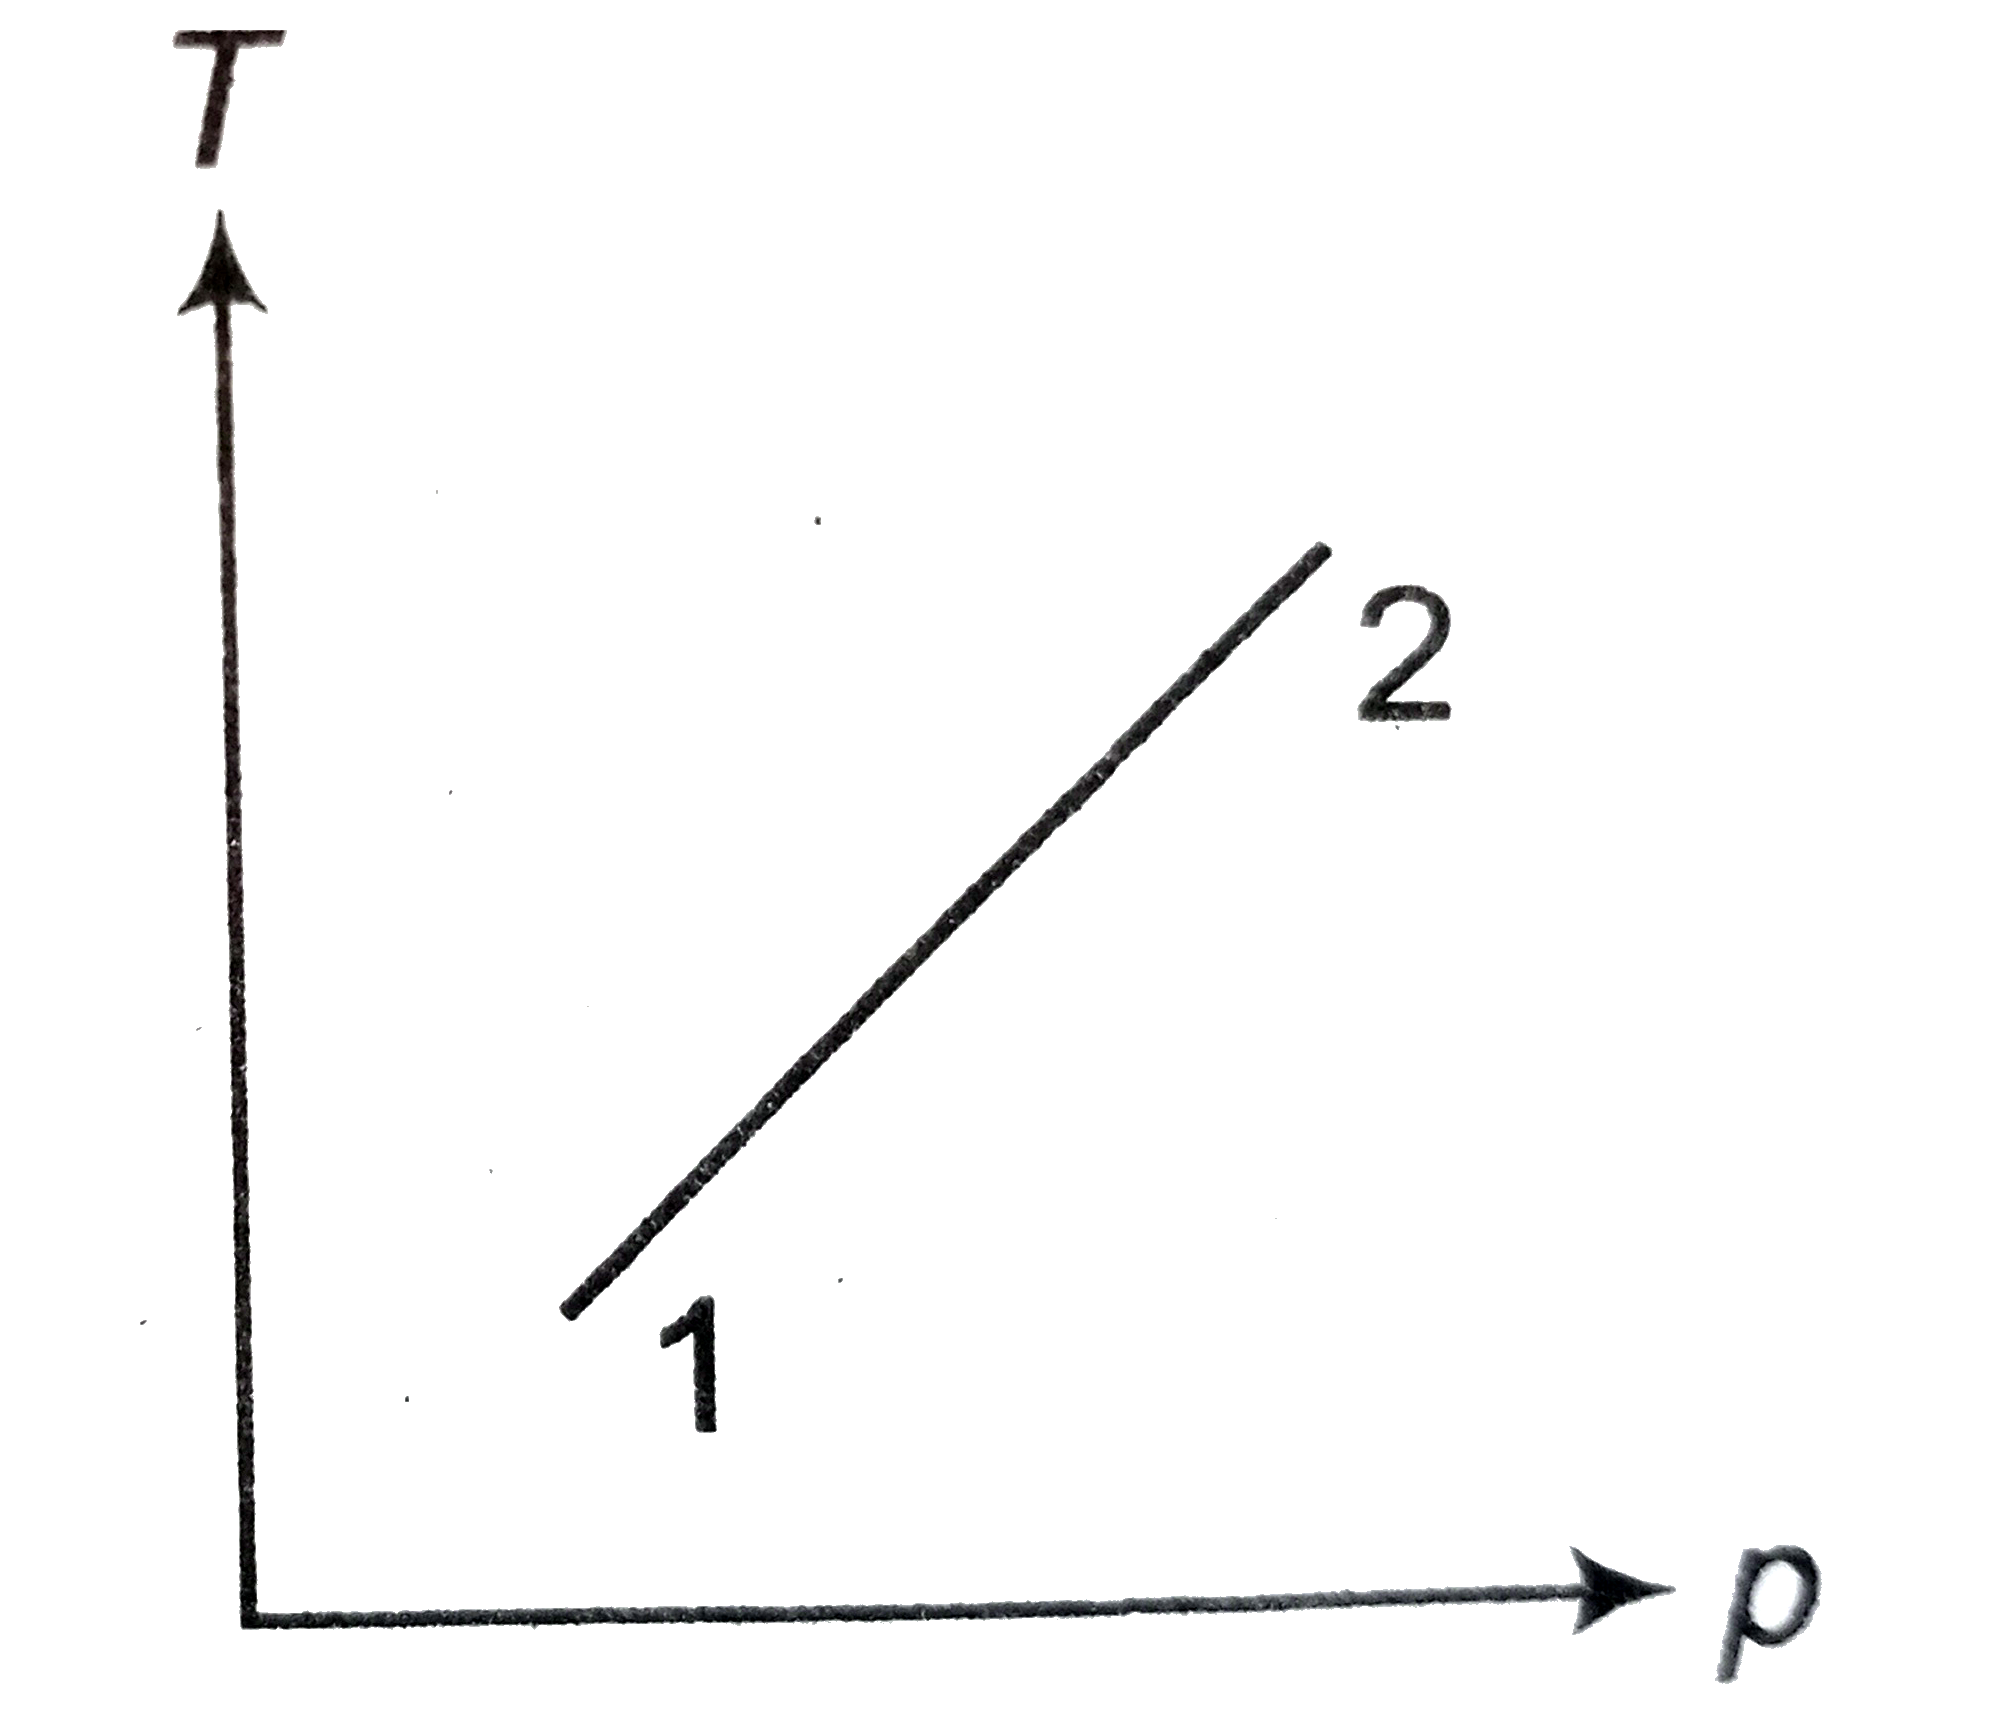
B
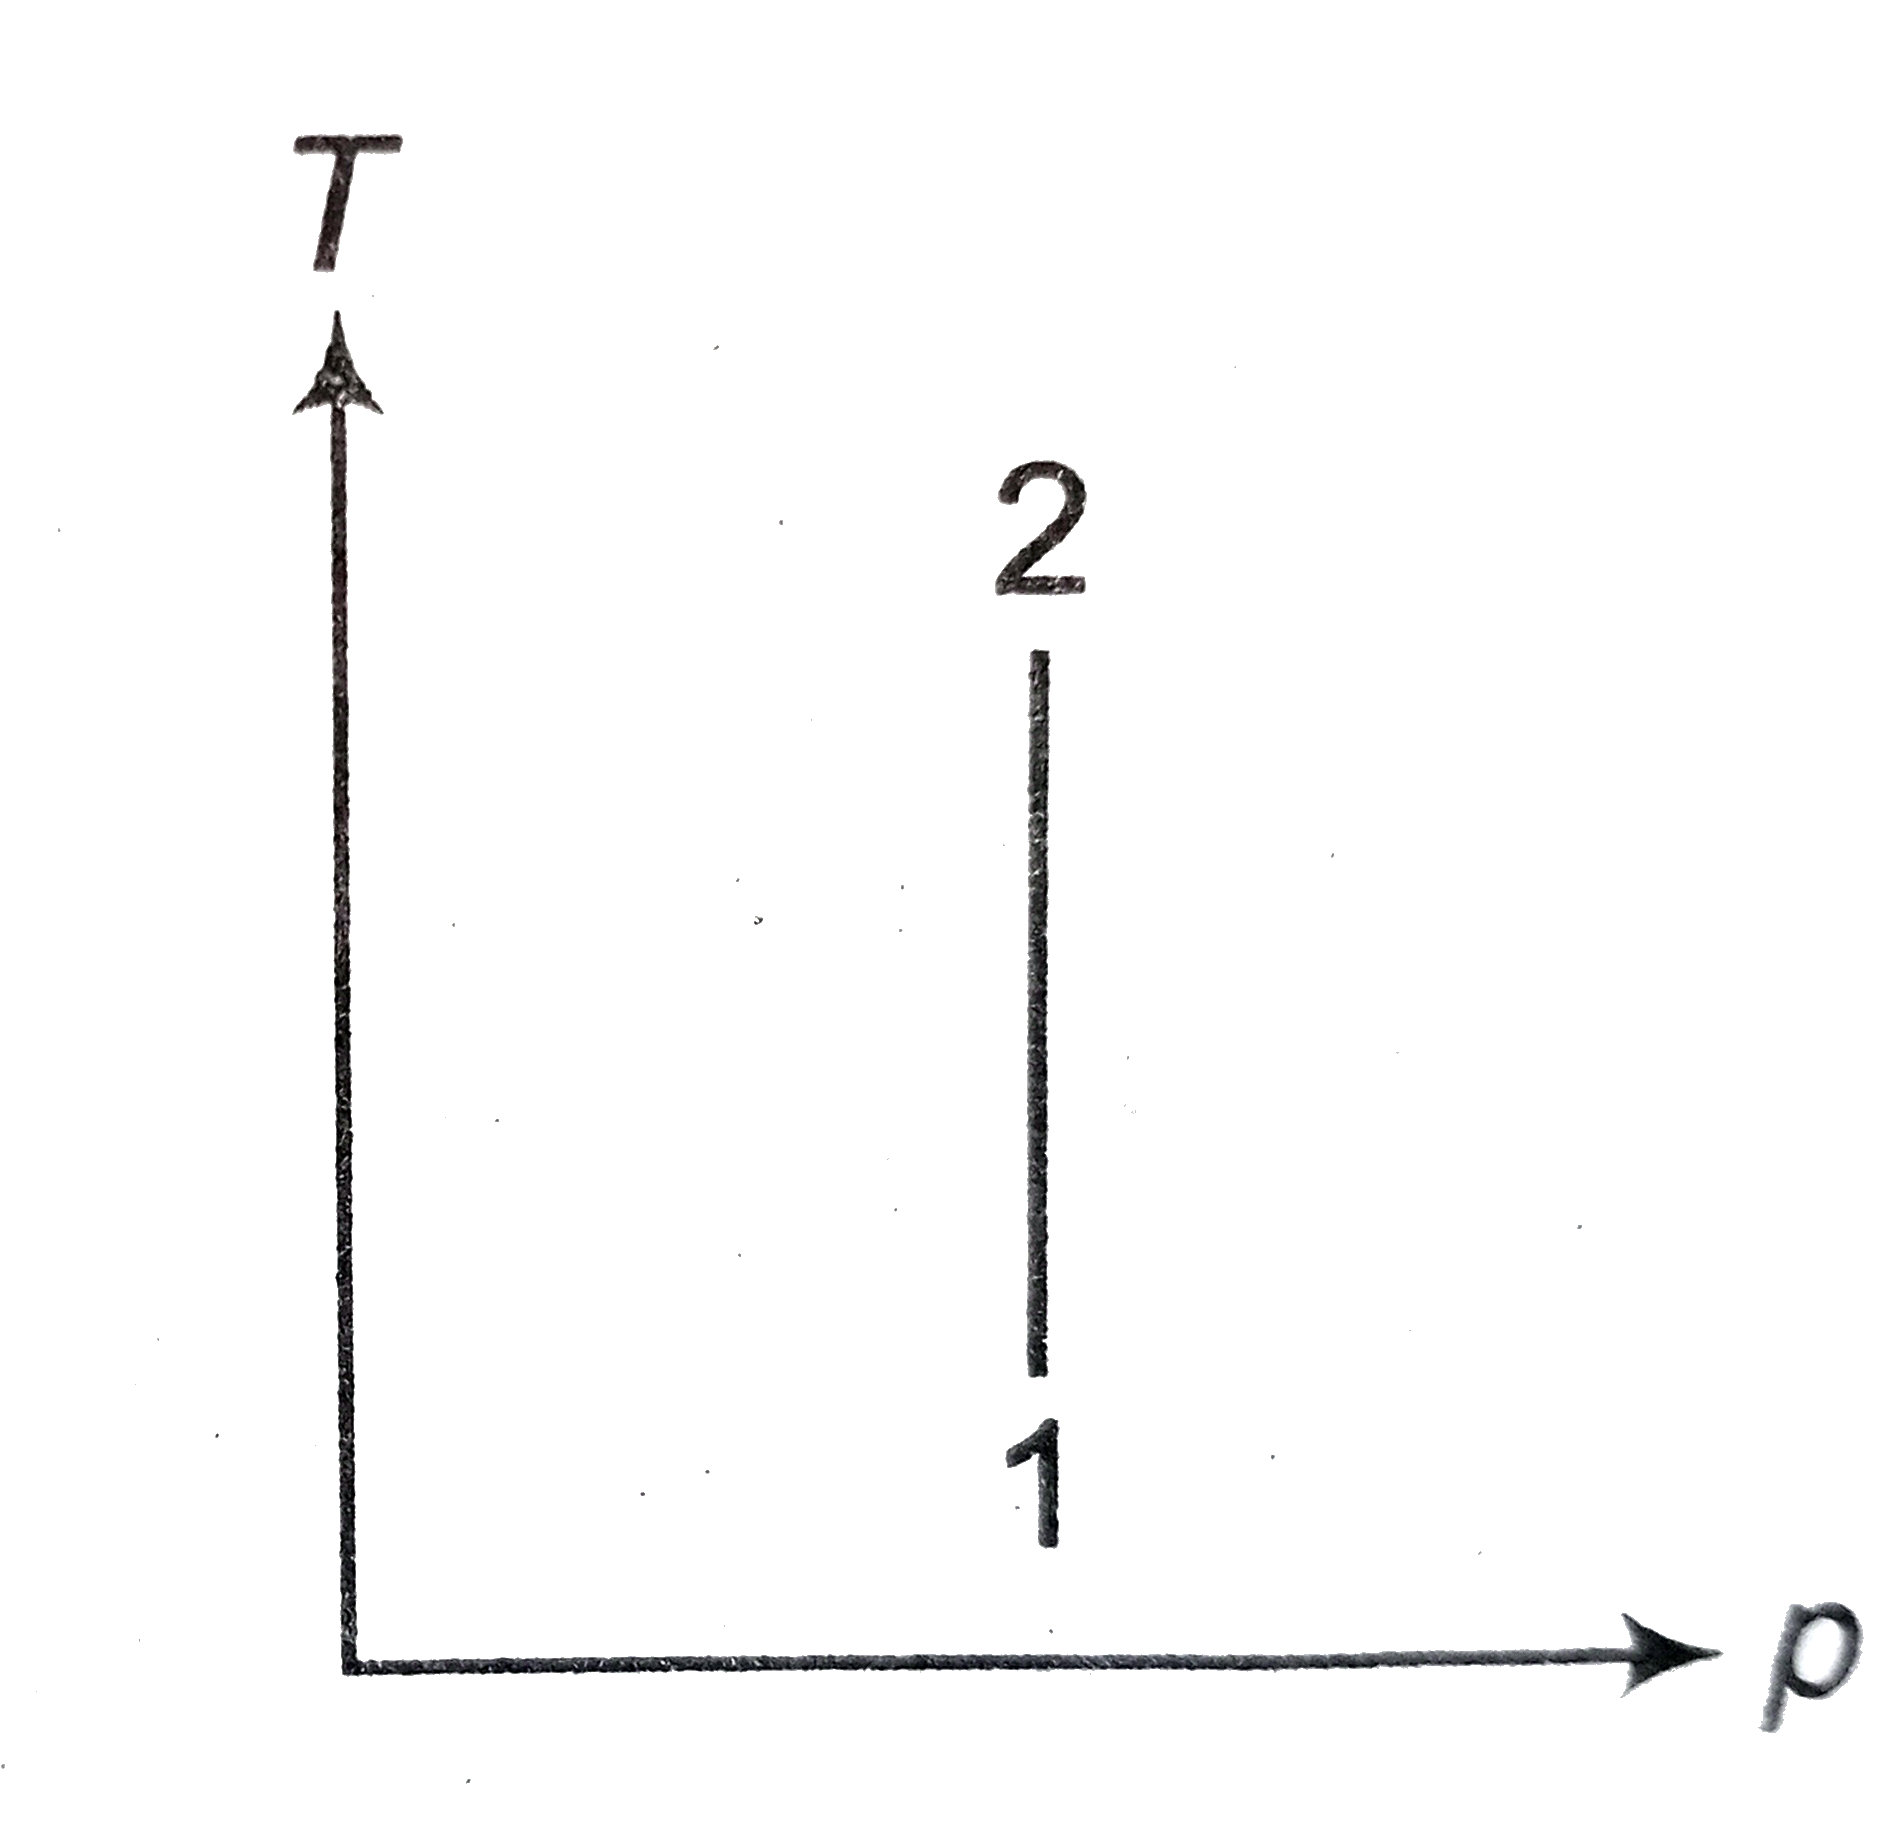
C
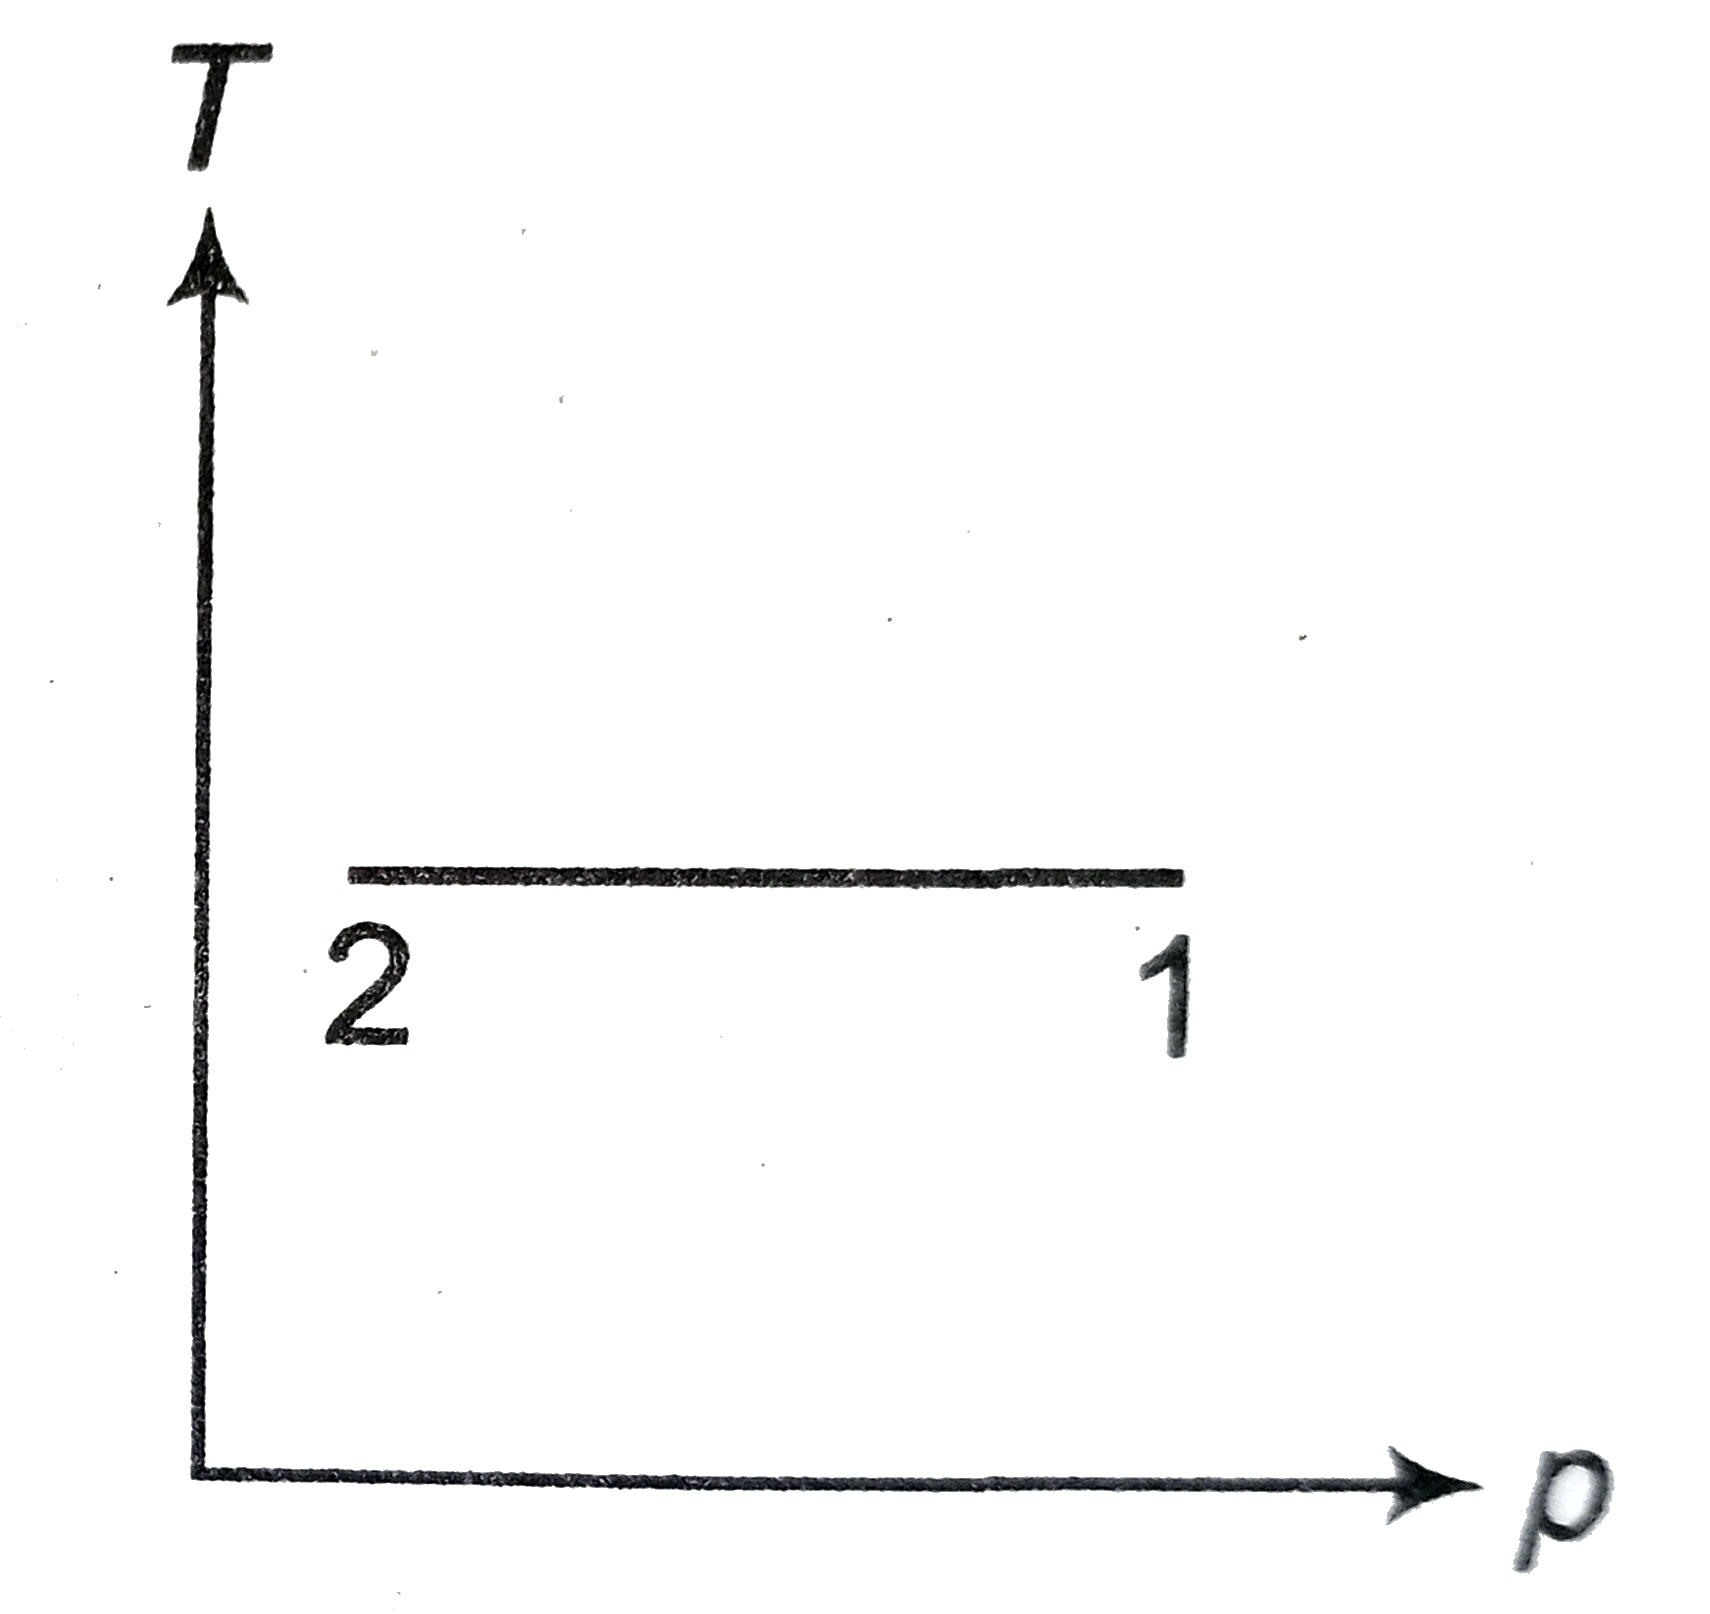
D
Text Solution
The correct Answer is:C
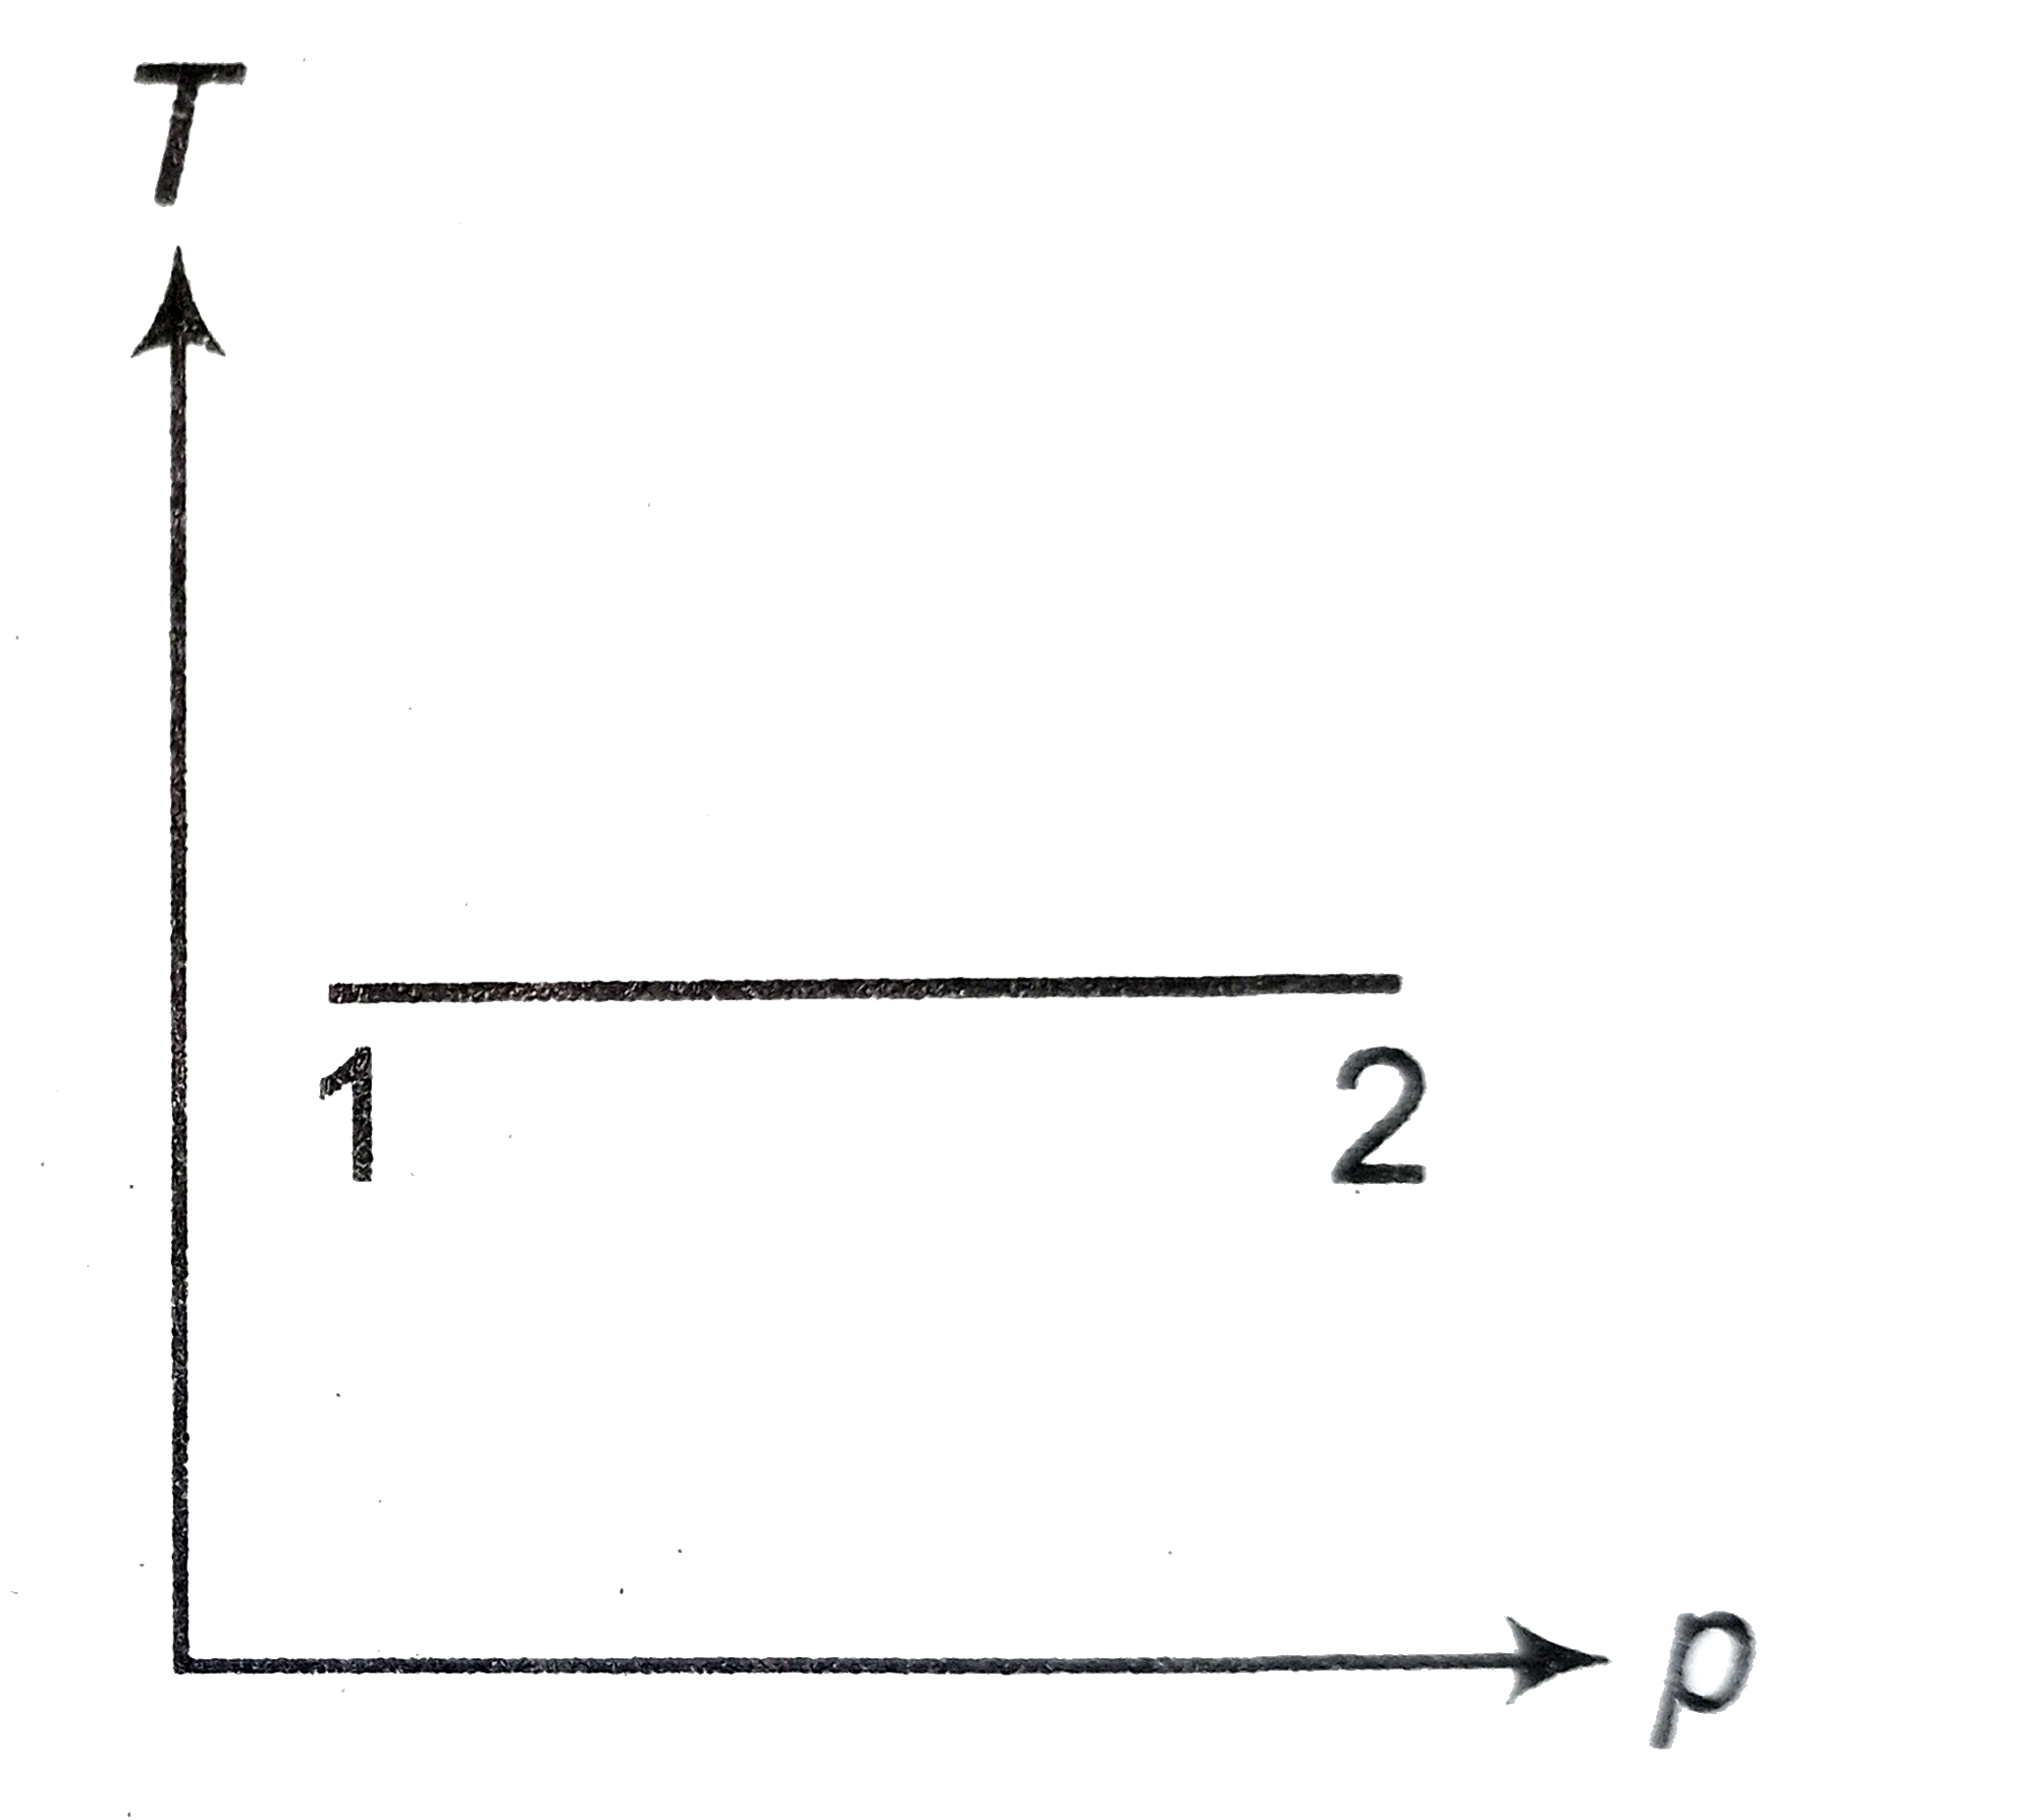
In the diagram , T is constant and p1>p2 . This situation is represented by curve (iii) . In the solution figure . In which p1>p2 and straight line parallel to pressure axis represents constant temperature.
|
Topper's Solved these Questions
- KINETIC THEORY OF GASES ANDRADIATIONBOOK - MHTCET PREVIOUS YEAR PAPERS AND PRACTICE PAPERSCHAPTER - KINETIC THEORY OF GASES ANDRADIATIONEXERCISE - MHT CET Corner
40 Videos
- KINETIC THEORY OF GASES ANDRADIATIONBOOK - MHTCET PREVIOUS YEAR PAPERS AND PRACTICE PAPERSCHAPTER - KINETIC THEORY OF GASES ANDRADIATIONEXERCISE - Exercise 1
132 Videos
- INTERFERENCE AND DIFFRACTION OF LIGHT BOOK - MHTCET PREVIOUS YEAR PAPERS AND PRACTICE PAPERSCHAPTER - INTERFERENCE AND DIFFRACTION OF LIGHT EXERCISE - MHT CET Corner
24 Videos
- MAGNETIC EFFECT OF ELECTRIC CURRENTBOOK - MHTCET PREVIOUS YEAR PAPERS AND PRACTICE PAPERSCHAPTER - MAGNETIC EFFECT OF ELECTRIC CURRENTEXERCISE - MHT CET CORNER
20 Videos
Similar Questions
Knowledge Check
The P-V diagram for an ideal gas is shown in figure.
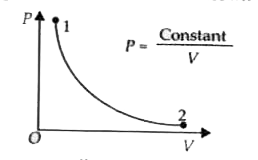
Out of the following diagrams which one represents the T-P diagram ?A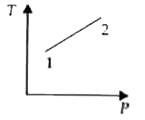 B
B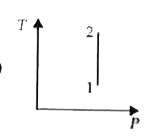 C
C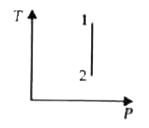 D
D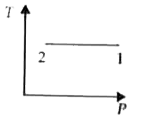
Consider p-V diagram for an ideal gas shown in figure.
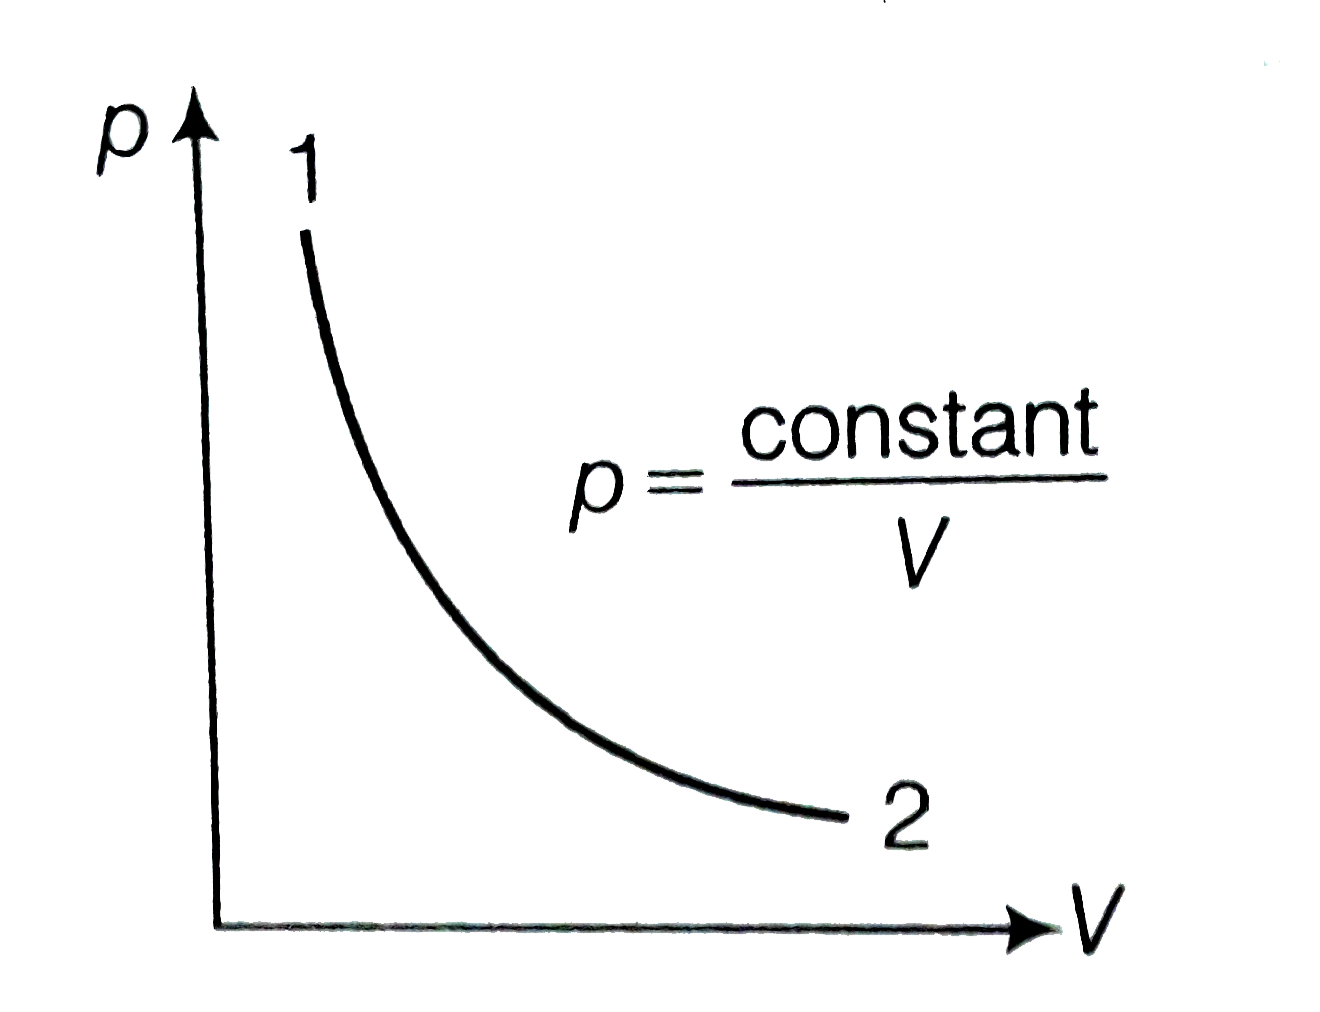
Out of the following diagrams, which figure represents the T−p diagram ?
(i)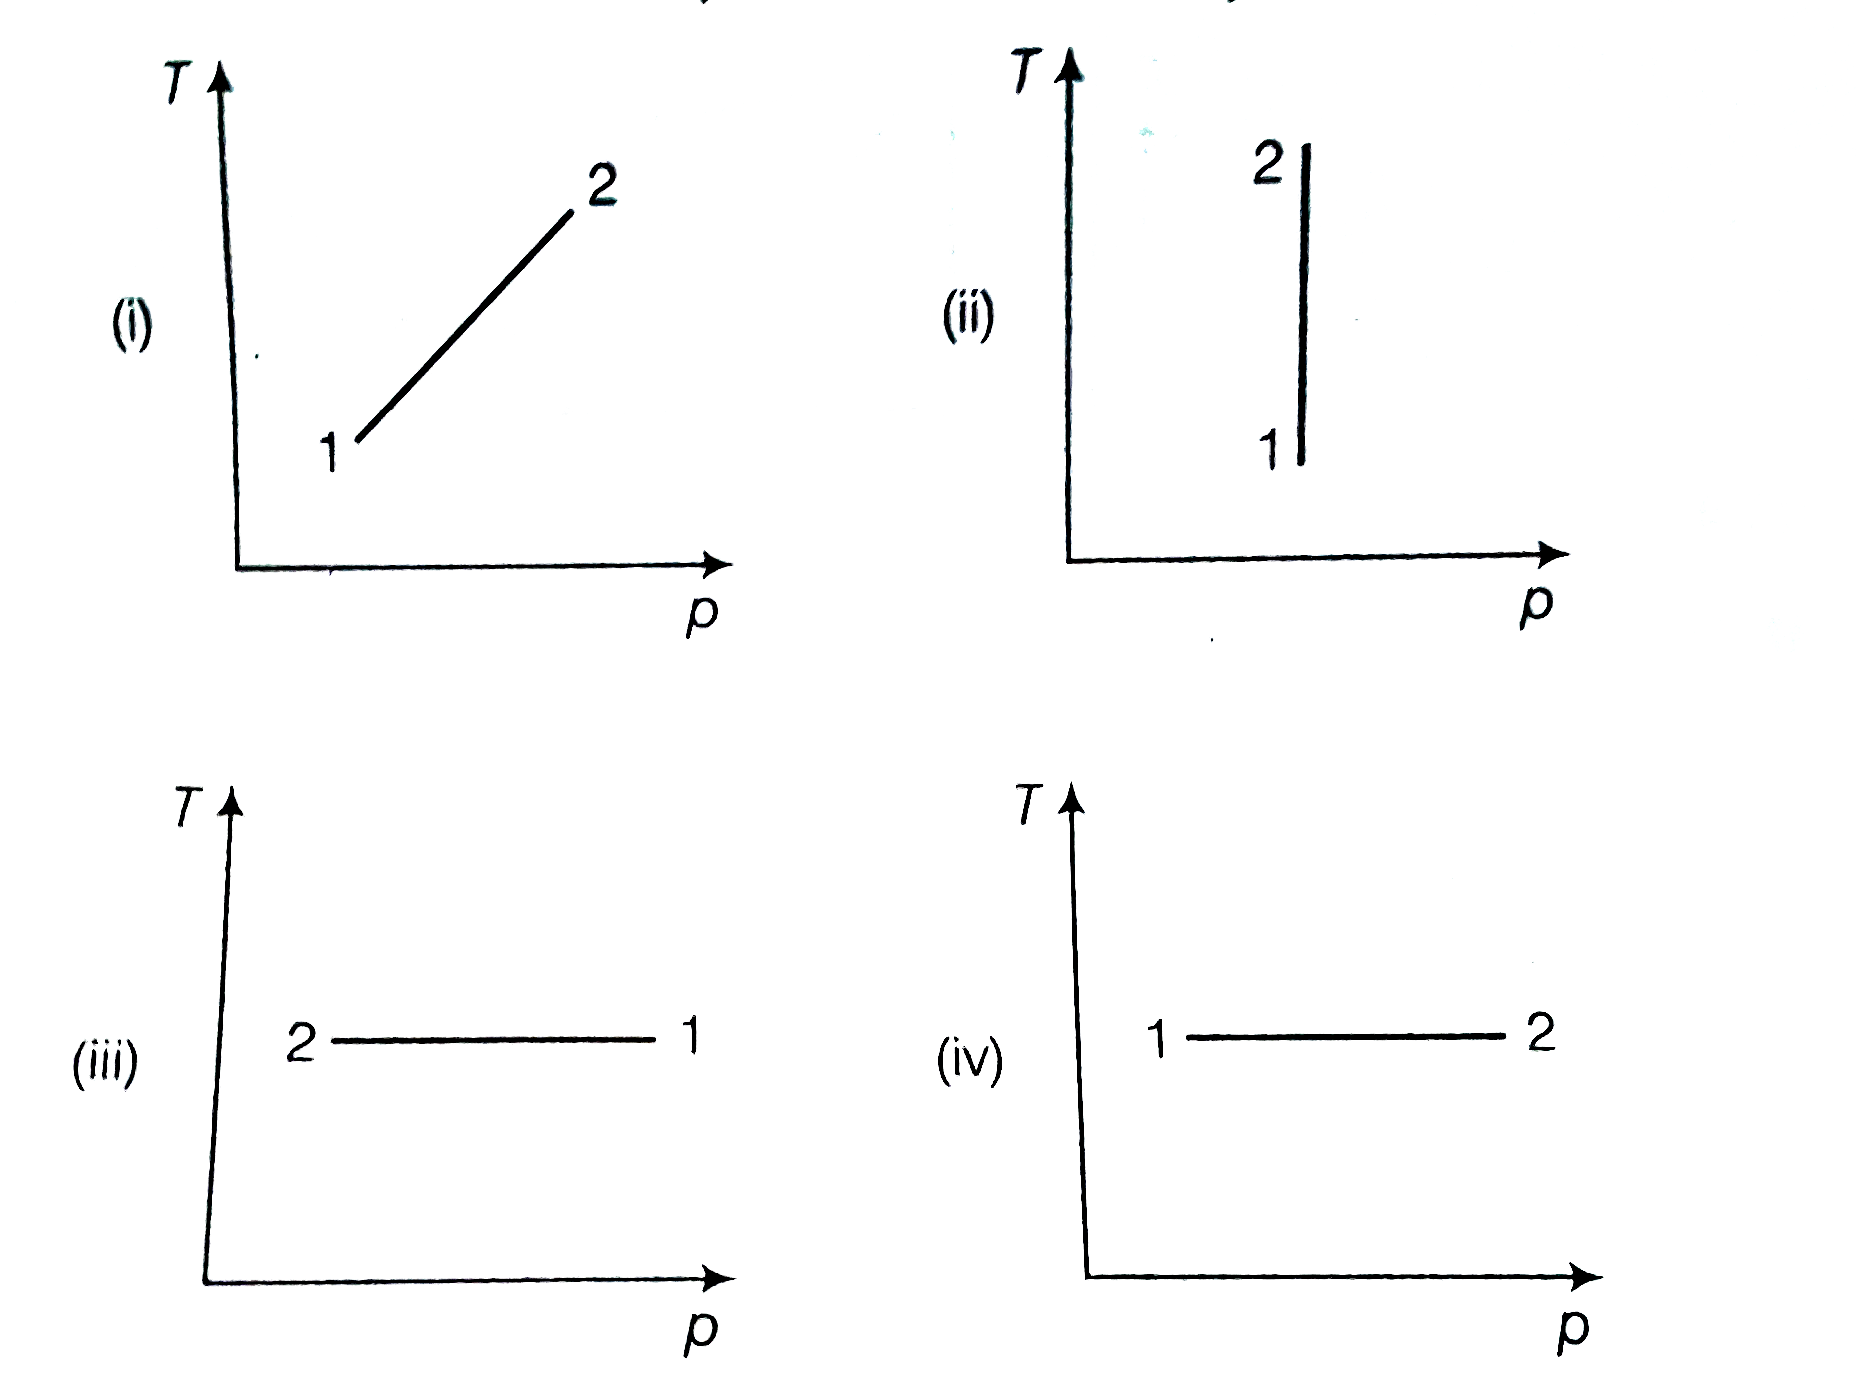 A(iv)B(ii)C(iii)D(i)
Consider p-V diagram for an ideal gas shown in figure.
Out of the following diagrams, which figure represents the T−p diagram ?
(i) A(iv)B(ii)C(iii)D(i)
P-V diagram of an ideal gas is as shown in figure. Work done by the gas in the process ABCD is

View SolutionConsider P−V diagram for an ideal gas shown in figure.
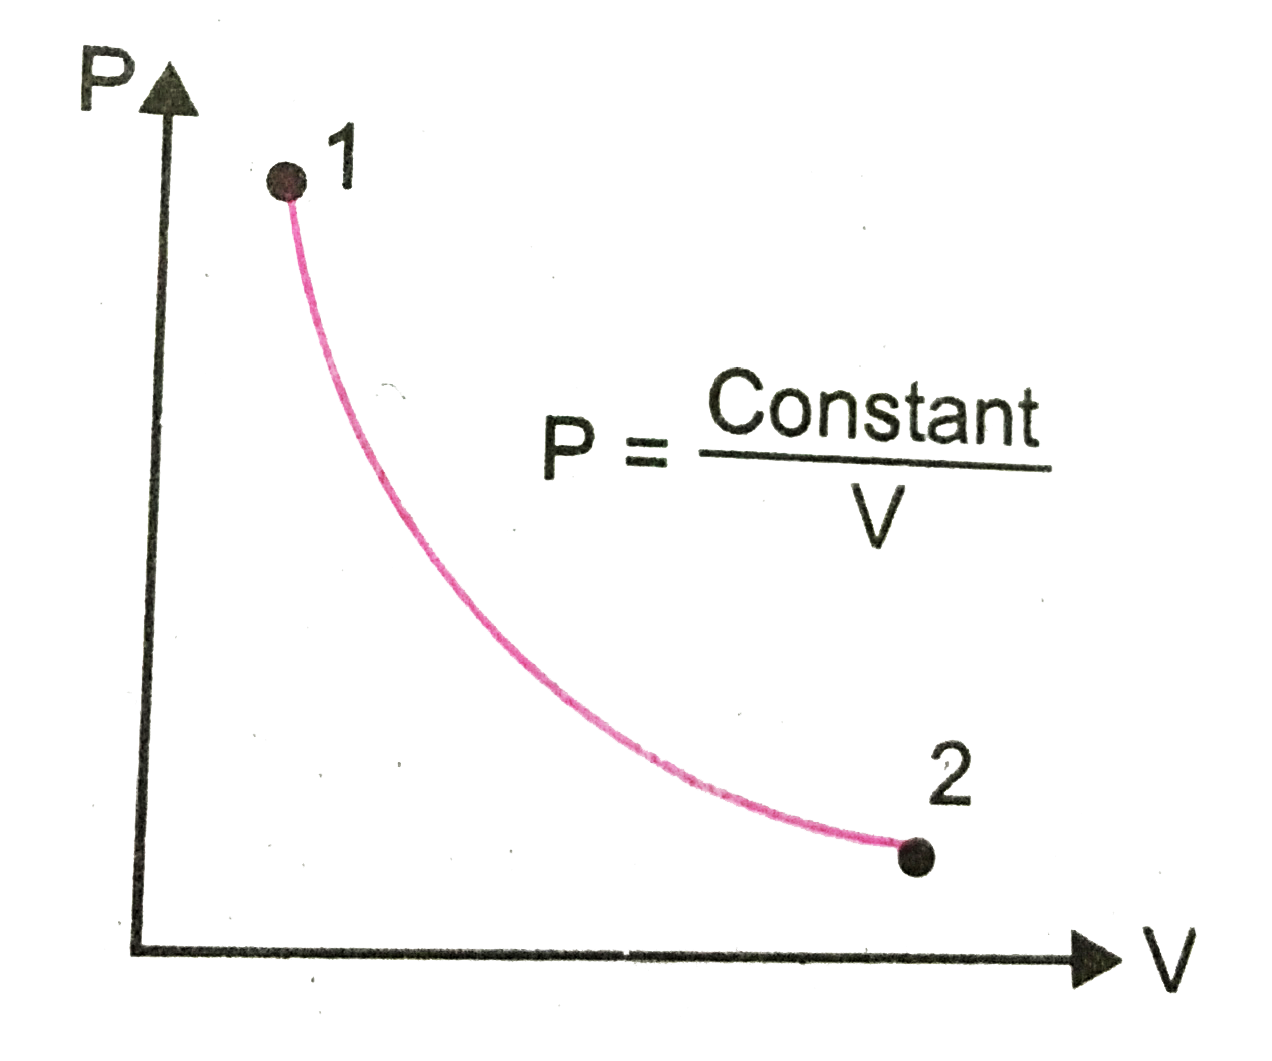
Out of following diagrams(figure). Which represents the T−P diagram?
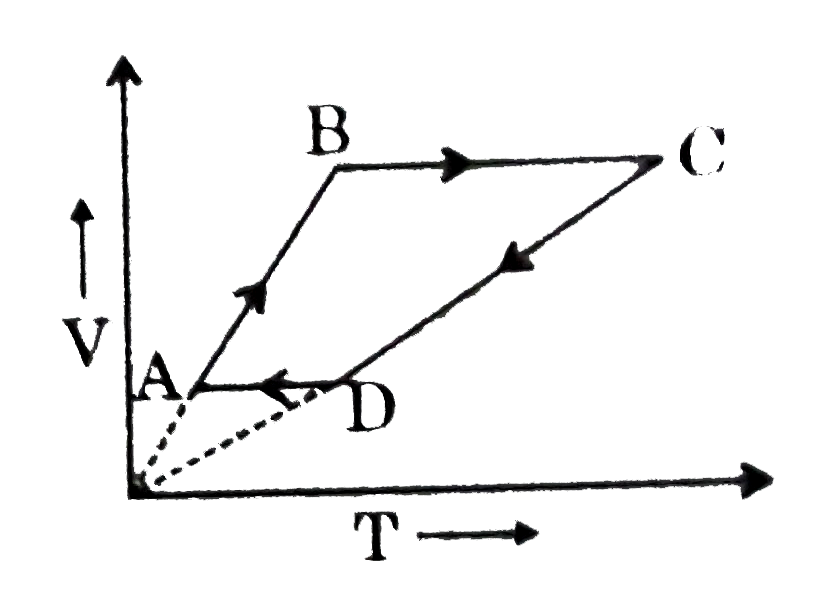
View SolutionA cyclic process ABCD is shown in VT diagram for an ideal gas. Which of the following diagram represents the same process ?
View SolutionFor the diagram given for an ideal gas, out of the following which one correctly represent the diagram?
View SolutionWhich of the following p-V diagrams best represents an isothermal process ?
View Solution
