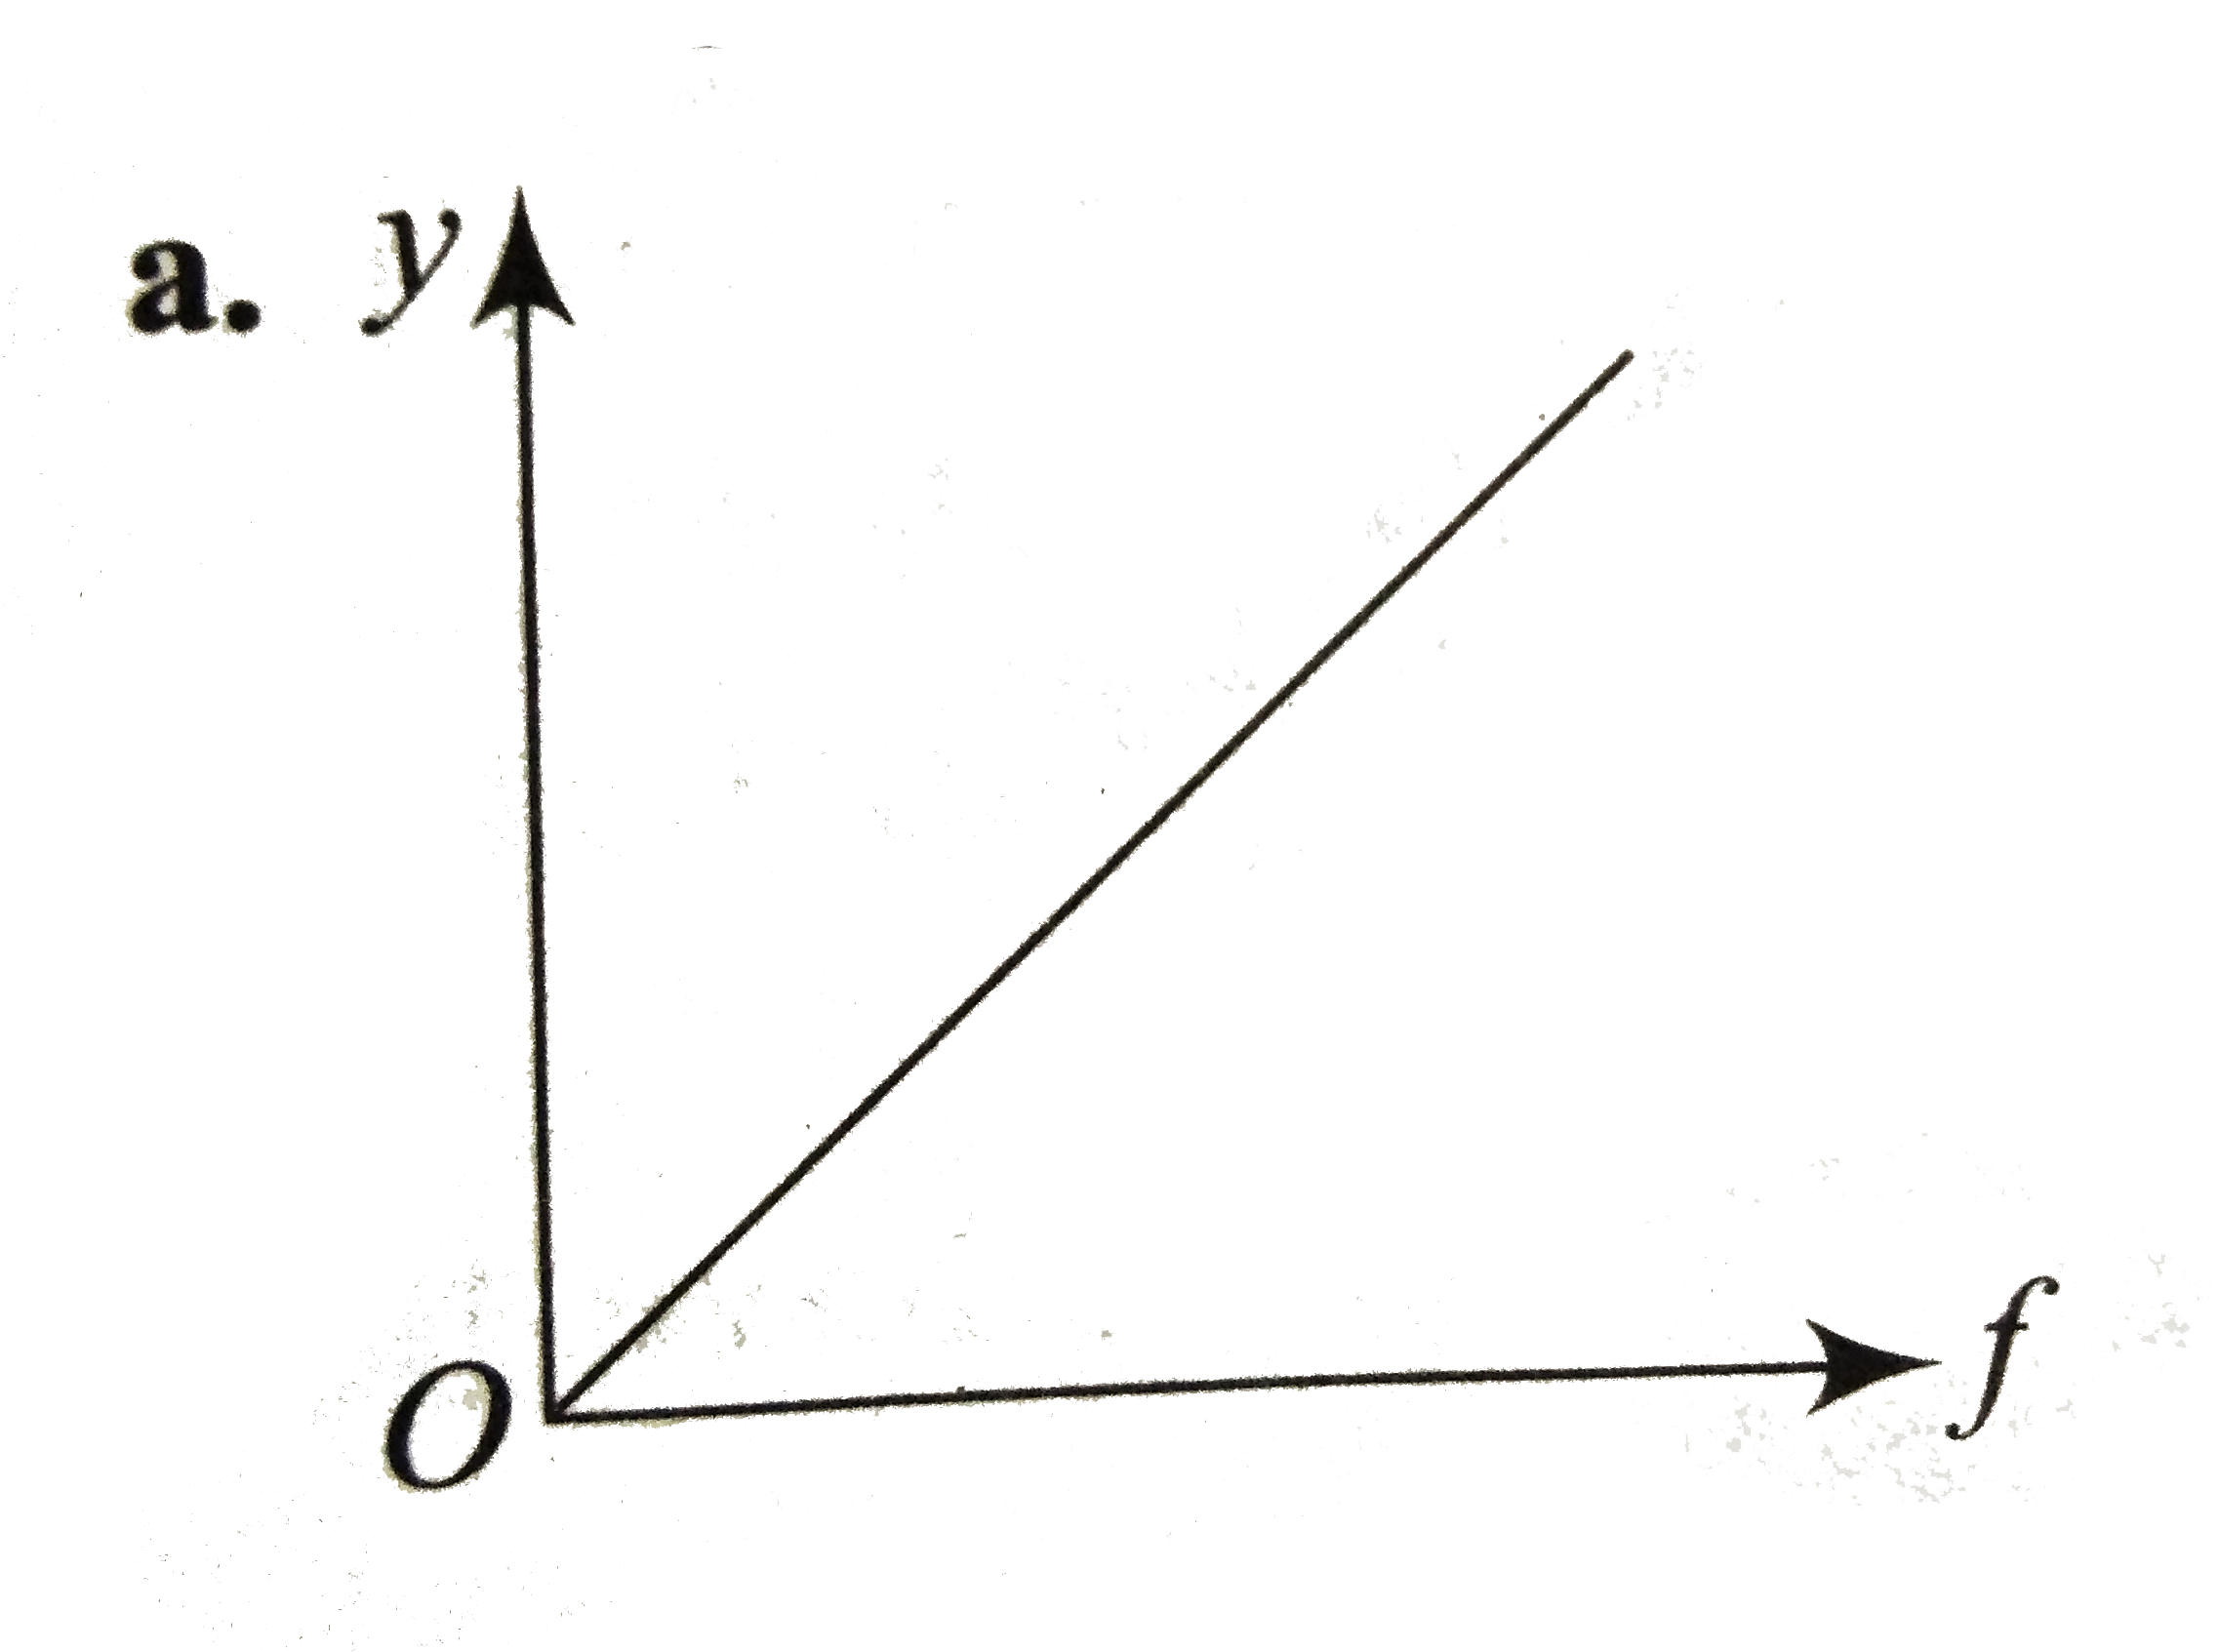
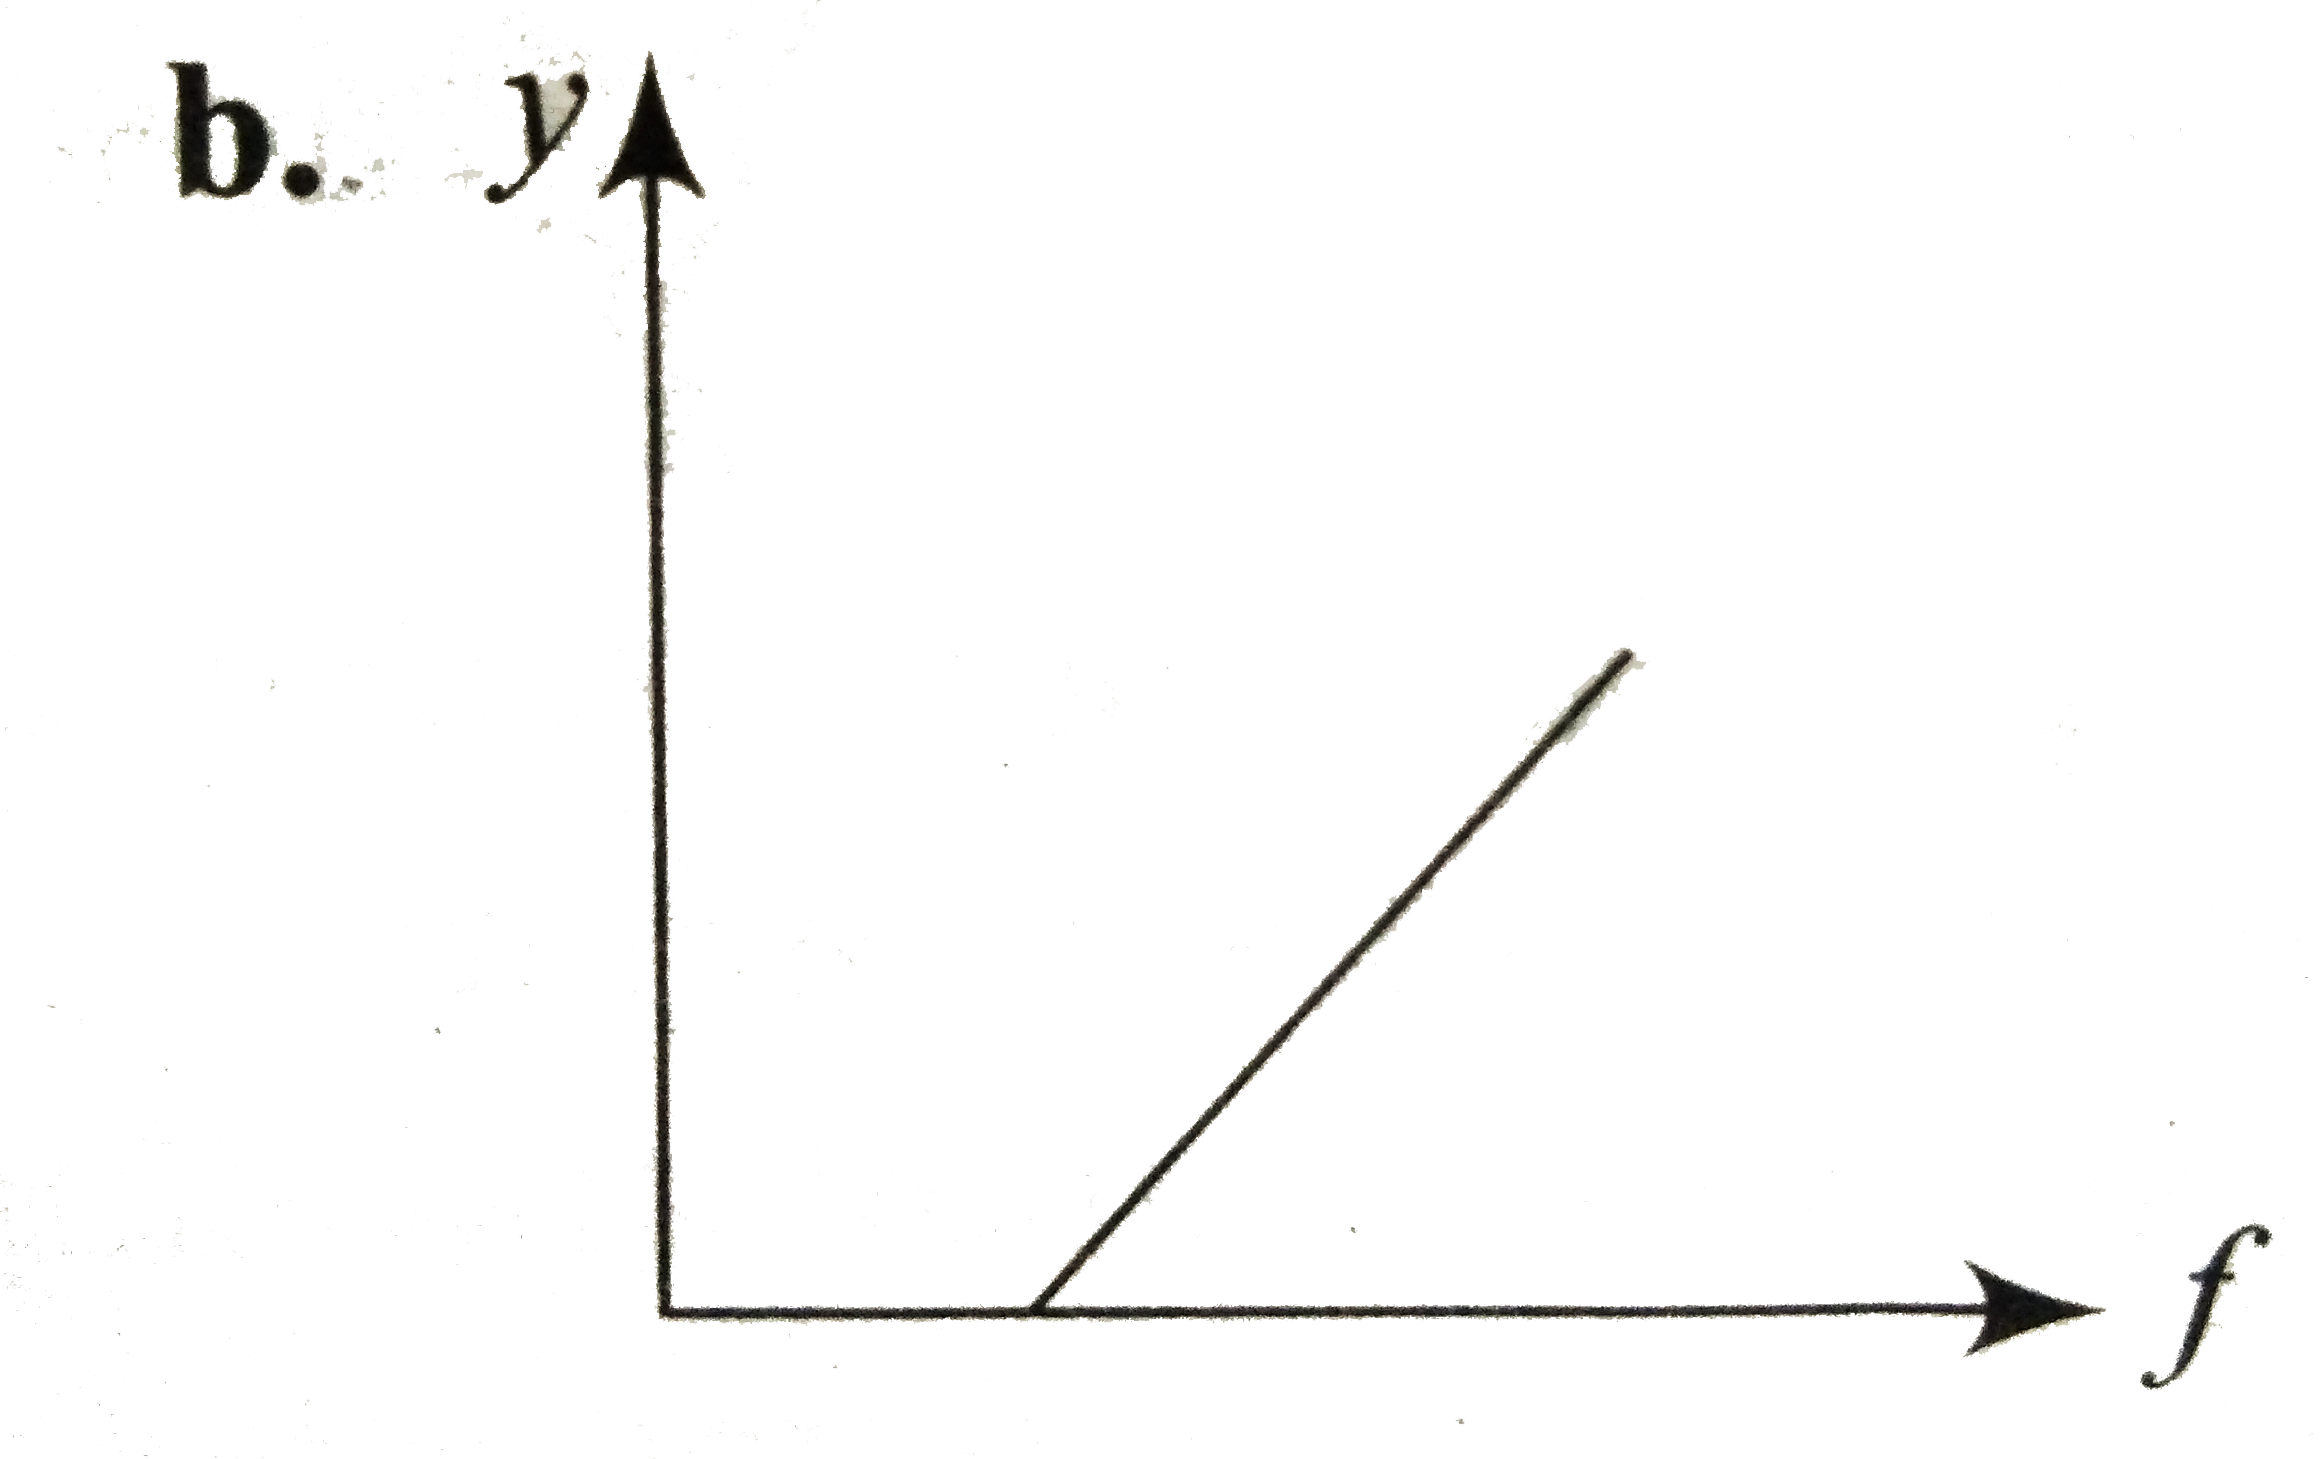
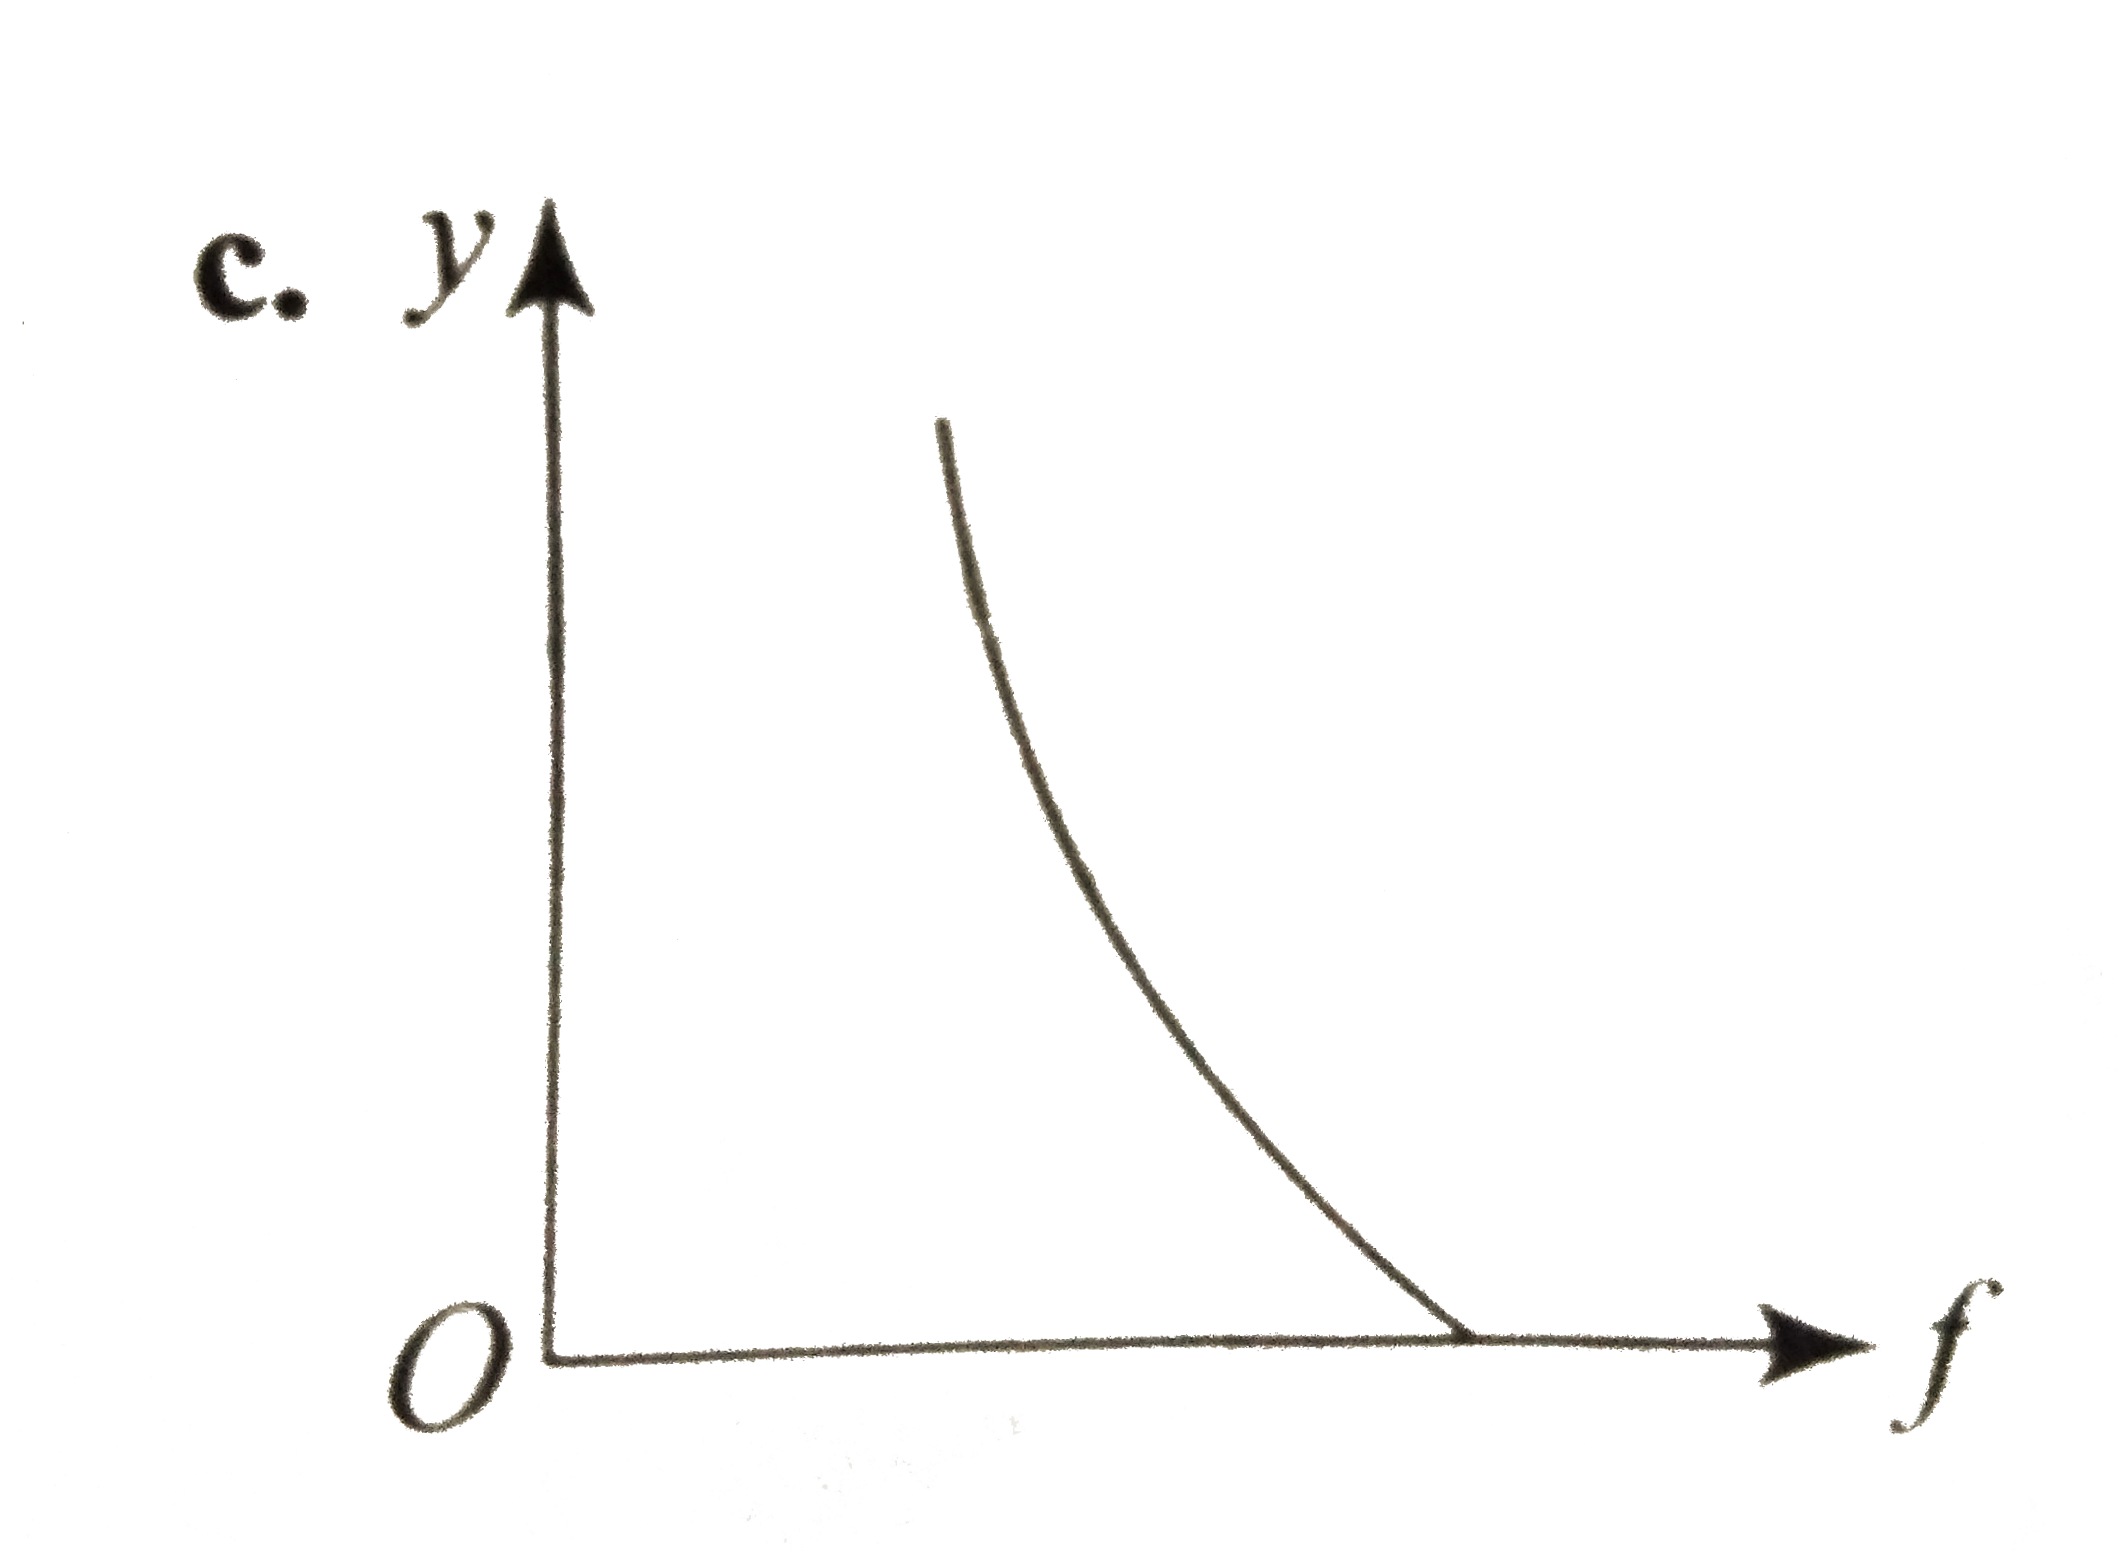
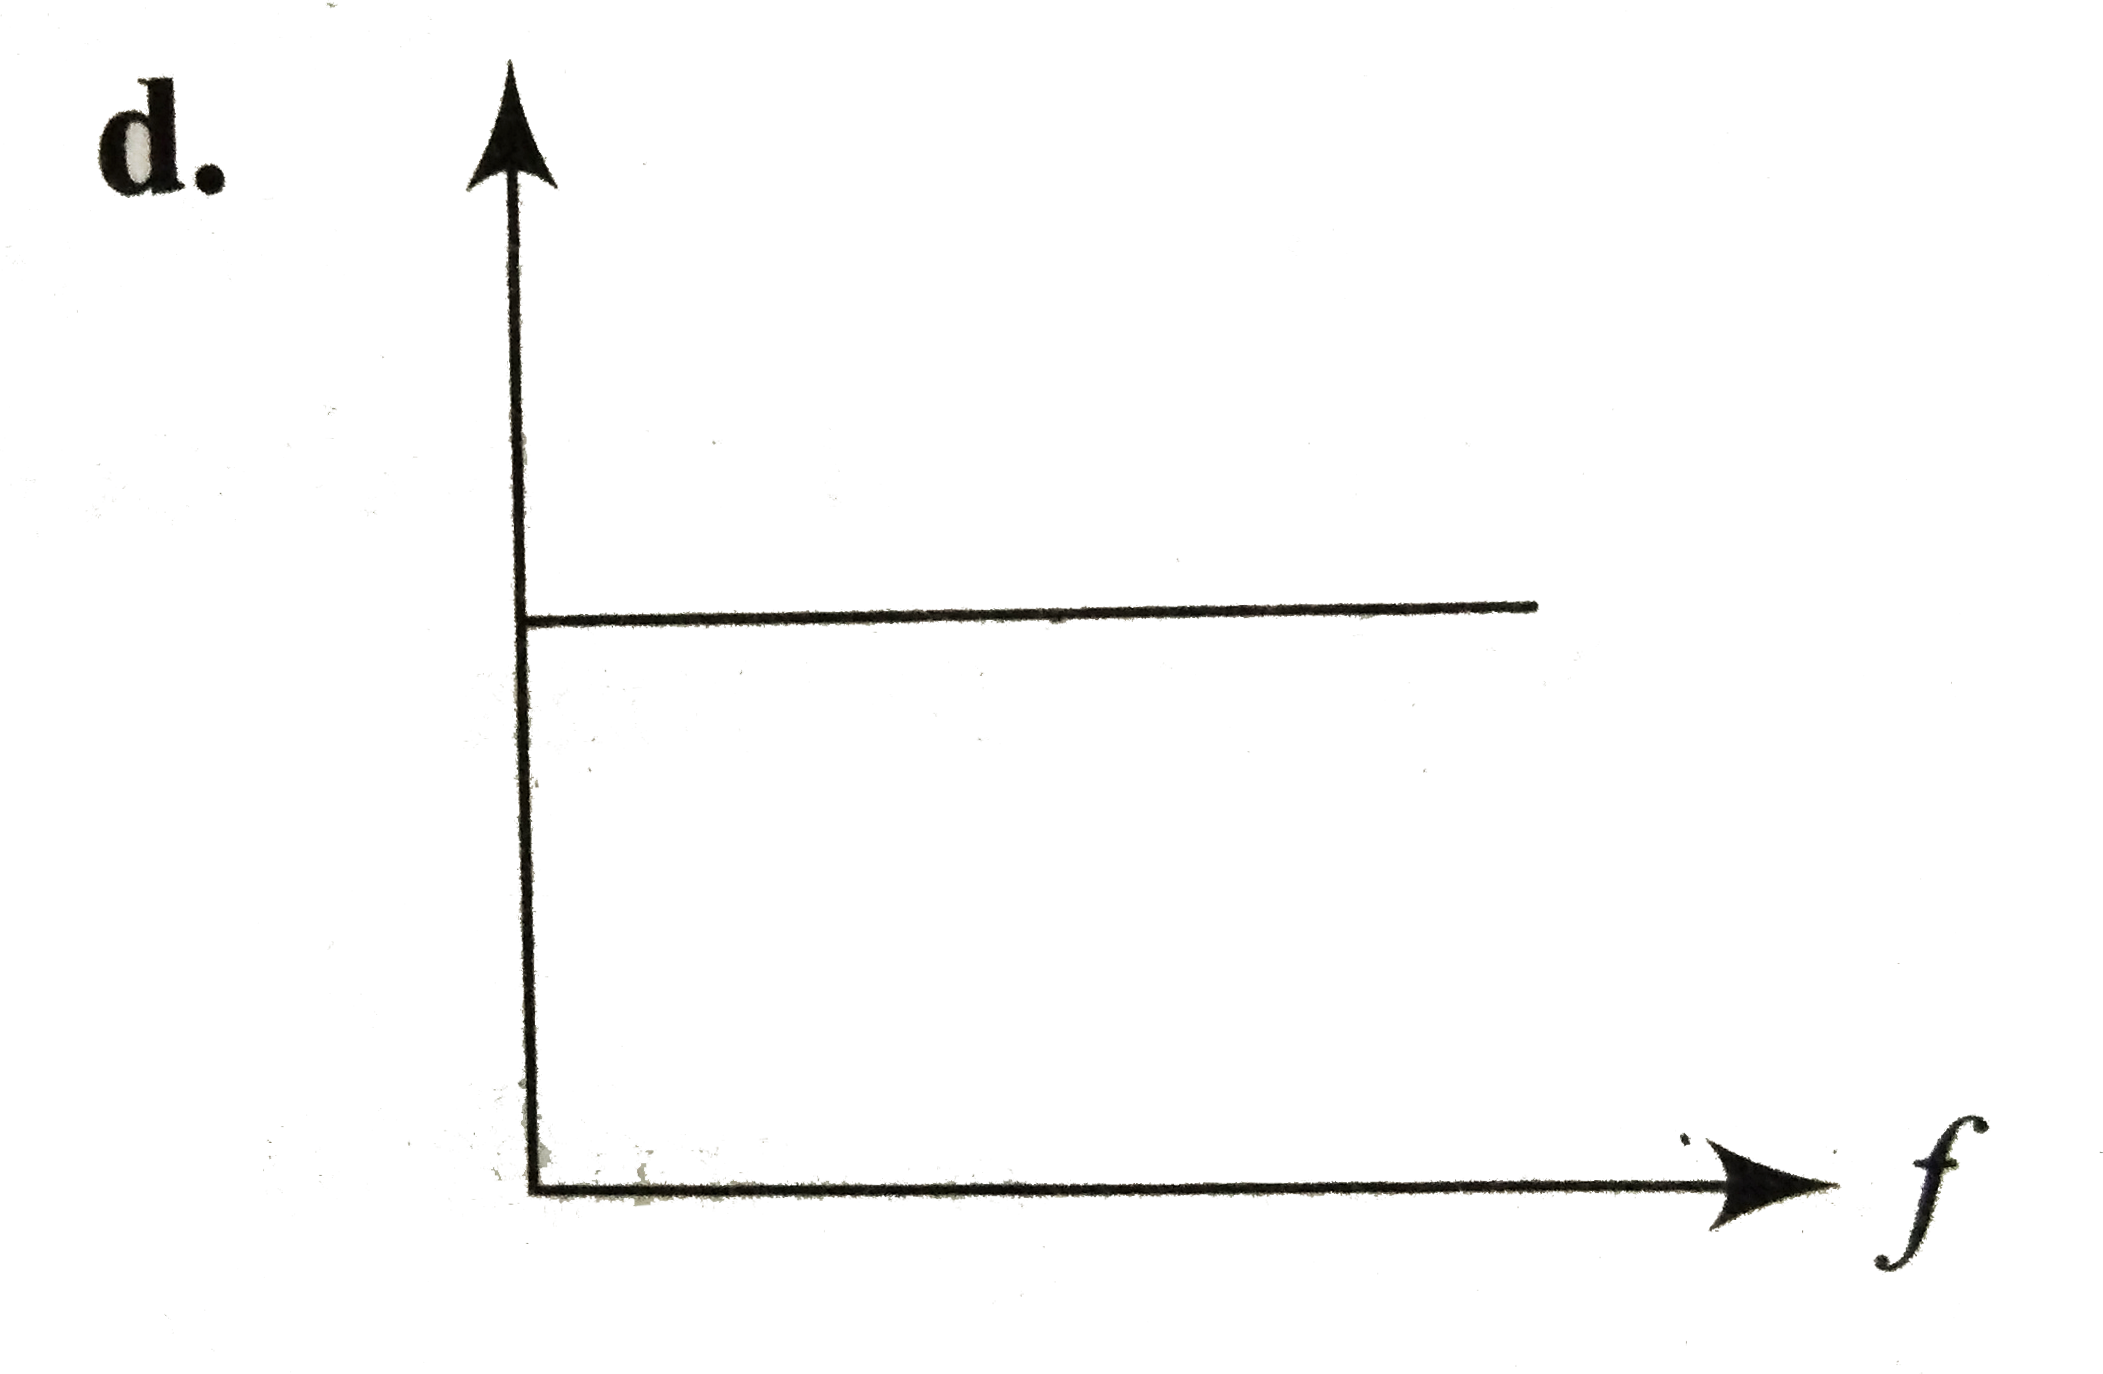
In an experiment on the photoelectric effect, an evecuated photocell with a pure metal cothode is used. Which graph best represents the variation of B, the minimum potential defference needed to prevent current from flowing, when x, the frequency of the incident light, is varied?
The correct Answer is:B
By Einstein's particle (photon) theory, the maximum kinetic energy of the emitted electrons from the cathode is proportional to the frequency f of the light. This is expressed in the Einstein's photoelectric equation below
..(i)
where h is the Planck's constant, is the work function of the metal and is related to the threshold frequency by . It is the minimum amount of work of energy necessary to take a free electron out of the metal against the attractive forces of surrounding positive ions.
At a particular negative potential difference V applied to the anode A, the current becomes zero. This is value of the negative potential difference which just stops the electrons with maximum energy from reaching A. V is called the stopping potential . Therefore,
..(ii)
From Eqs. (i) and (ii), we have
or
The variation of V (or y) is thus a straight line of gradient , when it is plotted against f(or x) at . It is best represented in graph b.
Topper's Solved these Questions
- BOOK - CENGAGE PHYSICSCHAPTER - PHOTOELECTRIC EFFECTEXERCISE - Multiple Correct10videos
PHOTOELECTRIC EFFECT
- BOOK - CENGAGE PHYSICSCHAPTER - PHOTOELECTRIC EFFECTEXERCISE - Linked Comprehension44videos
PHOTOELECTRIC EFFECT
- BOOK - CENGAGE PHYSICSCHAPTER - PHOTOELECTRIC EFFECTEXERCISE - Subjective16videos
PHOTOELECTRIC EFFECT
- BOOK - CENGAGE PHYSICSCHAPTER - NUCLEIEXERCISE - QUESTION BANK59videos
NUCLEI
- BOOK - CENGAGE PHYSICSCHAPTER - RAY OPTICSEXERCISE - DPP 1.612videos
RAY OPTICS
Similar Questions
What is photoelectric effect? Explain experimentally the variation of photoelectric current with (i) the intensity of the incident light (ii) the potential difference between the plates and (iii) the frequency of the incident light and hence state the laws of photoelectric emission.
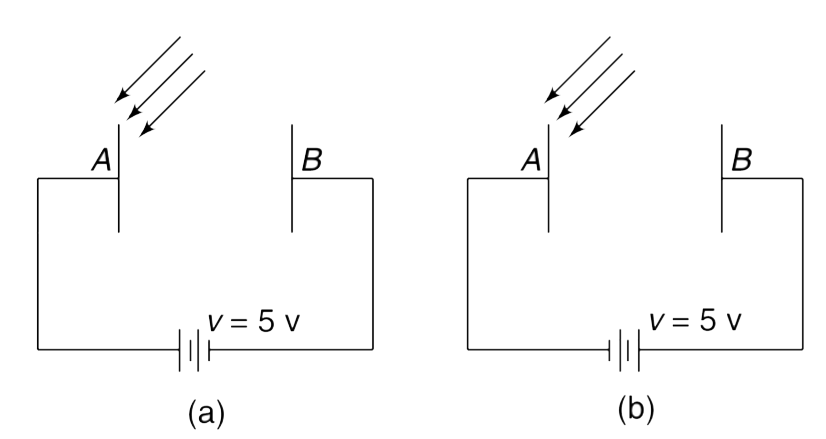
View SolutionIn a photoelectric experiment, a monochromatic light is incident on the metal plate A. It was observed that with V=5volt, the maximum kinetic energy of photoelectrons striking plate B was 1eV. The polarity of the applied potential difference was as shown in figure (a). With polarity of the applied potential difference reversed (as shown in figure (b)) and frequency of incident light doubled, it was observed that in saturation state, the kinetic energy of electrons striking plate B ranged between 5 eV to 20 eV. Find the work function of metal used in plate A.
 View Solution
Knowledge Check
- Question 1 - Select One
A point source of light is used in an experiment on photoelectric effect . Which of the following curves best represents the variation of photo current (i) with distance (d) of the source from the emitter?
 AaBbCcDd
 - Question 2 - Select One
In an experiment on photoelectric effect the frequency f of the incident light is plotted against the stopping potential V0. The work function of the metal is given by ( e is the electronic charge)
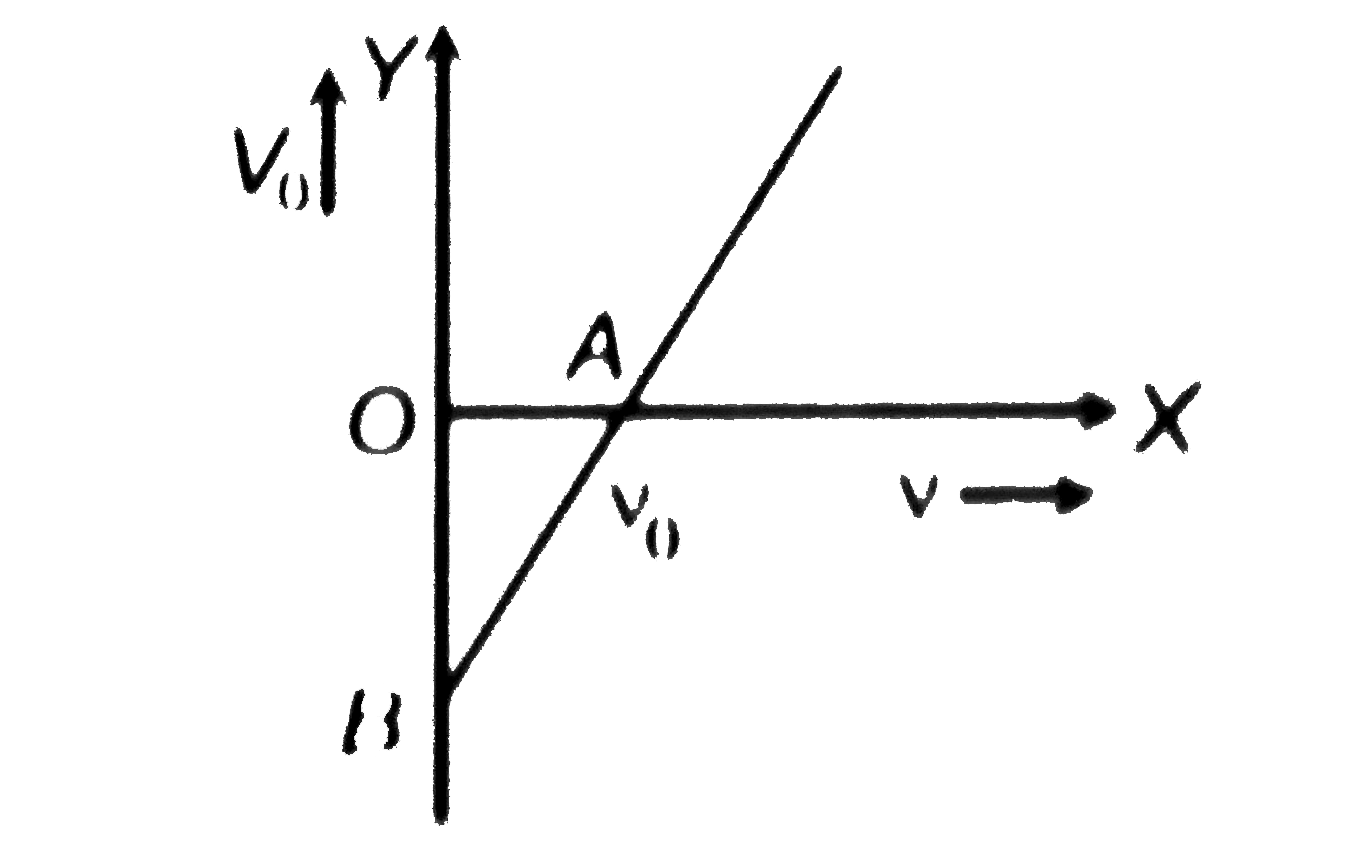 AOB×e in eVBOB in VoltCOA in VoltDThe slope of the line AB
 - Question 3 - Select One
In Q. 29, Which os the folllowing graphs best represents the current flowing from X to Y?
A B
B C
C D
D
In an experiment on photoelectric effect, a student plots stopping potential V0 against reciprocal of the wavelength λ of the incident light for two different metals A and B. These are shown in the figure
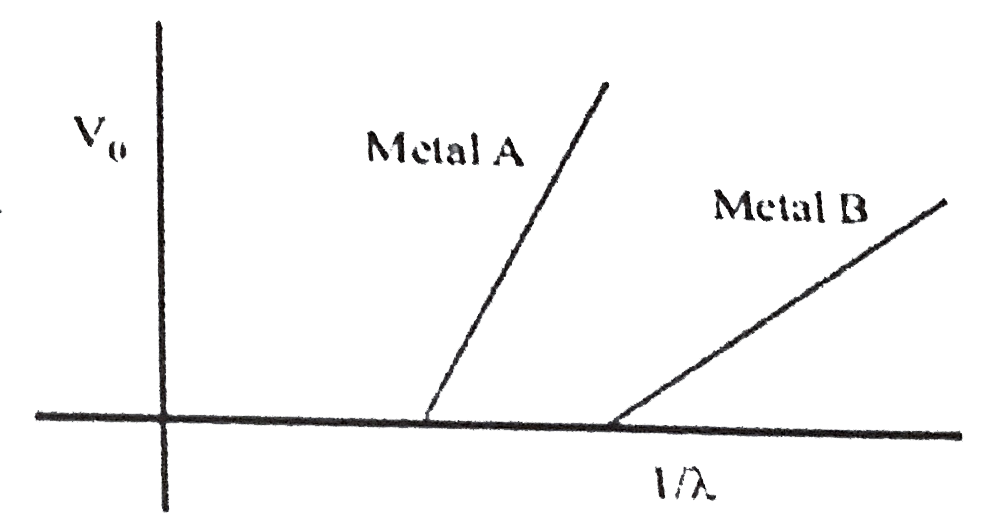
Looking at the graphs, you can most appropriately say that :View SolutionExplain giving reasons for the following:
(a) Photoelectric current in a photocell increases with the increase in the intensity of the incident radiation.
(b) The stopping potential (V0) varies linearly with the frequency (v) of the incident radiation for a given photosensitive surface with the slope remaining the same for different surfaces.
(c) Maximum kinetic energy of the photoelectrons is independent of the intensity of incident radiation.View SolutionOf the following statement about the photoelectric effect, which are true and which are false?
(a) The greater the frequency of the incident light is, the greater is the stopping potential.
(b) The greater the intensity of the incident light is, the greater is the cutoff frequency.
(c) The greater the work function of the target material is, the greater is the stopping potential.
(d) The greater the work function of the target material is, the greater is the cutoff frequency.
(e) The greater the frequency of the incident light is, the greater is the maximum kinetic energy of the ejected electrons.
(f) The greater the energy of the photons is, the smaller is the stopping potential.View SolutionIn problem No. 1 which of the following graphs best represents the current flowing from X to Y ?
View SolutionFor a photoelectric cell the graph showing the variation of cut of voltage (V) with frequency (v) of incident light is best represented by
View Solution
