In a photoelectric emission, electrons are ejected from metals X and Y by light of frequency f. The potential difference V required to stop the electrons is measured for various frequencies.. If Y has a greater work function than X, which graph illustrates the expected results?
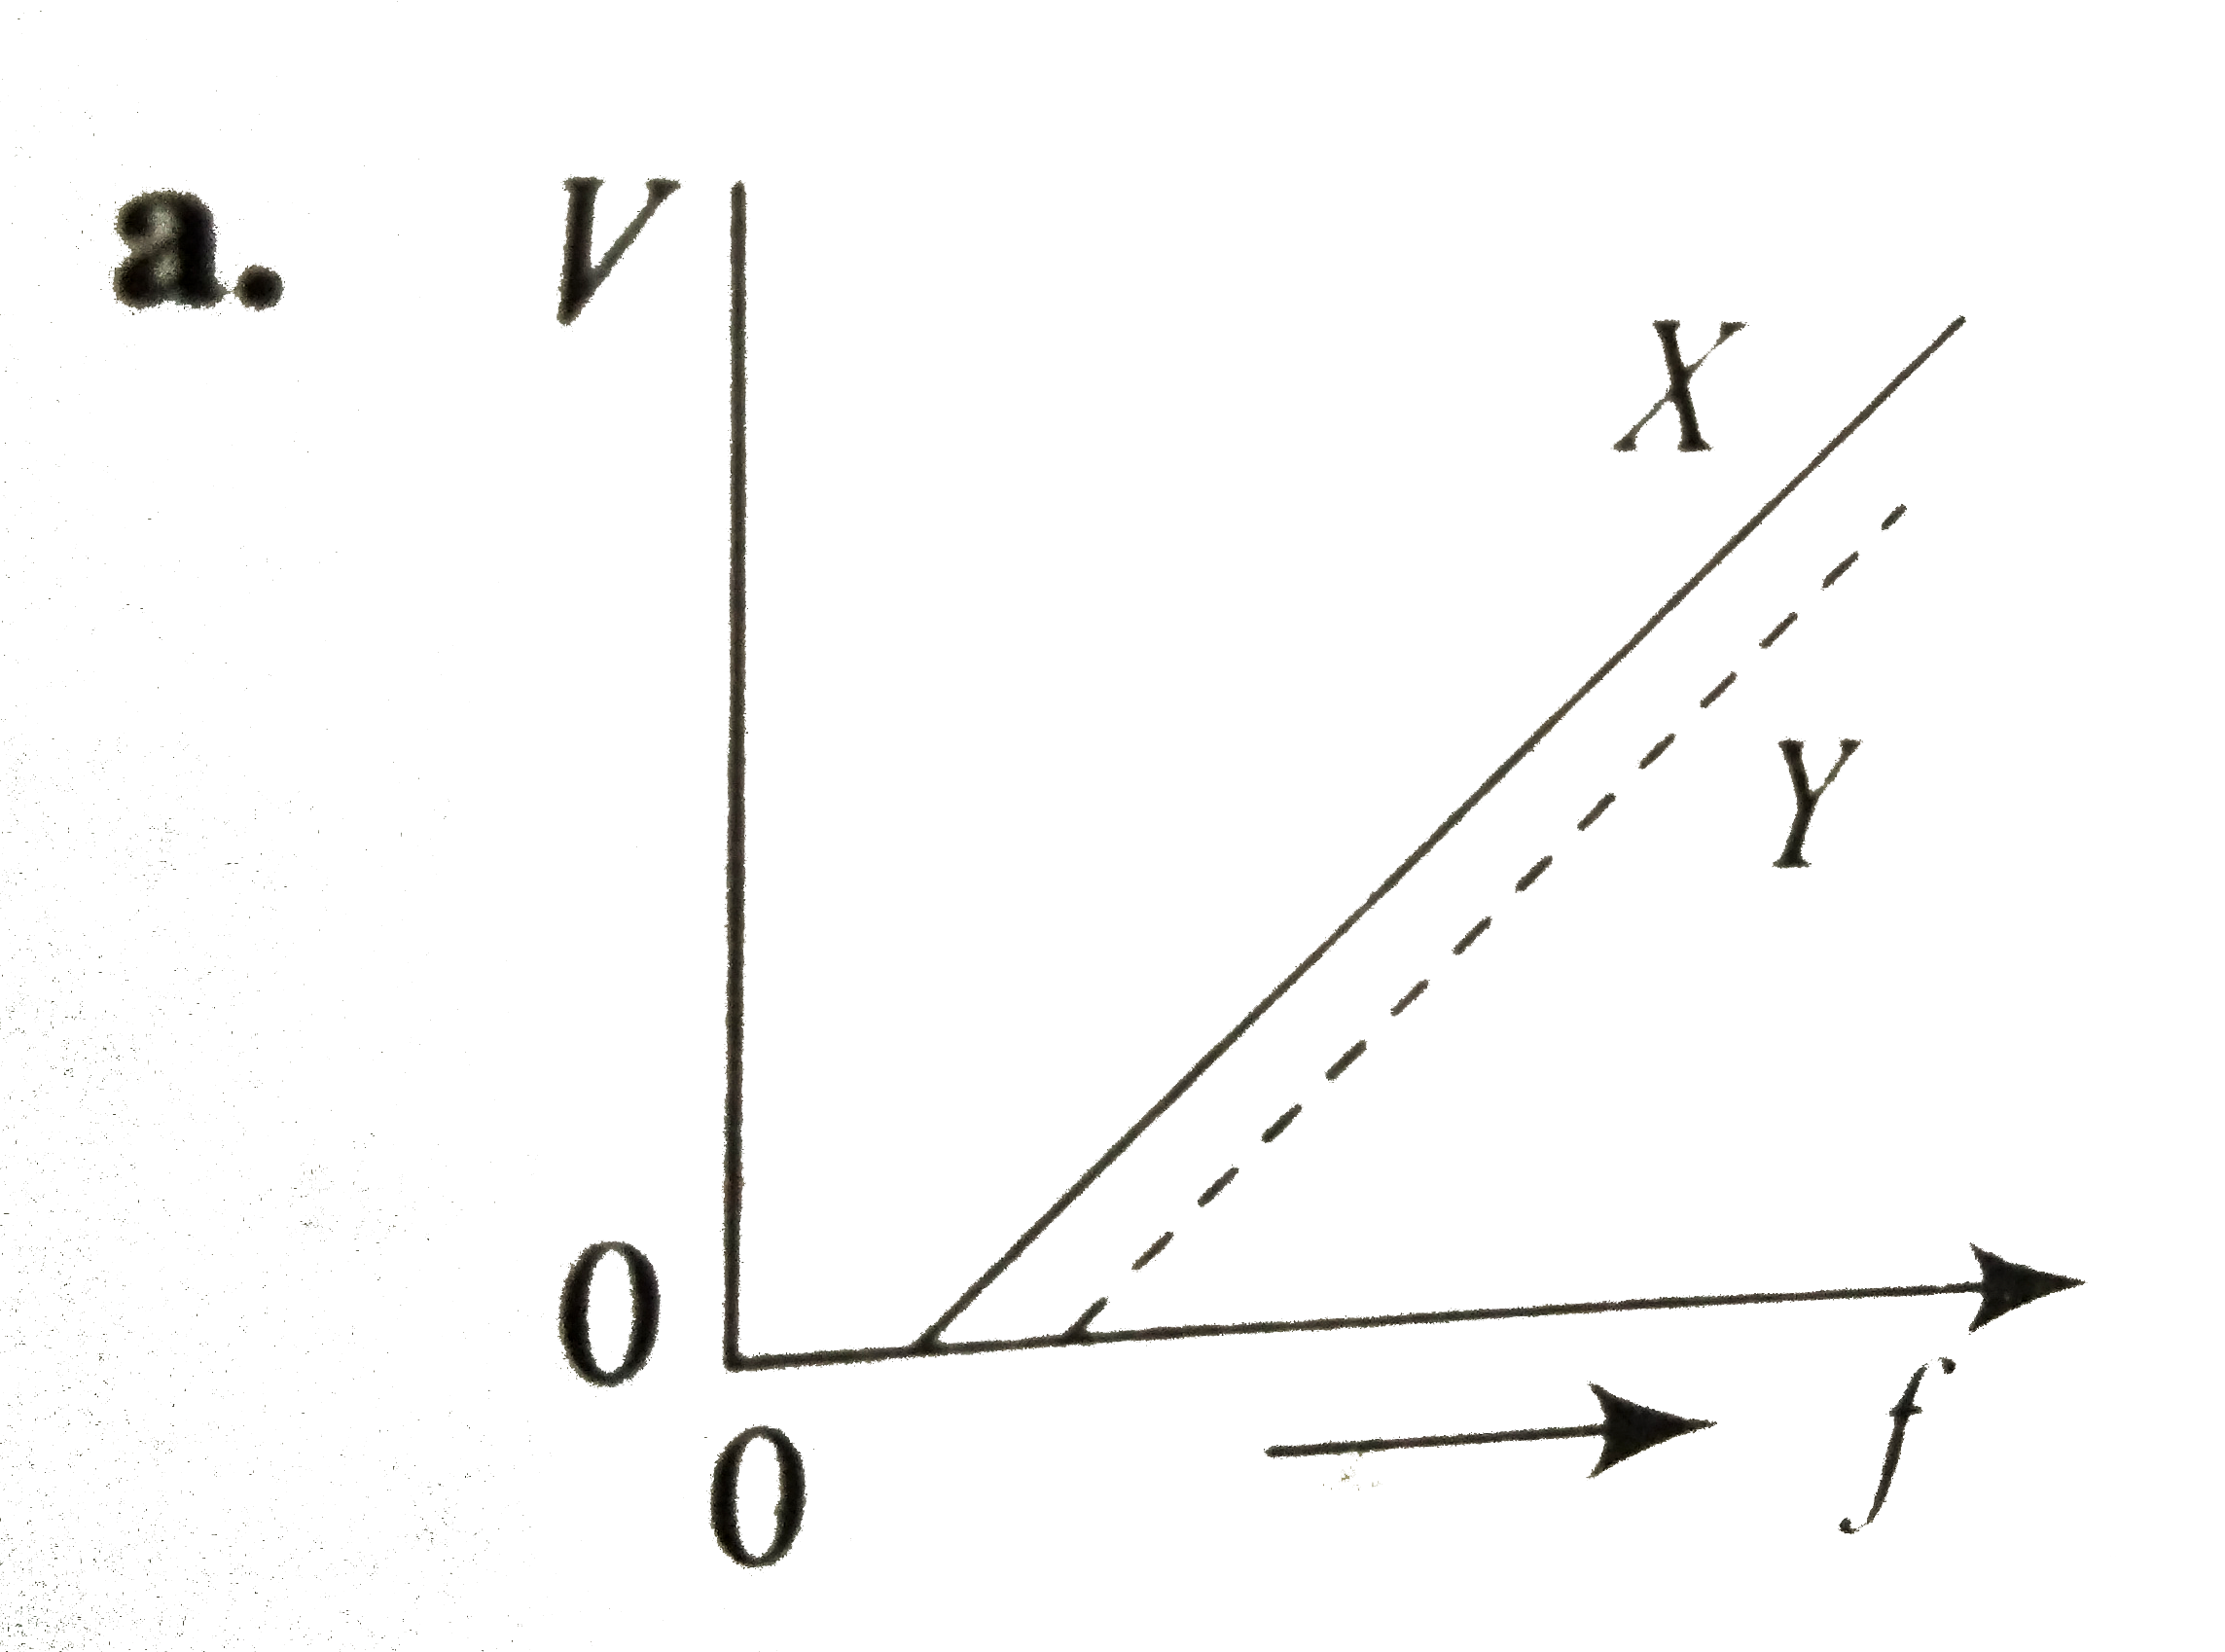
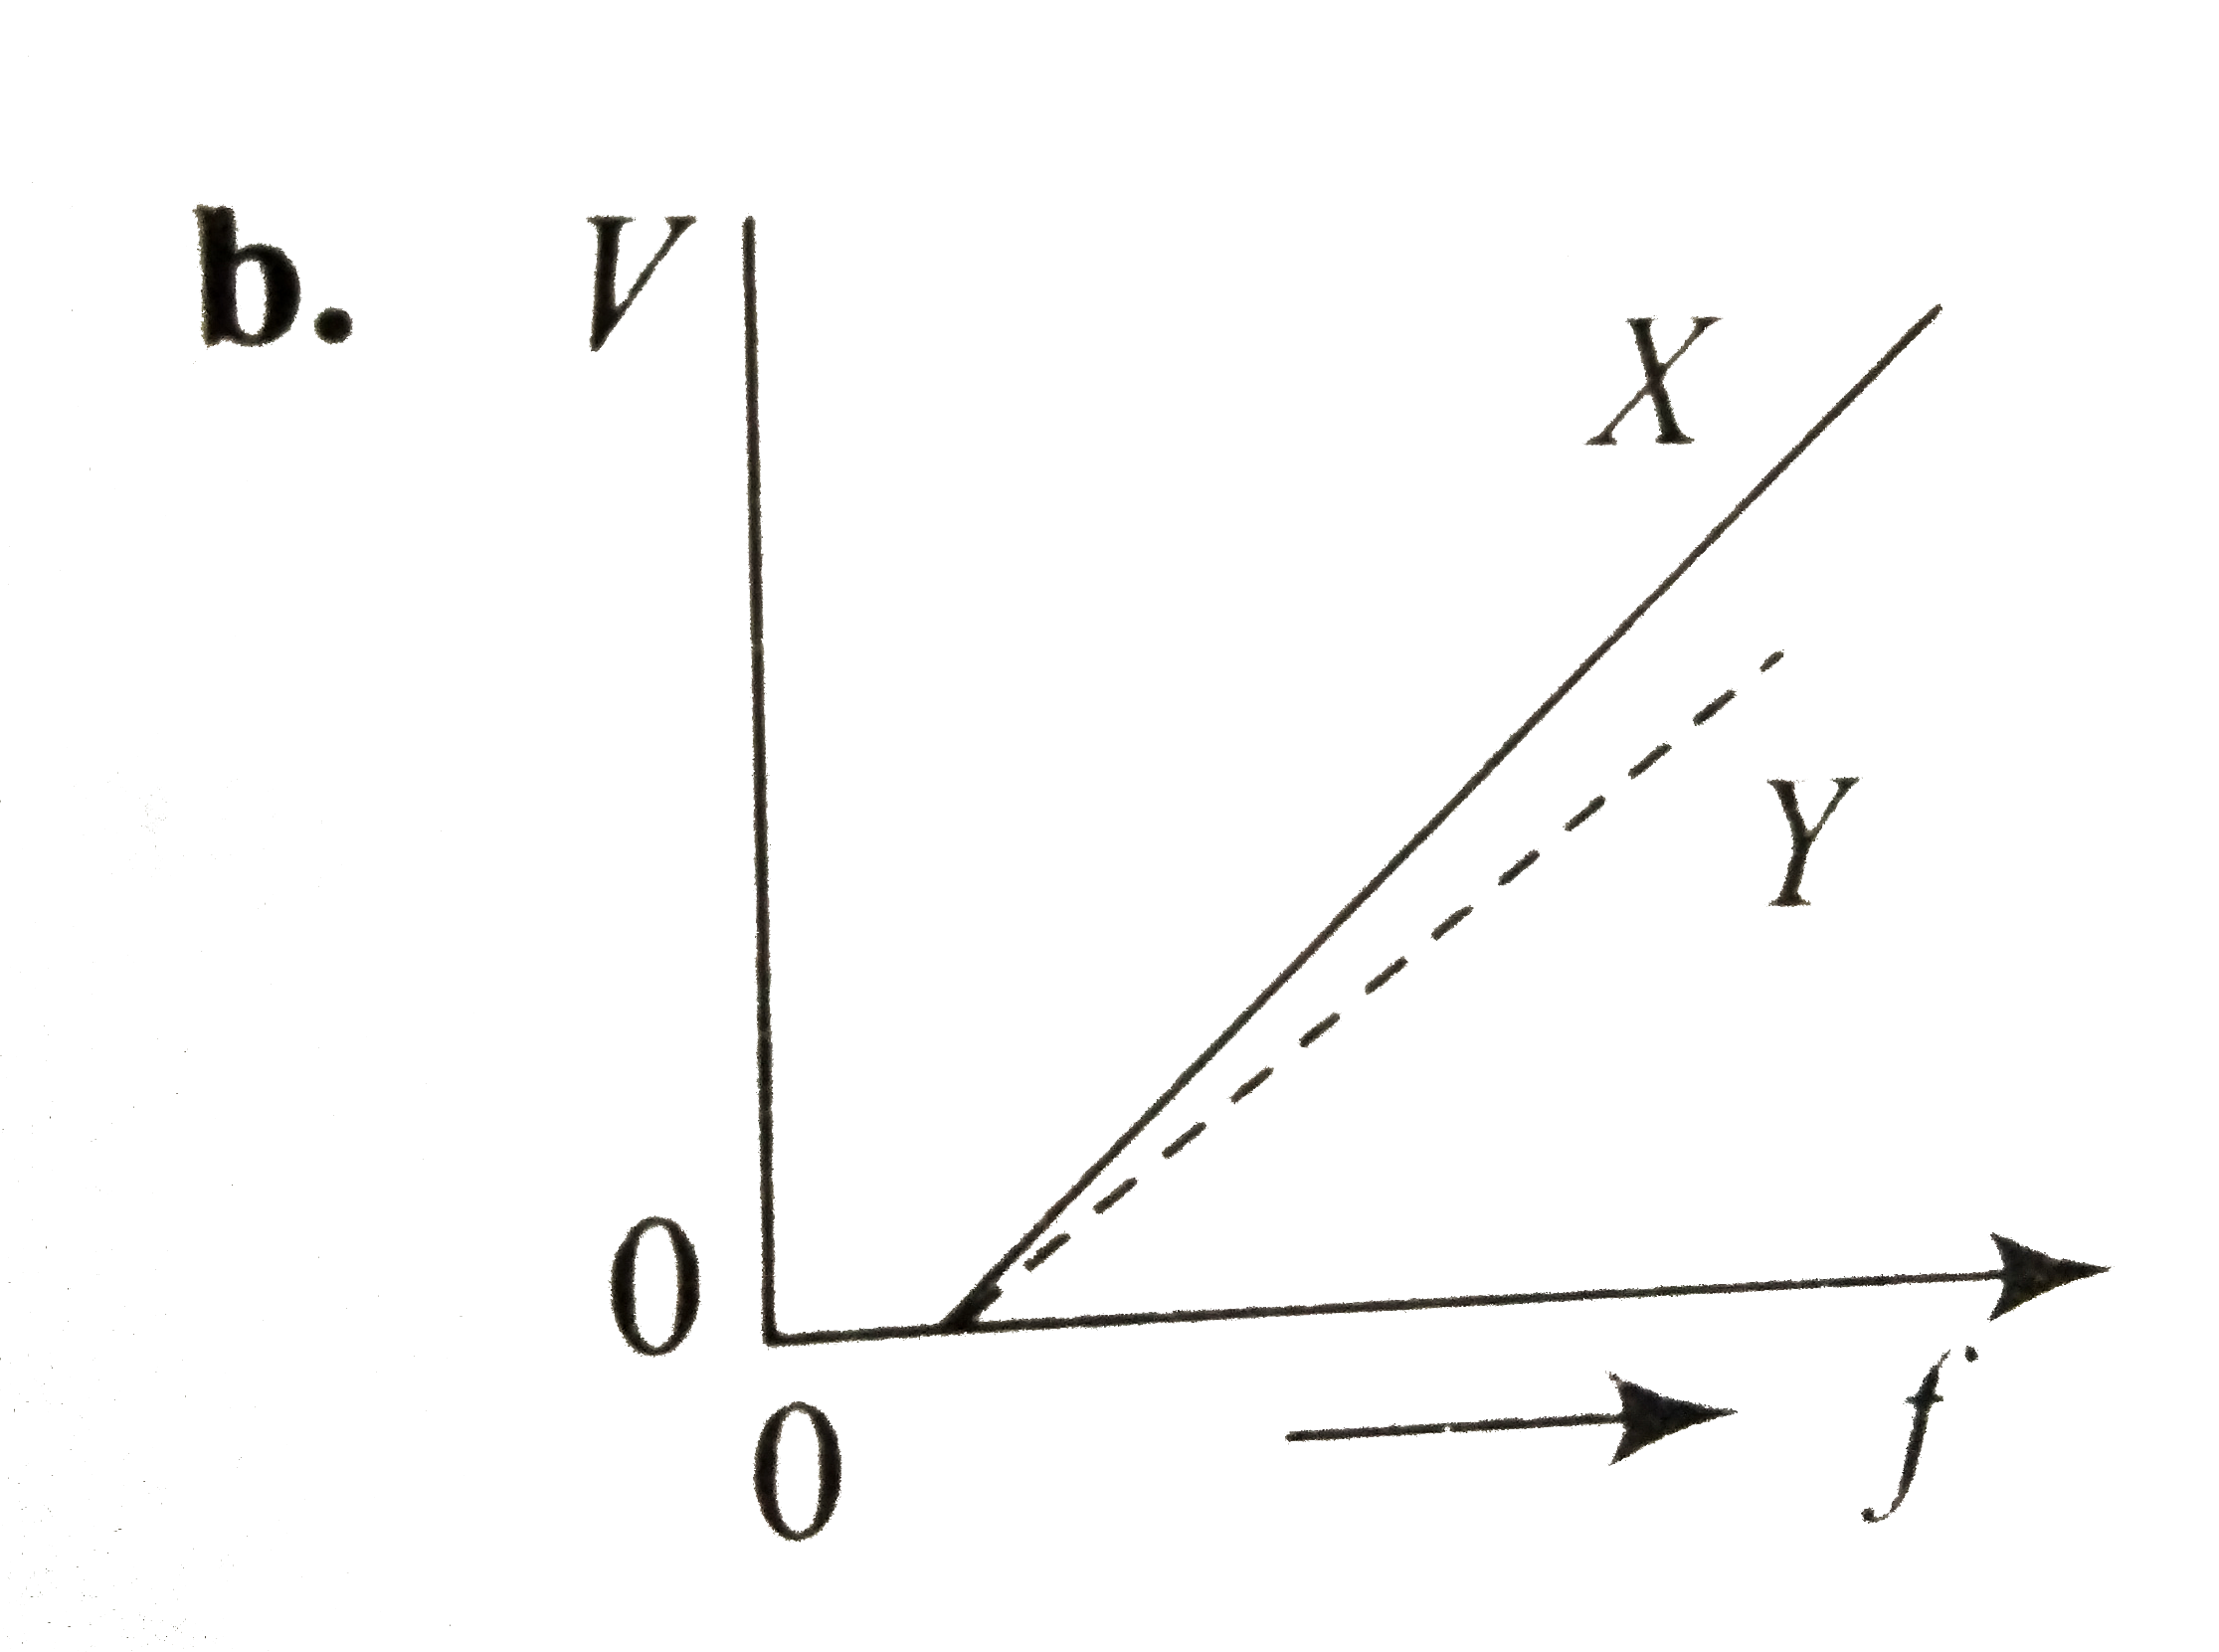
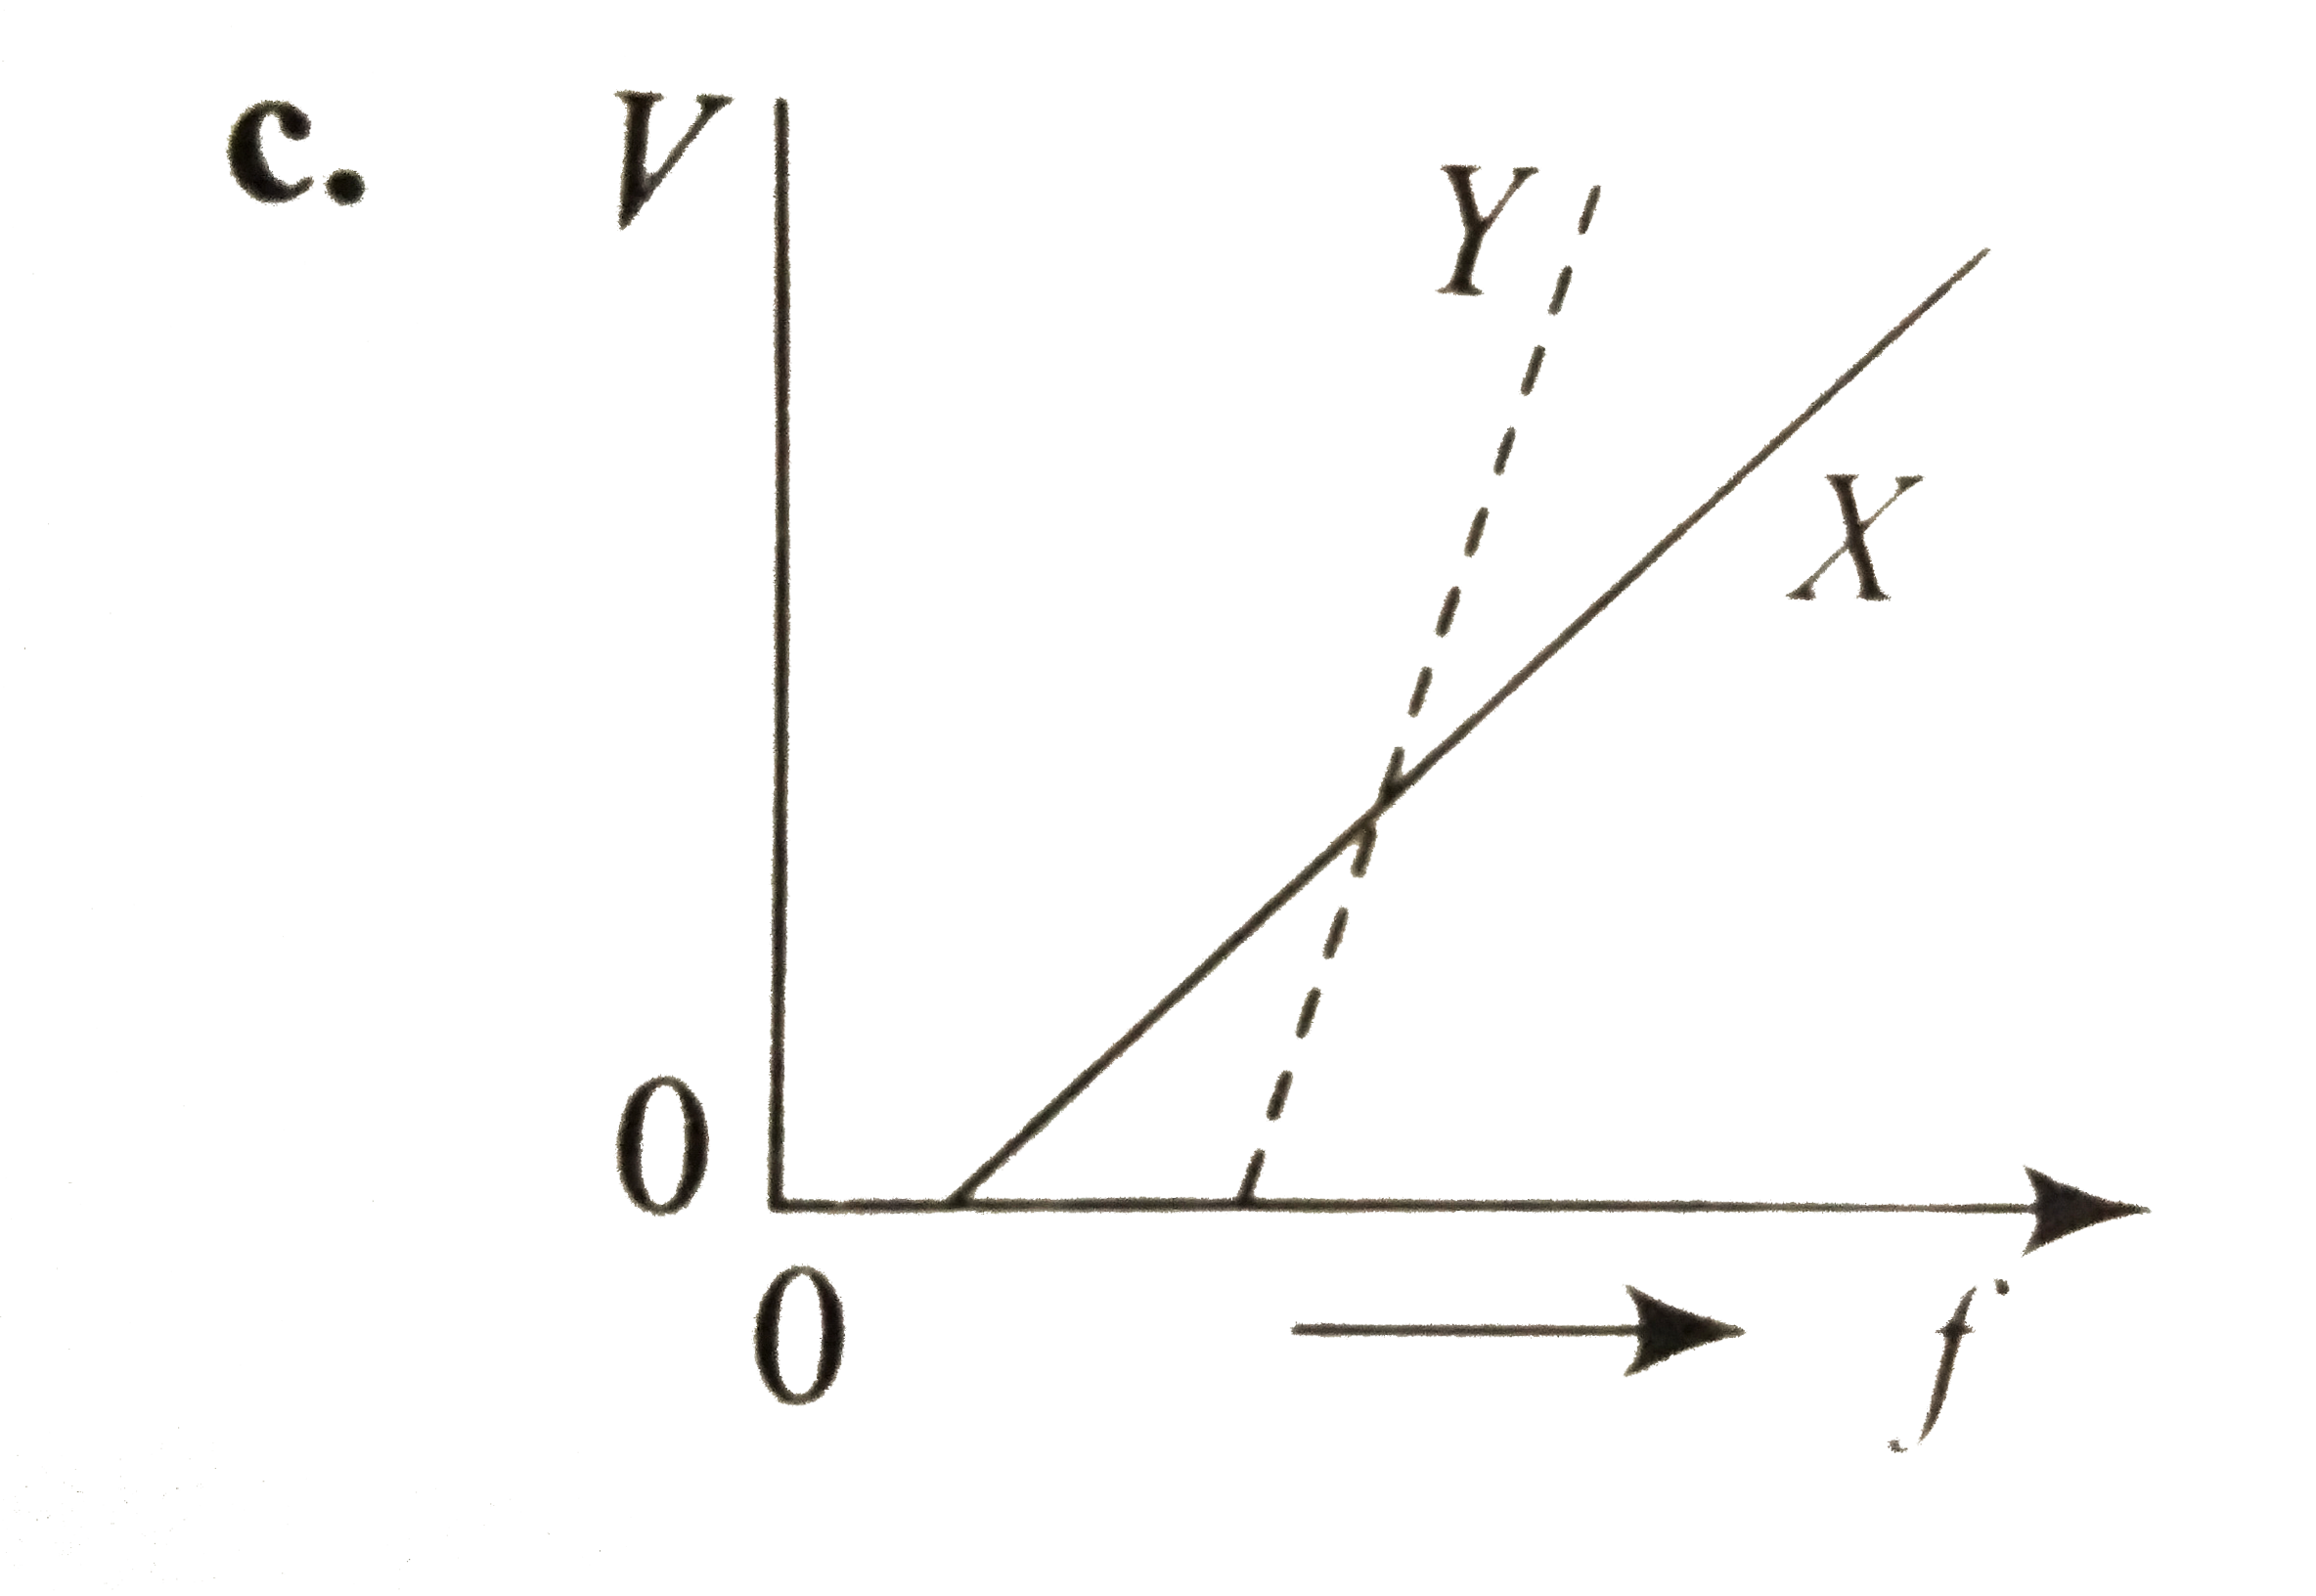
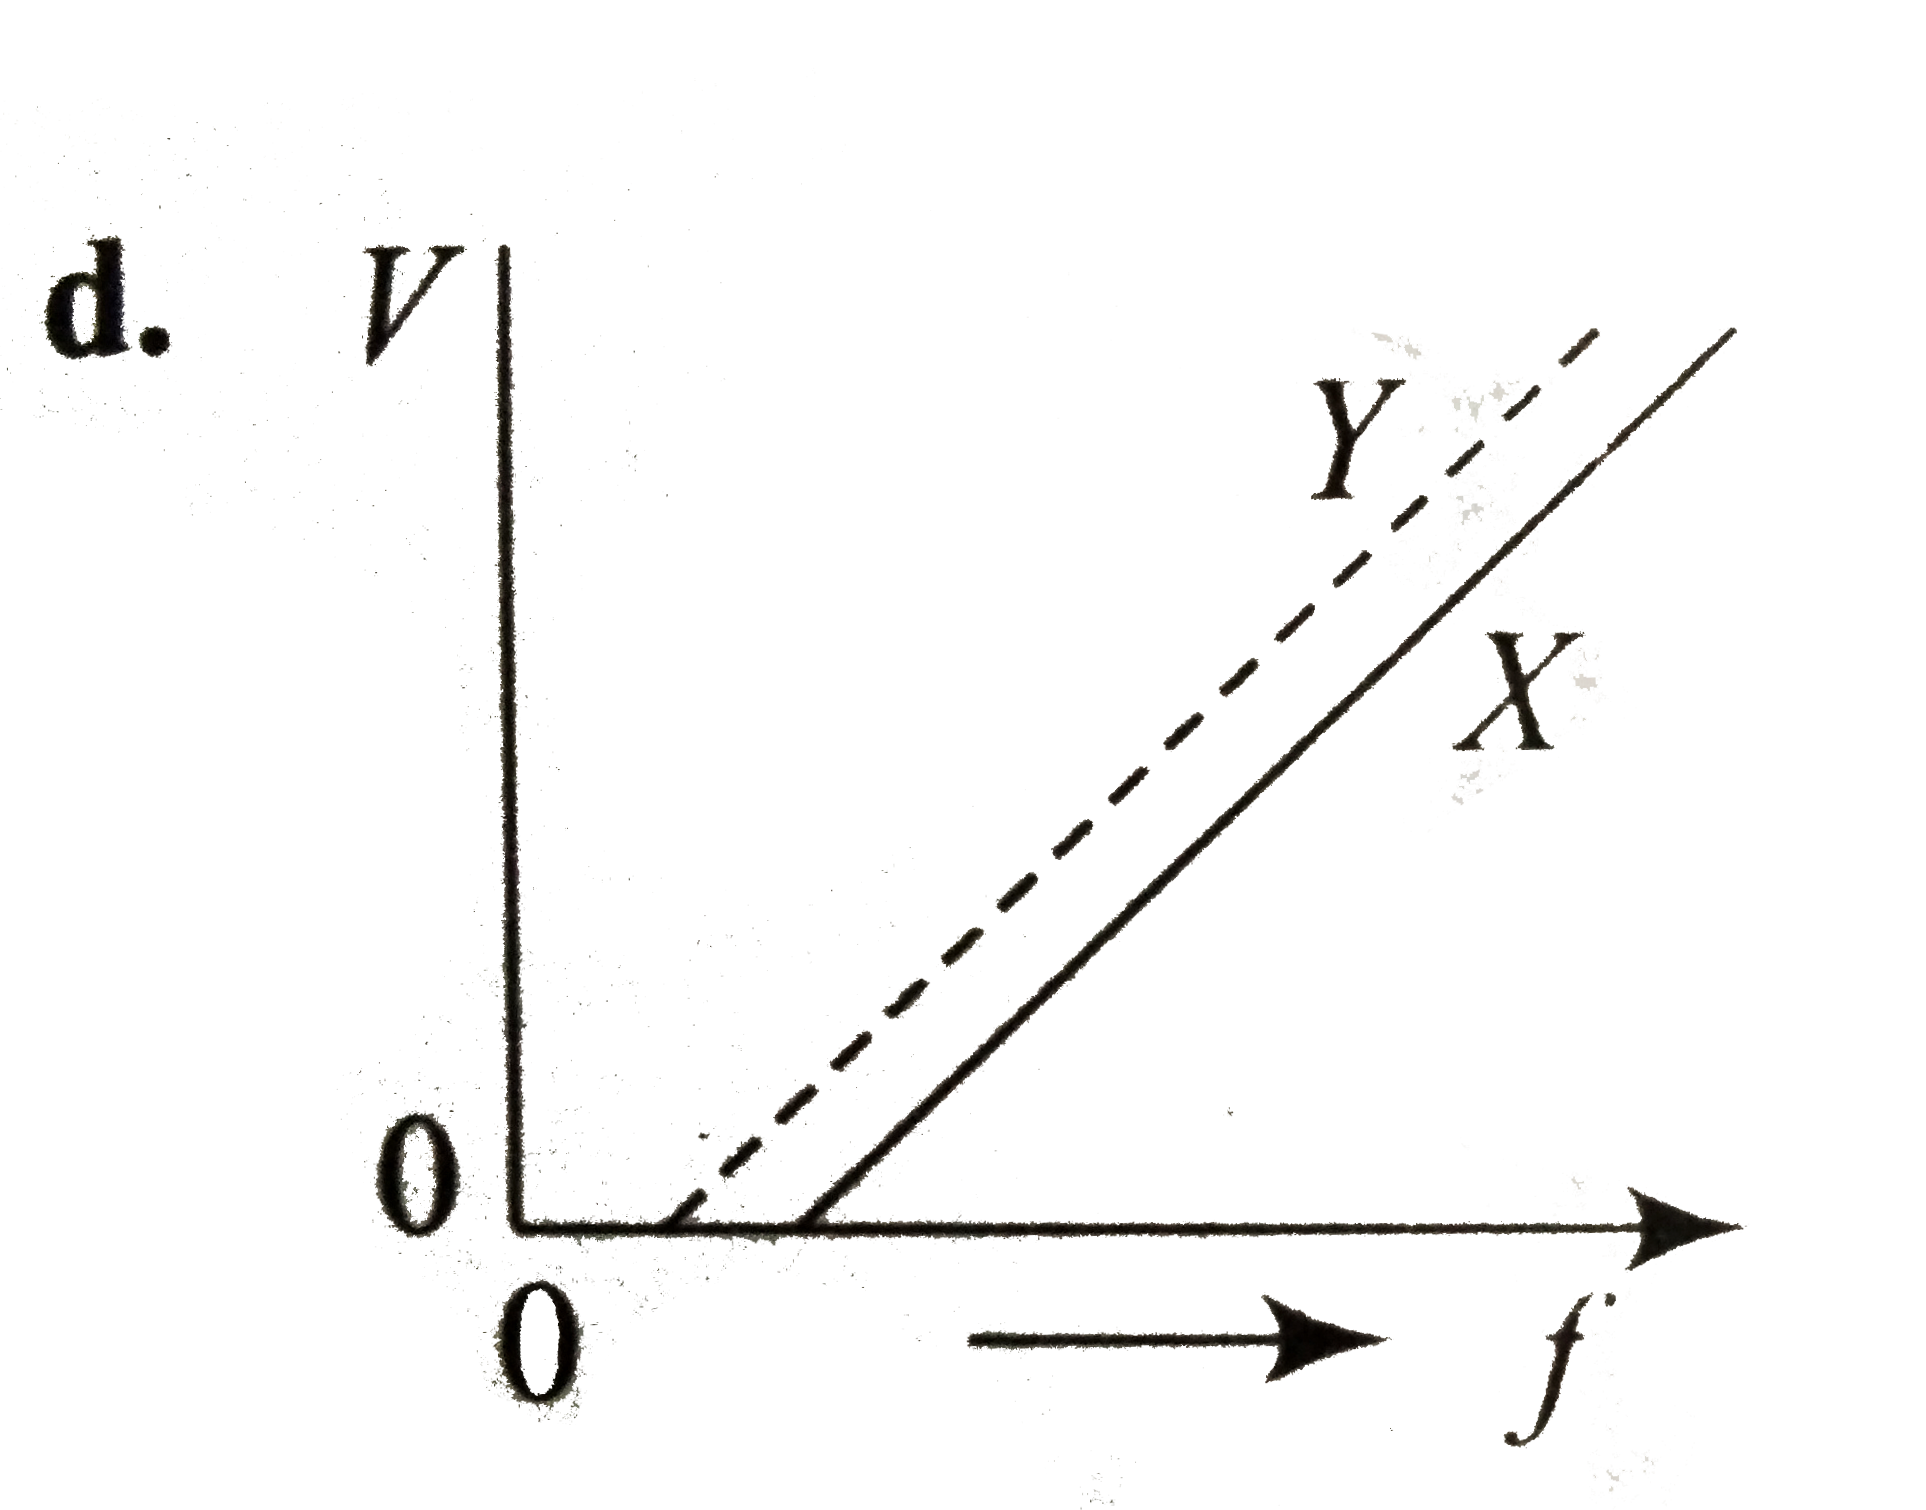
The correct Answer is:A
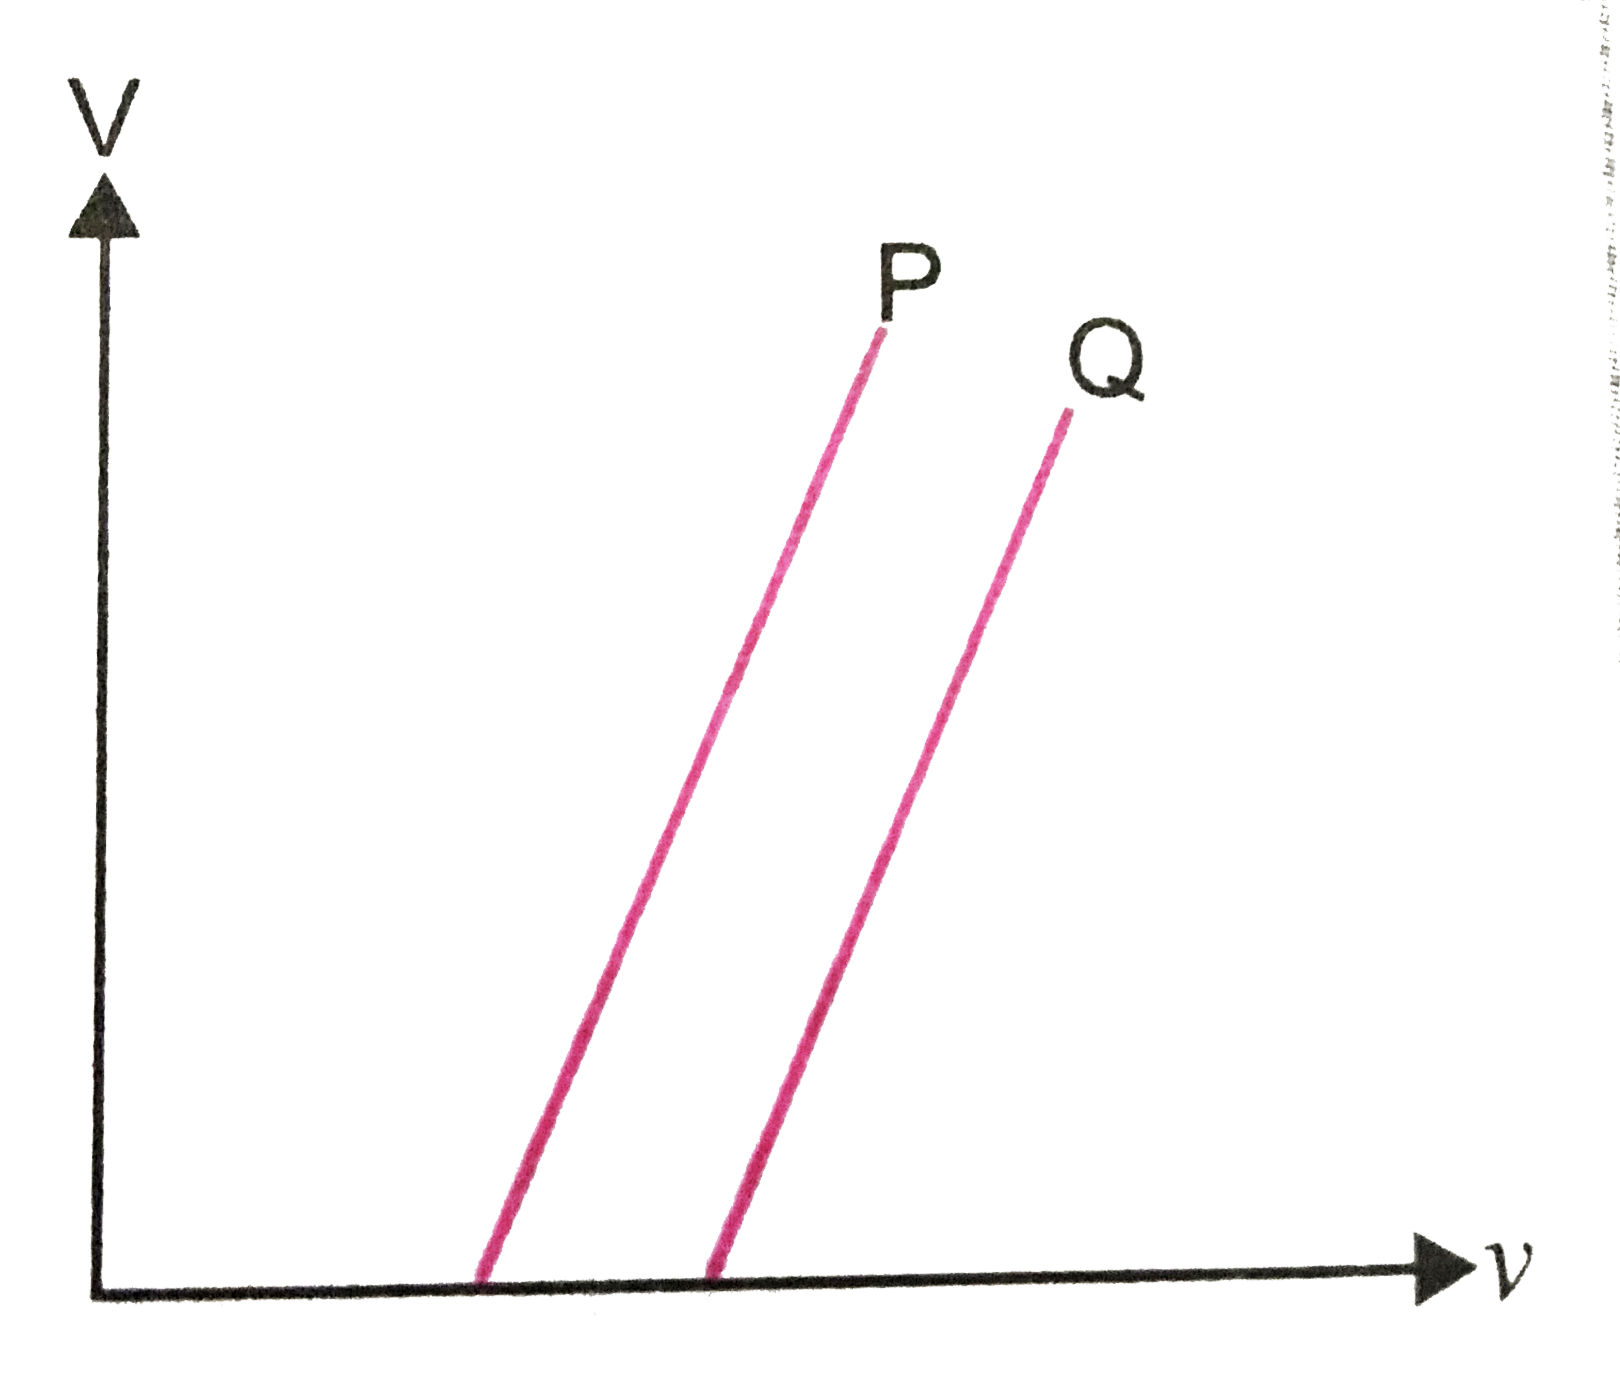
V versus F has a constant slope of he, so both lines must be parallel.
Also, work function is equal to intercept on f-axis
Topper's Solved these Questions
- BOOK - CENGAGE PHYSICSCHAPTER - PHOTOELECTRIC EFFECTEXERCISE - Multiple Correct10videos
PHOTOELECTRIC EFFECT
- BOOK - CENGAGE PHYSICSCHAPTER - PHOTOELECTRIC EFFECTEXERCISE - Linked Comprehension44videos
PHOTOELECTRIC EFFECT
- BOOK - CENGAGE PHYSICSCHAPTER - PHOTOELECTRIC EFFECTEXERCISE - Subjective16videos
PHOTOELECTRIC EFFECT
- BOOK - CENGAGE PHYSICSCHAPTER - NUCLEIEXERCISE - QUESTION BANK59videos
NUCLEI
- BOOK - CENGAGE PHYSICSCHAPTER - RAY OPTICSEXERCISE - DPP 1.612videos
RAY OPTICS
Similar Questions
Knowledge Check
- Question 1 - Select One
In photoelectric emission process from a metal of work function 1.8eV , the kinetic energy of most energetic electrons is 0.5eV. The corresponding stopping potential is
A1.3VB0.5VC2.3VD1.8V - Question 2 - Select One
When a metal surface is illuminated by a monochromatic light of wave-length λ, then the potential difference required to stop the ejection of electrons is 3V. When the same surface is illuminated by the light of wavelength 2λ, then the potential difference required to stop the ejection of electrons is V. Then for photoelectric effect, the threshold wavelength for the metal surface will be
A6λB4λ/3C4λD8λ - Question 3 - Select One
The stopping potential as a function of the frequency of the incident radiation is plotted for two different photoelectric surfaces A and B . The graphs show that work function of A is
 AGreater than that of BBSmaller than that of BCEqual to that of BDNo inference can be drawn about their work functions from the given graphs
In a photoelectric effect experiment, the graph between the stopping potential (V) and frequency (v) of the incident radiations on two different metal plates P and Q are shown in plates, P and Q has greater value of work function ? (ii) What does the slope of the lines depict?
 View Solution
What is the work function of a metal if light of minimum frequency 8×10¹³Hz is required for emission of photo electrons?
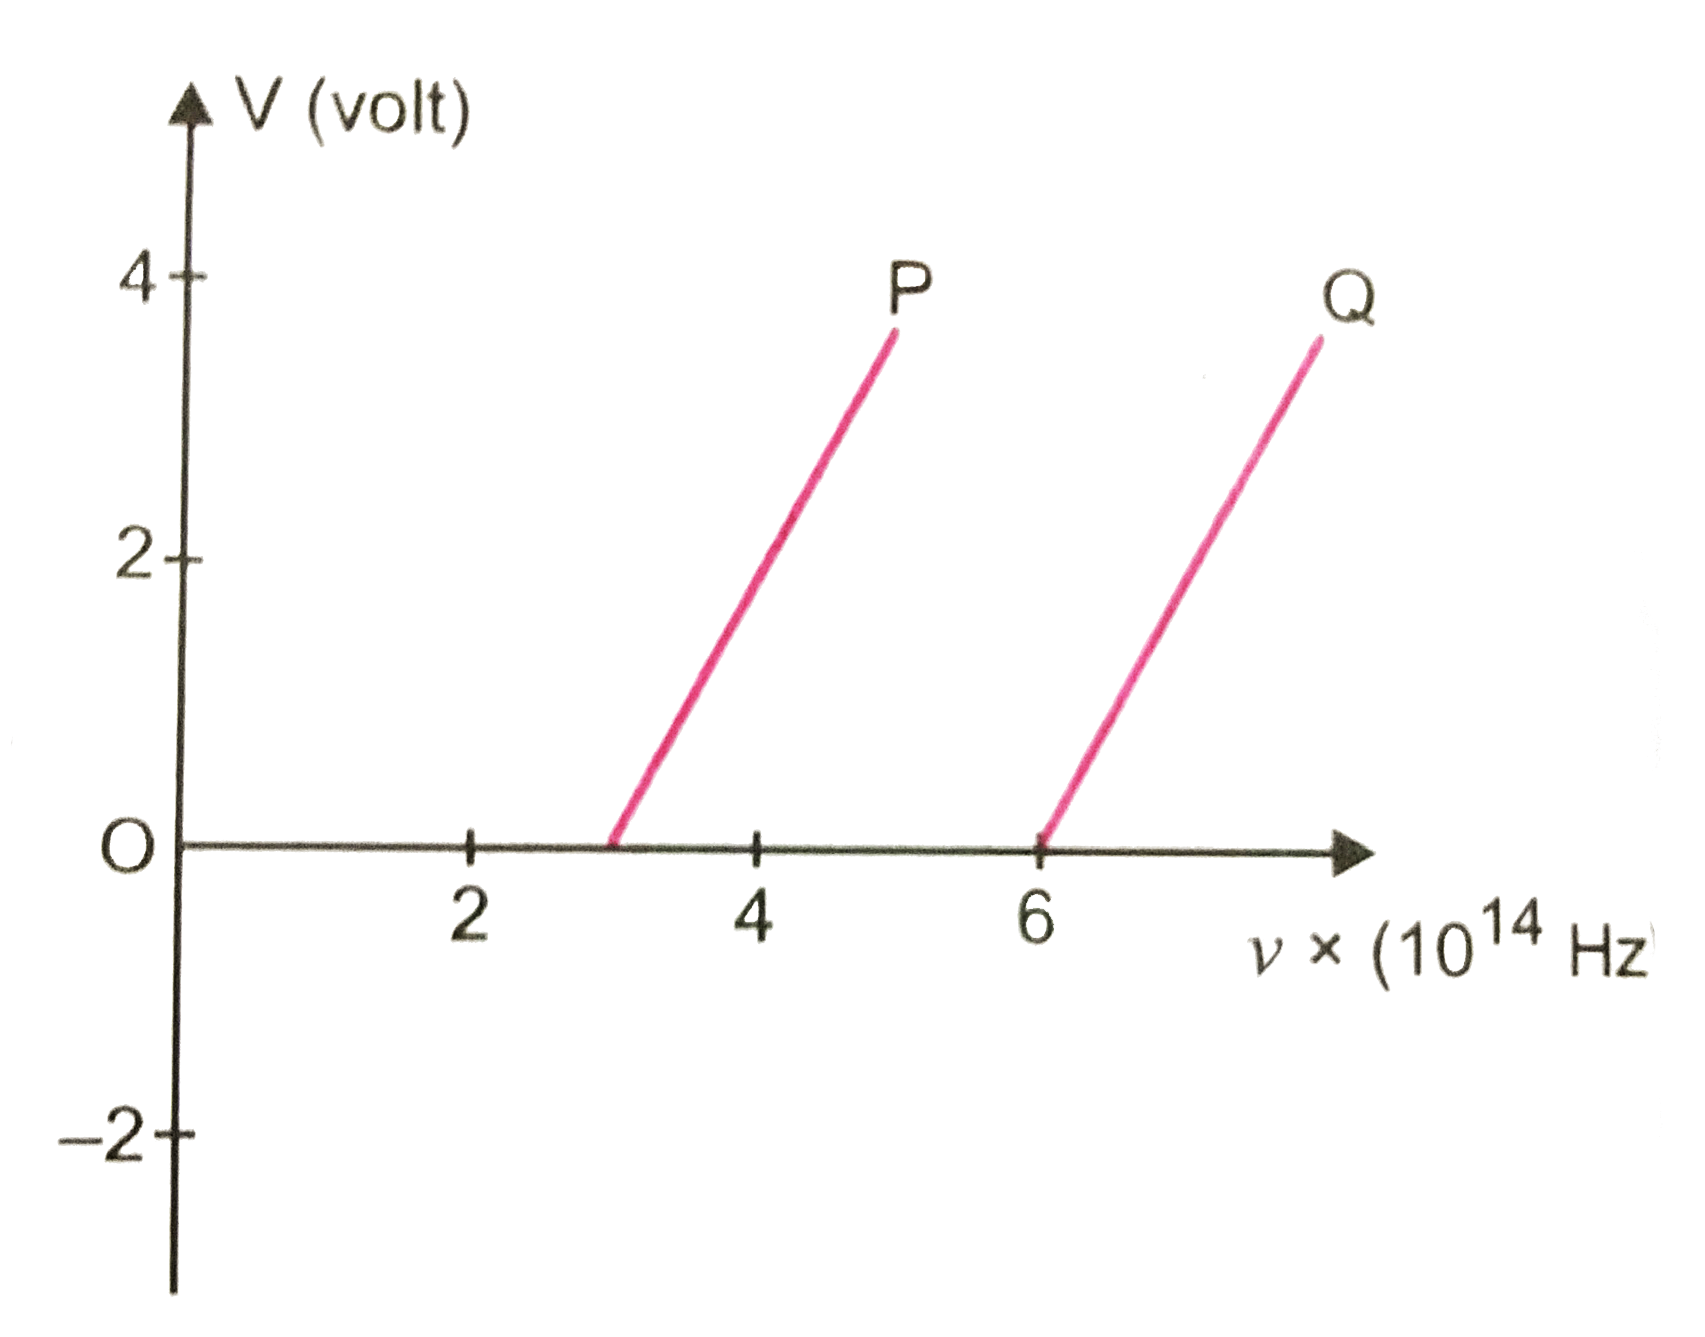
View SolutionIn the study of a photoelectric effect the graph between the stopping potential V and frequency v of the incident radiation on two different metals P and Q is shown in fig.
(i) which one of two metals have higher threshold frequency
(ii) Determine the work function of the metal which has greater value
(iii) Find the maximum kinetic energy of electron emitted by light of frequency 8×10¹⁴Hz for this metal.
 View Solution
The threshold wavelength for the ejection of electron from metal is 330 nm, then work function for the photoelectric emission is
View SolutionA metal surface of work function 1.07eV is irradiated with light of wavelength 332nm. The retarding potential required to stop the escape of photo - electrons is
View Solution

