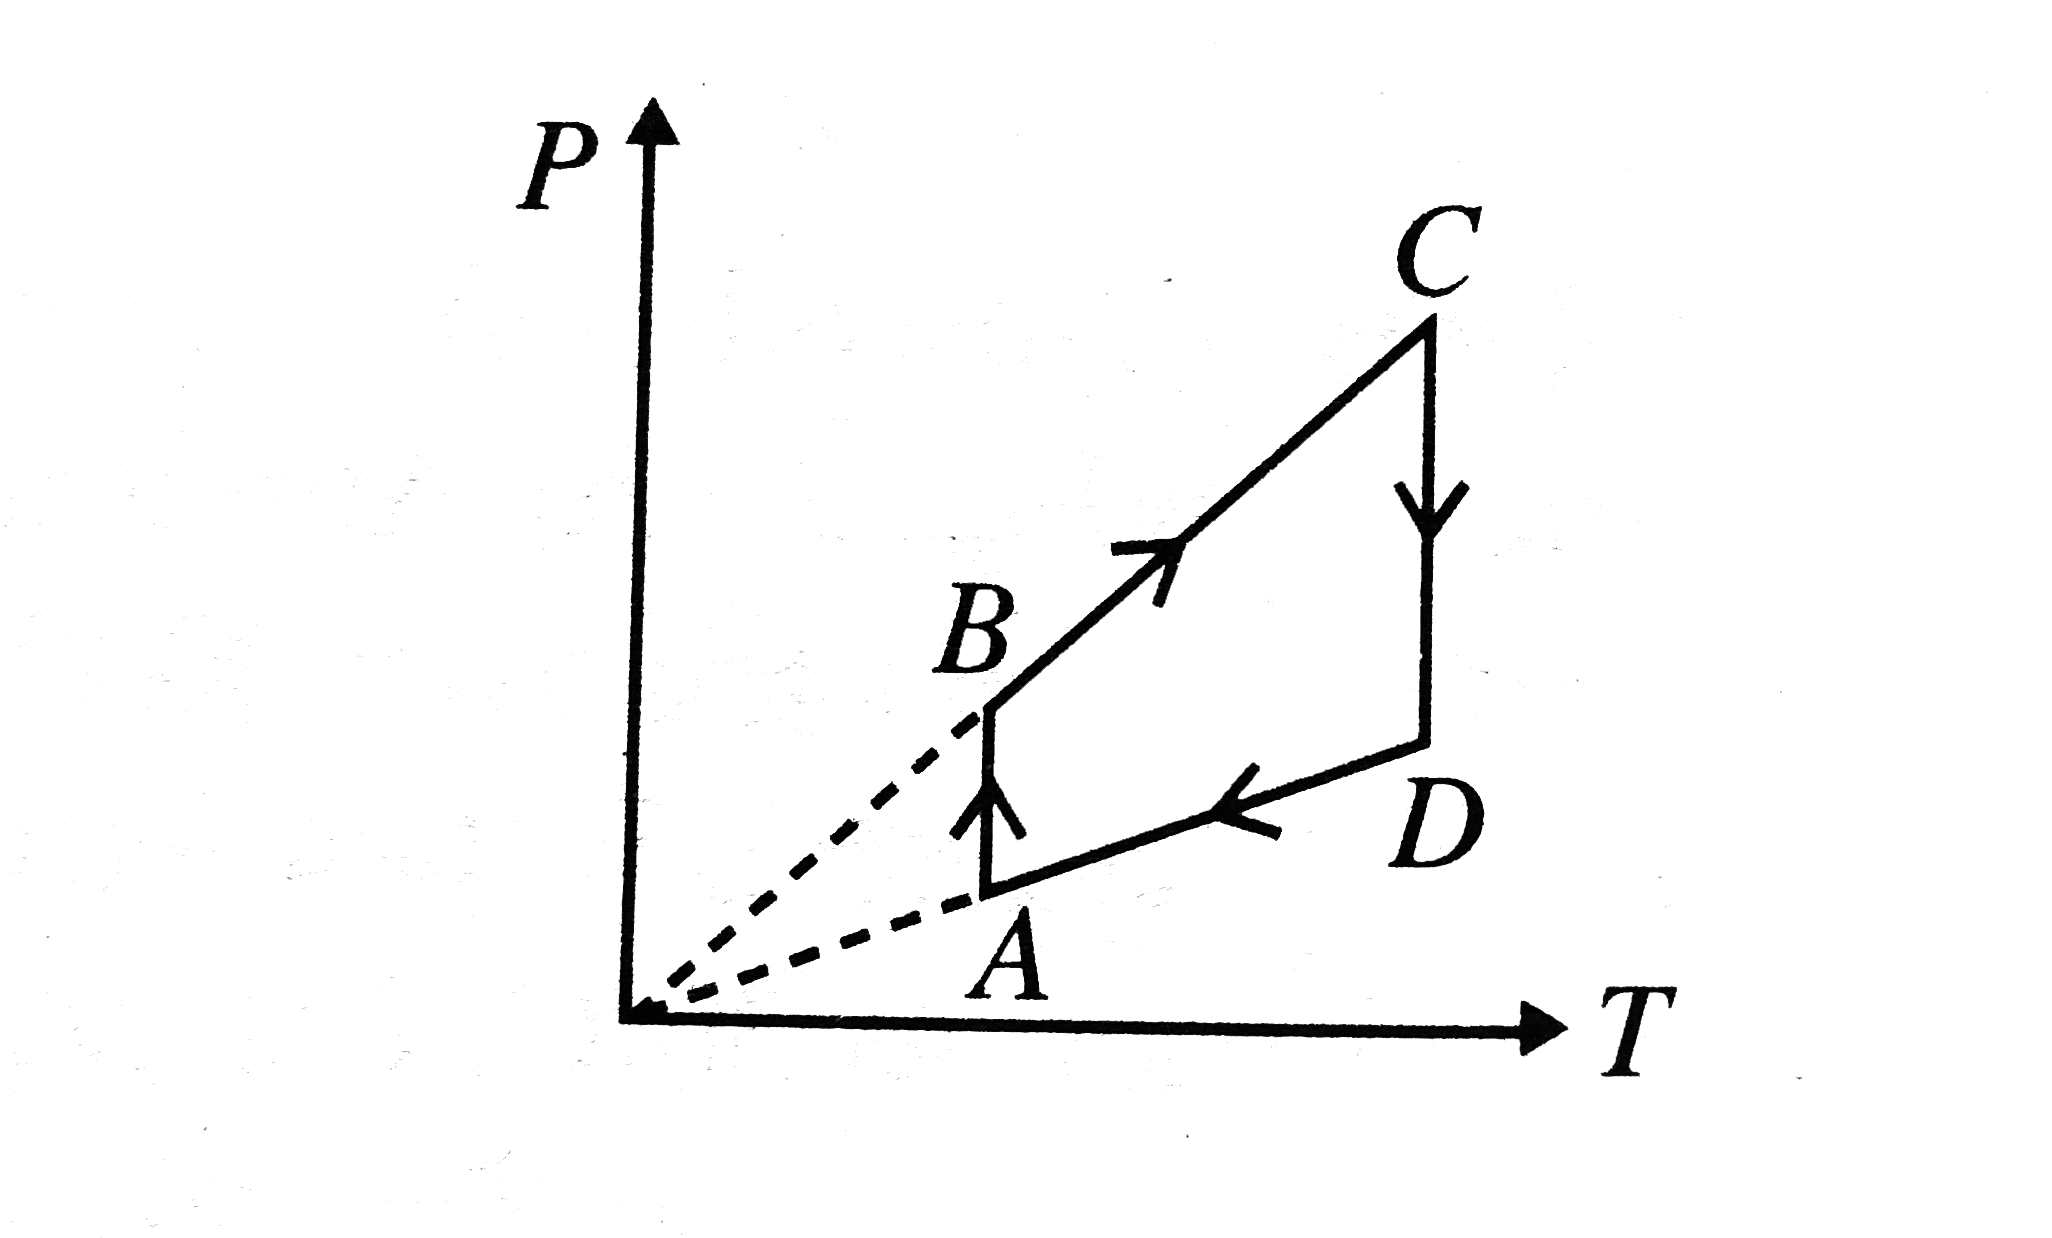
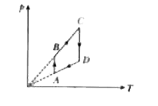
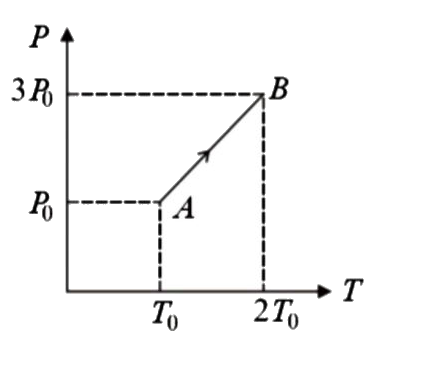
Pressure versus temperature graph of an ideal gas as shown in Fig.
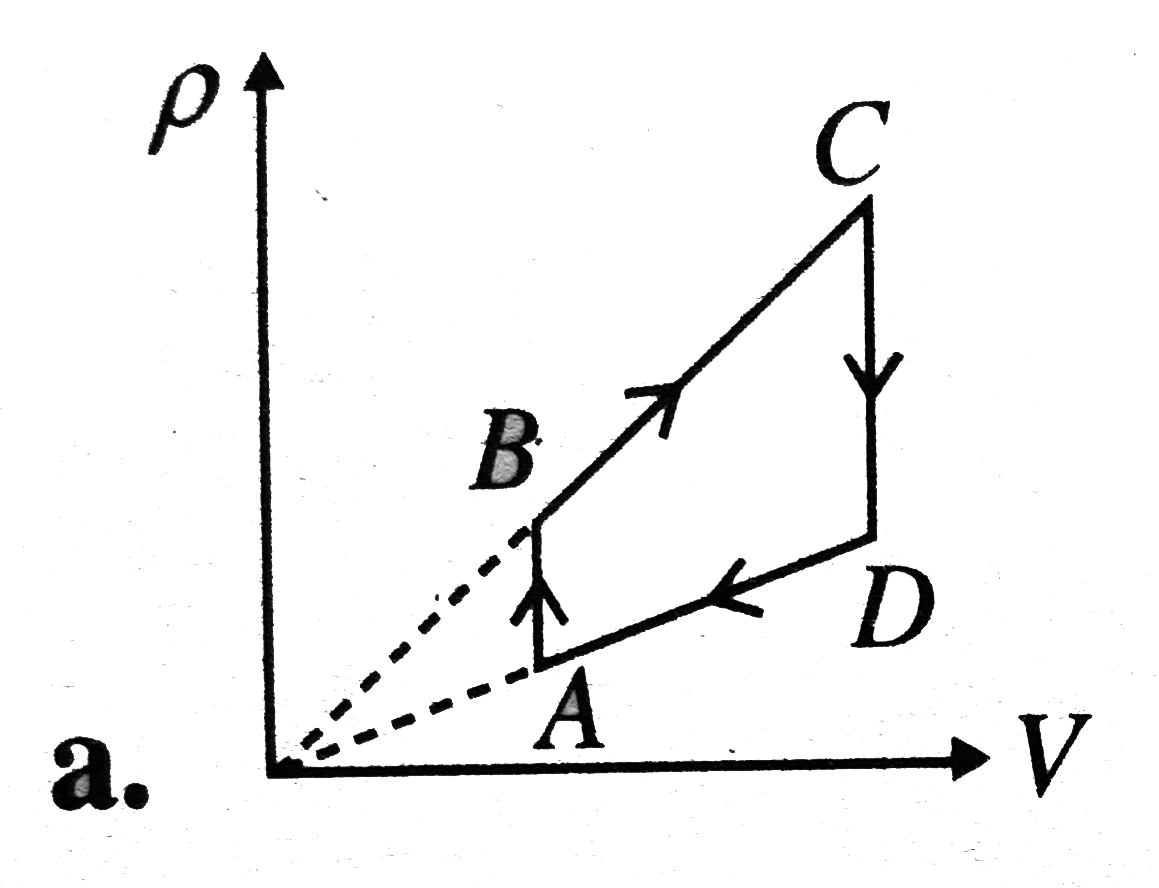
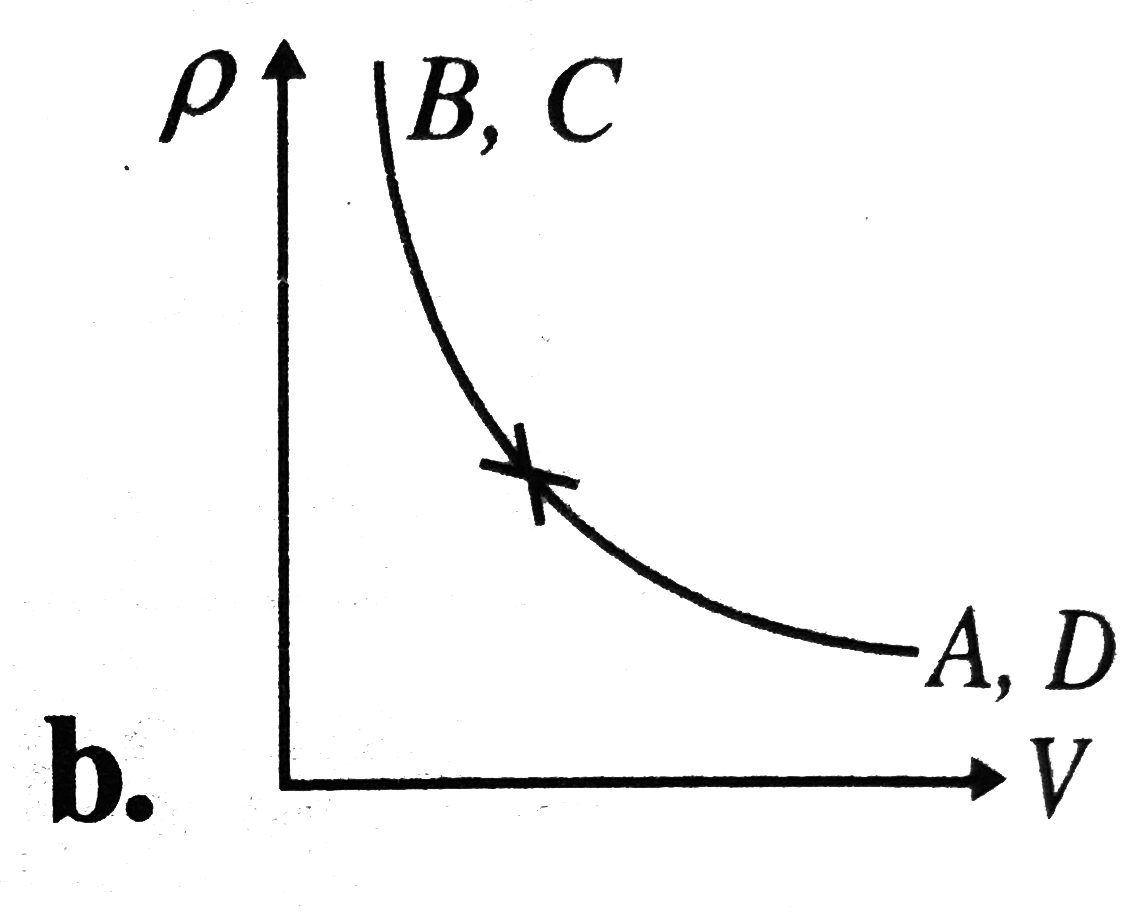
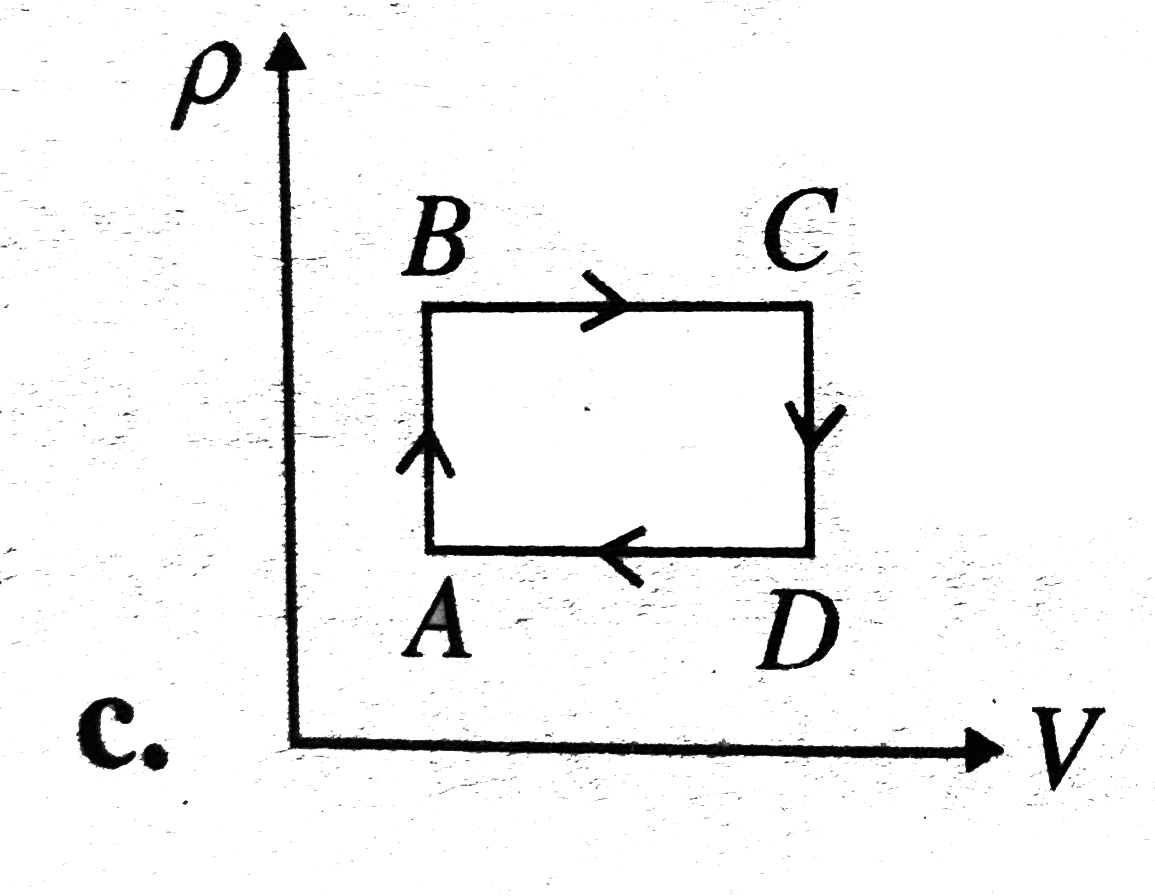
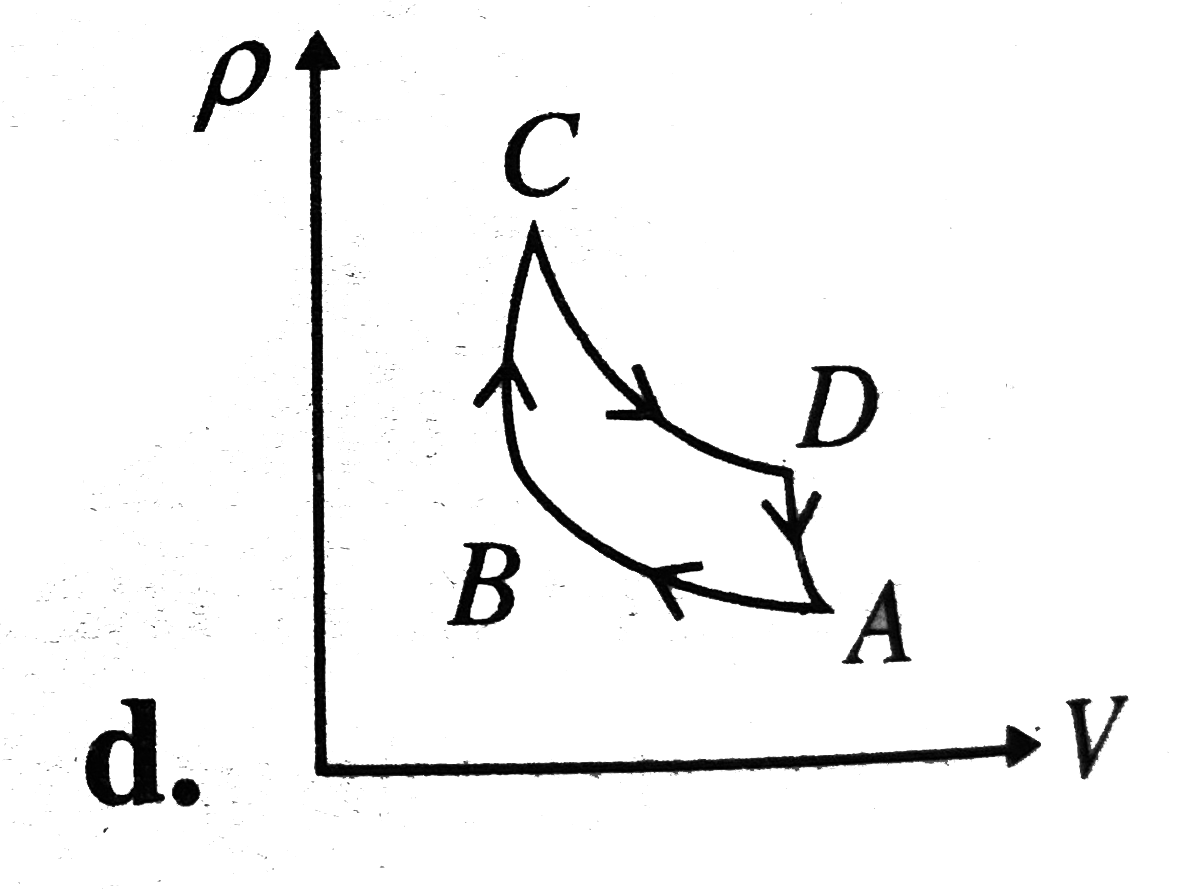
Corresponding density (ρ) versus volume (V) graph will be
The correct Answer is:B
b. Process AB is an isothermal process, i.e., P∝1/V and since ρ∝1/V, ρ−V graph will be a rectangular hyperbola. Pressure is increasing, therefore, volume will increase. Process BC is an isochoric process. Therefore, V= constant and since ρ=m/V, density is also constant, i.e.,ρ−V graph is a dot. Process CD is inverse of process AB and process DA is inverse is BC.
Topper's Solved these Questions
- KINETIC THEORY OF GASES AND FIRST LAW OF THERMODYNAMICSBOOK - CENGAGE PHYSICSCHAPTER - KINETIC THEORY OF GASES AND FIRST LAW OF THERMODYNAMICSEXERCISE - Multiple Corrects
29 Videos
- KINETIC THEORY OF GASES AND FIRST LAW OF THERMODYNAMICSBOOK - CENGAGE PHYSICSCHAPTER - KINETIC THEORY OF GASES AND FIRST LAW OF THERMODYNAMICSEXERCISE - Assertion-Reasoning
6 Videos
- KINETIC THEORY OF GASES AND FIRST LAW OF THERMODYNAMICSBOOK - CENGAGE PHYSICSCHAPTER - KINETIC THEORY OF GASES AND FIRST LAW OF THERMODYNAMICSEXERCISE - Subjective
22 Videos
- KINETIC THEORY OF GASESBOOK - CENGAGE PHYSICSCHAPTER - KINETIC THEORY OF GASESEXERCISE - Compression
2 Videos
- LINEAR AND ANGULAR SIMPLE HARMONIC MOTIONBOOK - CENGAGE PHYSICSCHAPTER - LINEAR AND ANGULAR SIMPLE HARMONIC MOTIONEXERCISE - Multiple Correct Answer Type
9 Videos
Similar Questions
Pressure versus temperature graph of an ideal gas are as shown in figure-2.39. Choose the wrong statement
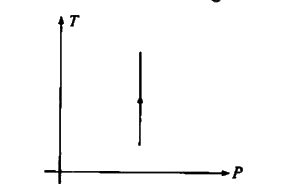
View SolutionPressure (P) versus temperature (T) graph of an ideal gas is shown in the figure. Density of the gas at point A is ρ0 and at B is ρ. Find ρρ0.
'(##CEN_KSR_PHY_JEE_C13_E01_014_Q04##)'
View Solution
Knowledge Check
Pressure versus density graph of an ideal gas is shown in figure
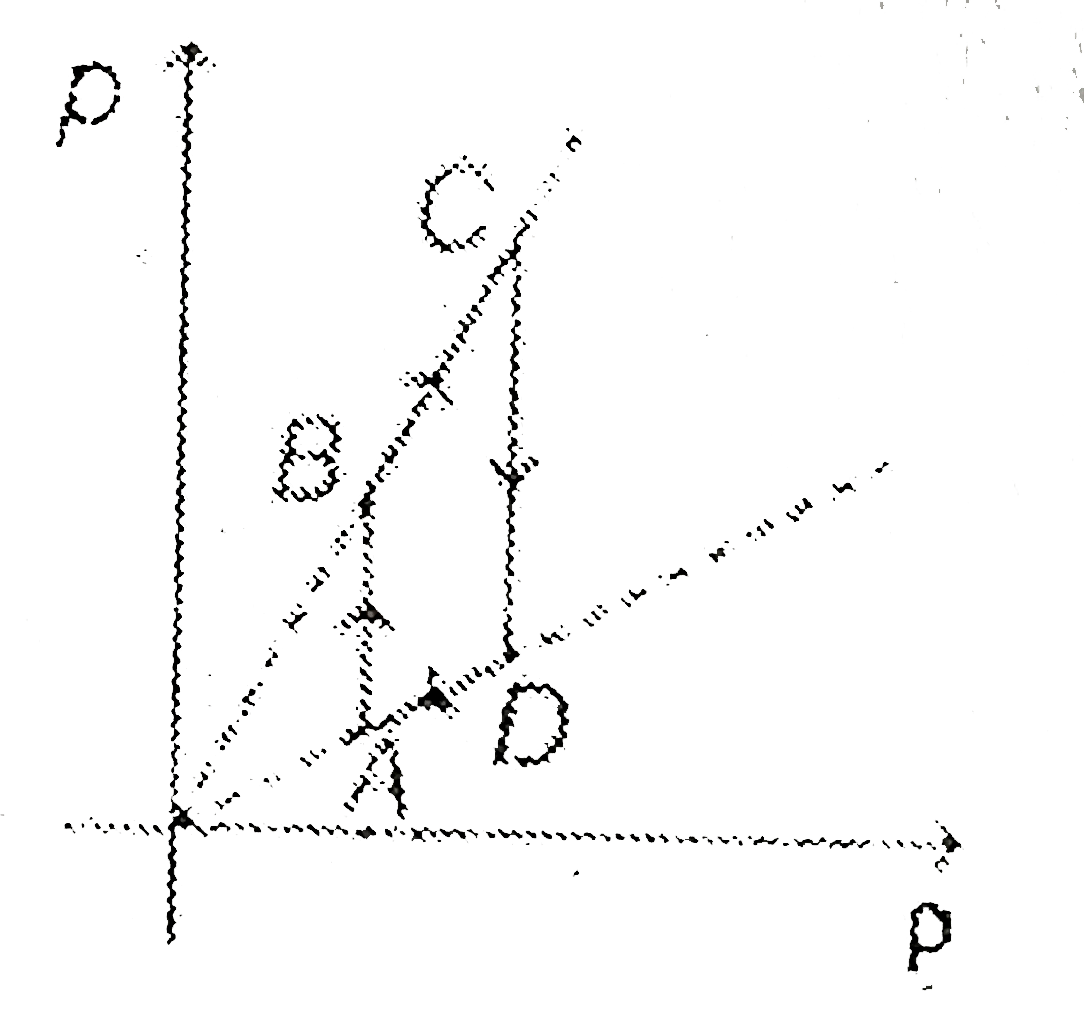 Aduring the process AB work done by the gas is positiveBduring the process AB work done by the gas is negativeCduring the process BC internal energy of the gas is increasingDNone of the above
Pressure versus temperature graphs of an ideal gas are as shown in figure. Choose the wrong statement
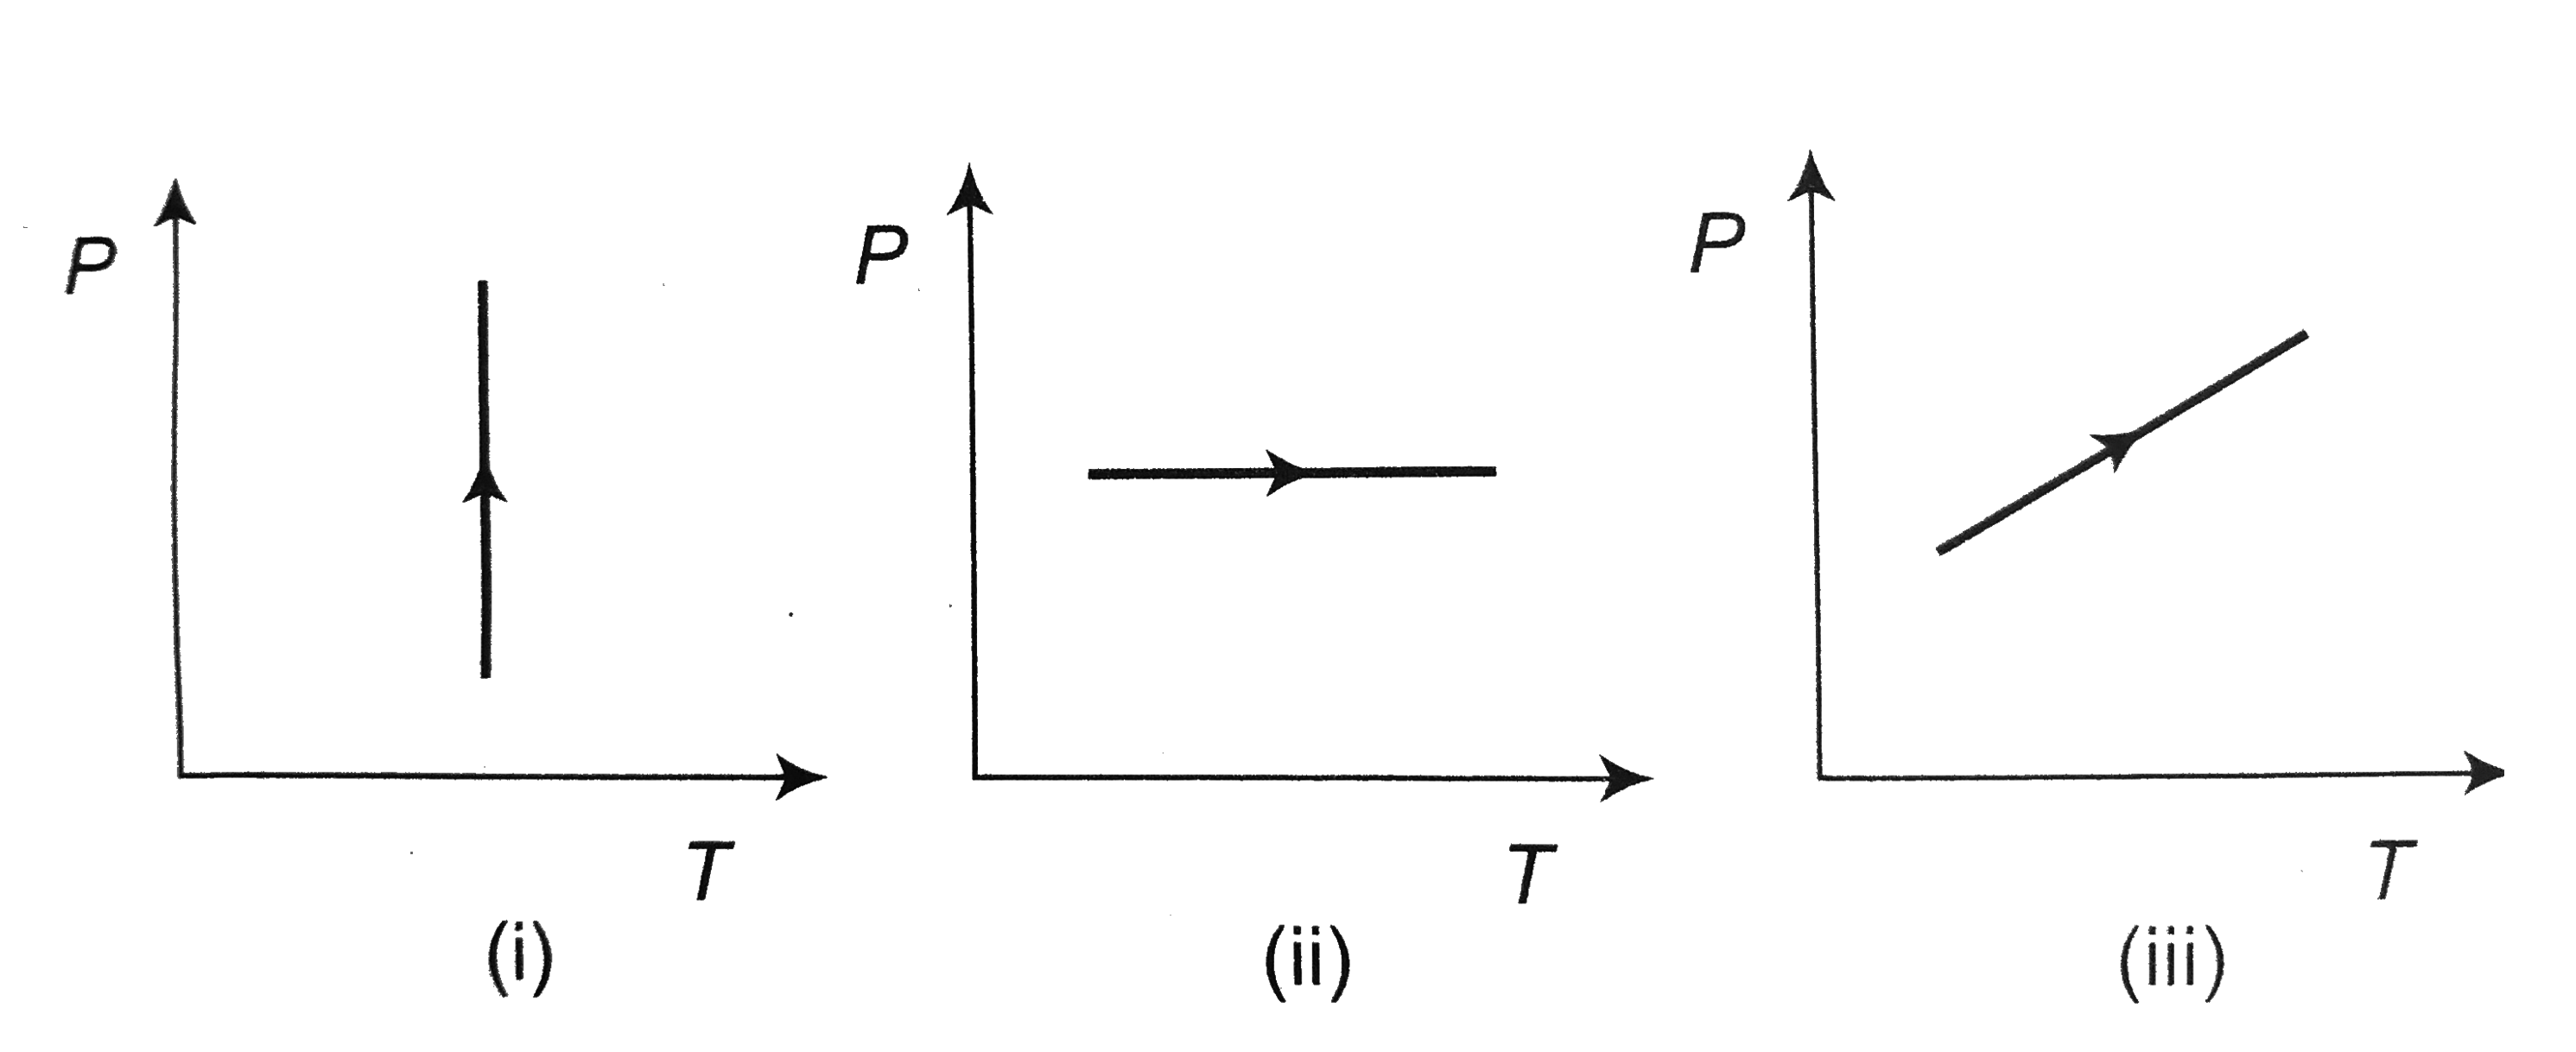 ADensity of gas is increased in graph (i)BDensity of gas is decrease in graph (ii)CDensity of gas is constant in graph (iii)DNone of these
Temperature versus pressure graph of an ideal gas is shown in Fig. During the process AB
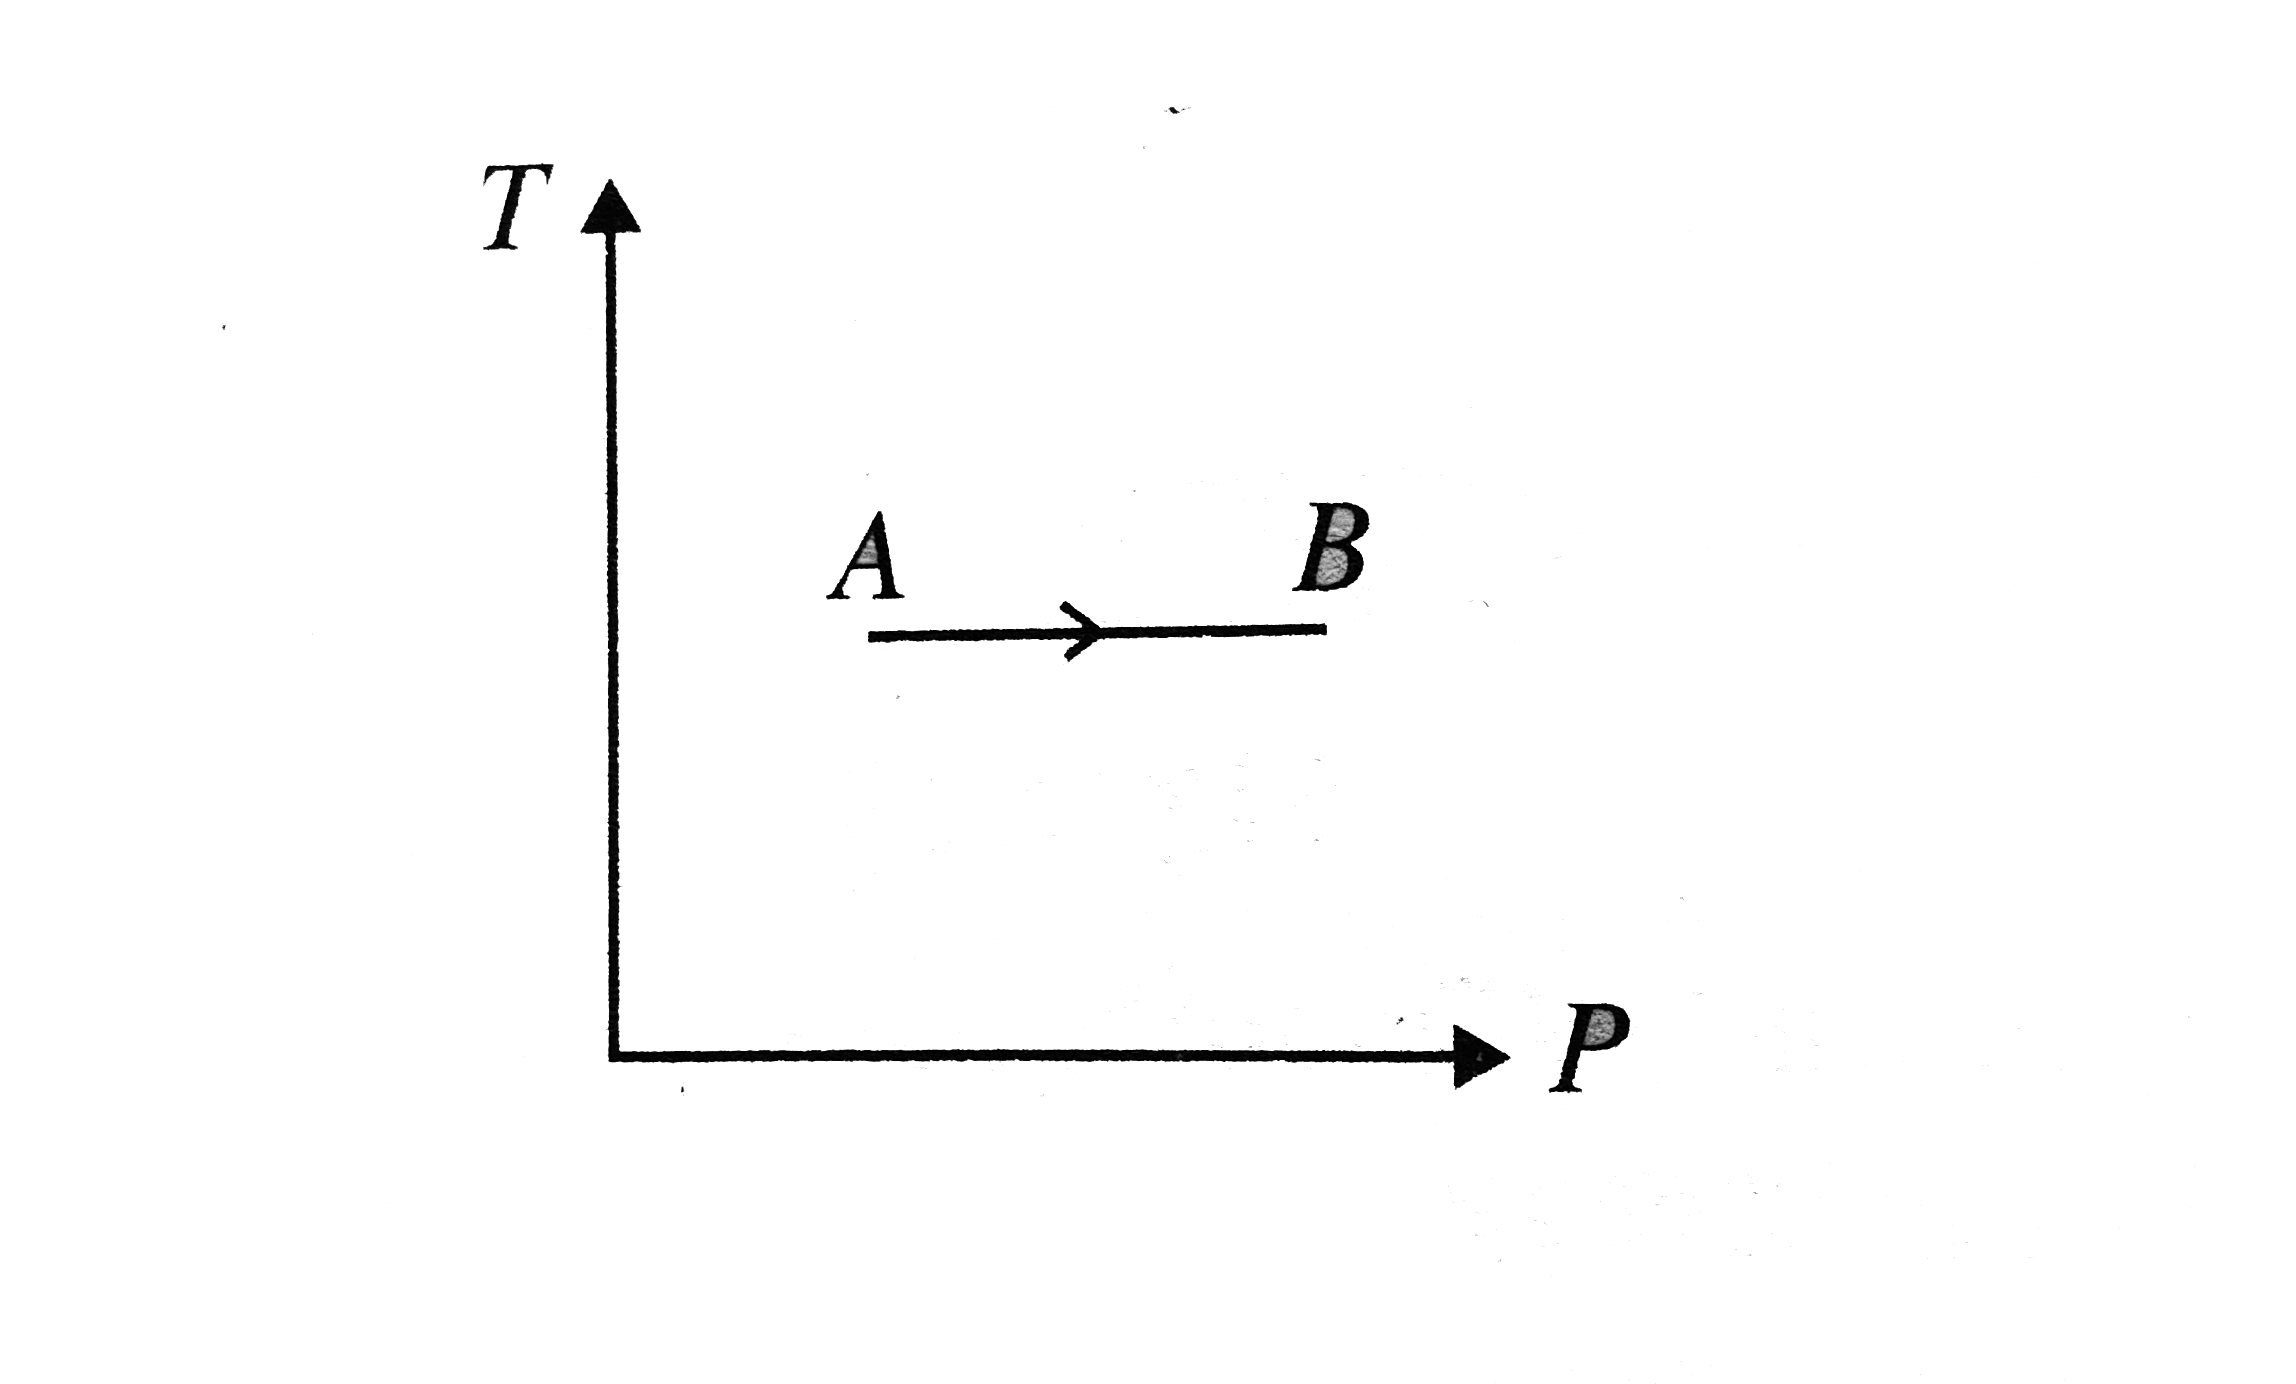 Ainternal energy of the gas remains constantBvolume of the gas is increasedCwork done by the atmosphere on the gas is positiveDpressure is inversely proportional to volume
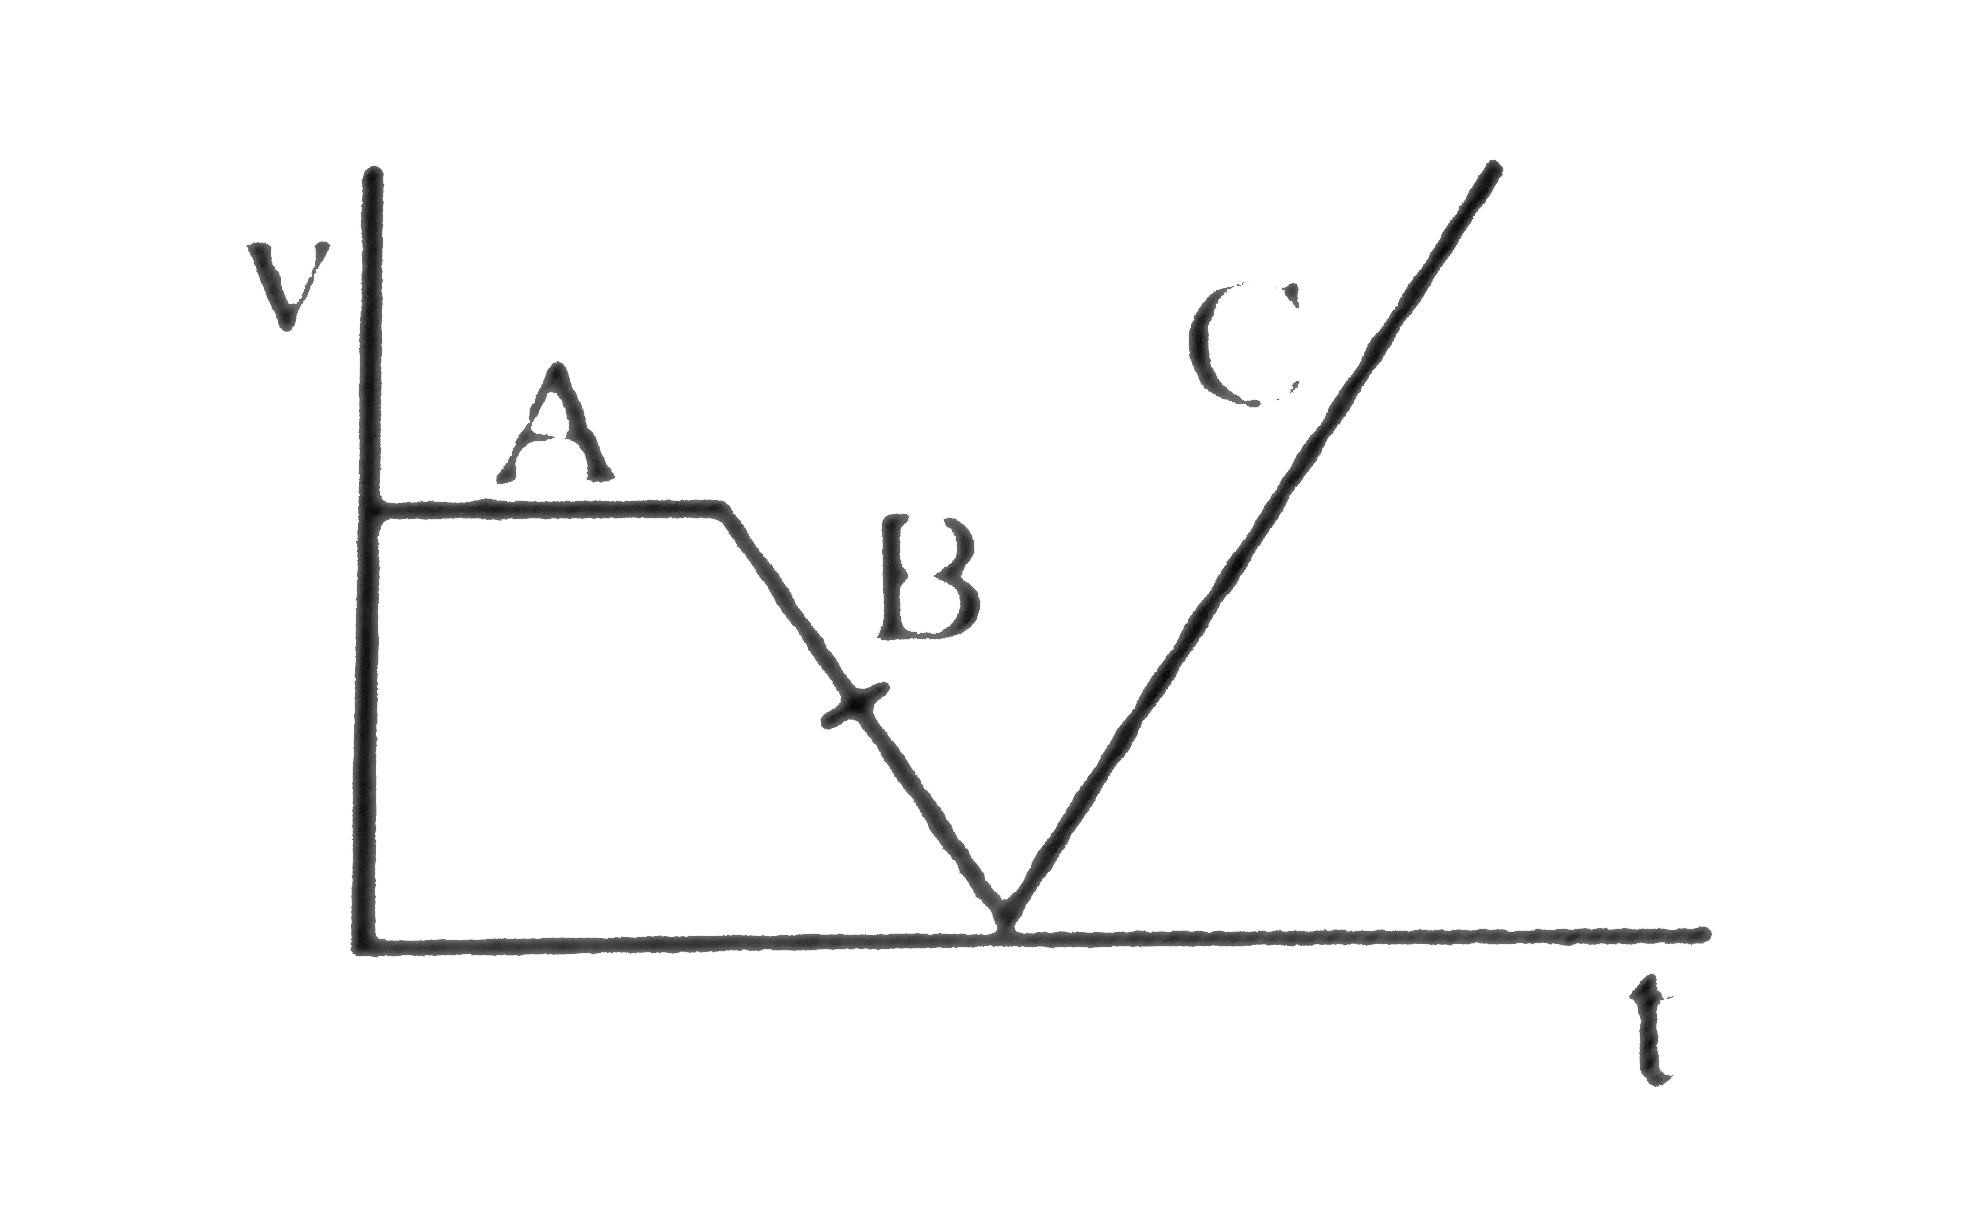
Velocity versus time graph of a body is shown in figure. It explains that
View SolutionPressure temperature (p-1) graph of n moles of an ideal gas is shown in the figure. Among the following four graphs, which are the corresponding pressure volume (p-V) and density pressure (p-p) graphs?
View SolutionPressure versus temperature graph of an ideal gas is shown in figure. Density of the gas at point A is P0. Density at B will be
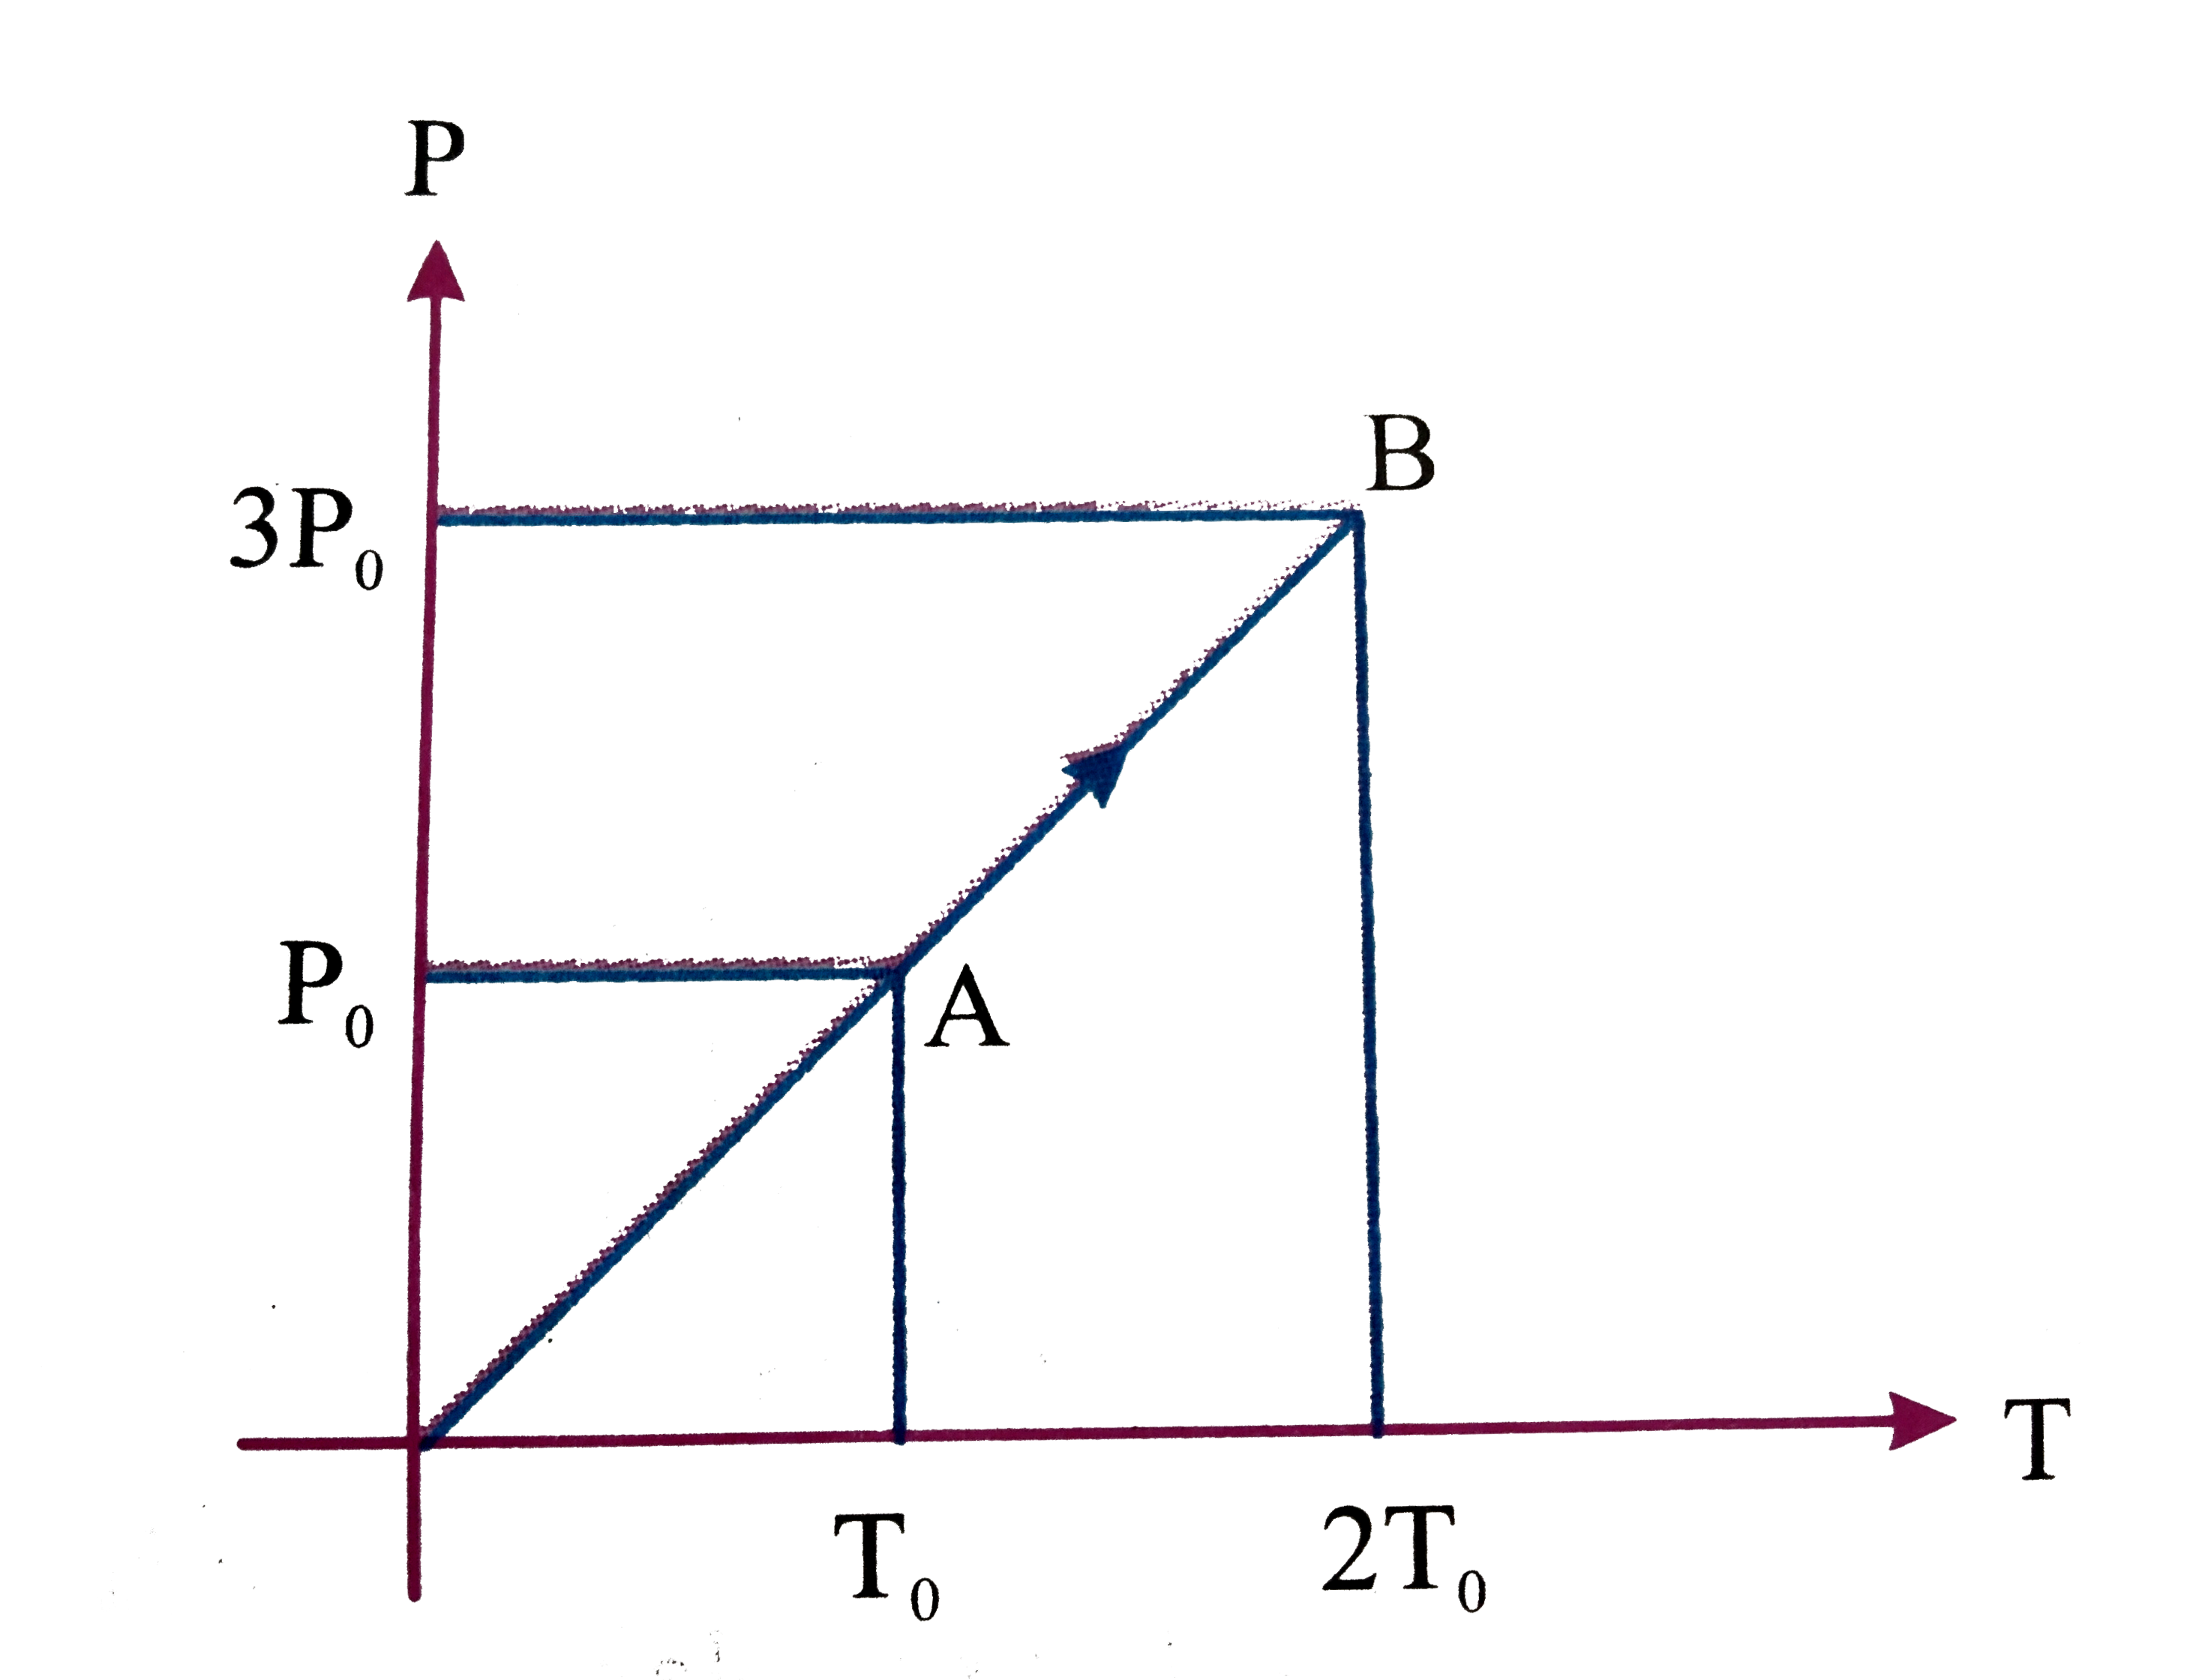
View SolutionPressure versus temperature graph of an ideal gas is as shown in figure. Density of the gas at point A is ρ0. Density at point B will be :-
View SolutionPressure versus temperature graph of an ideal gas is shown in figure. Density of the gas at point A is ρ0. Density at B will be

View Solution
