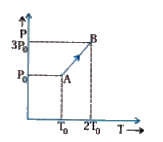
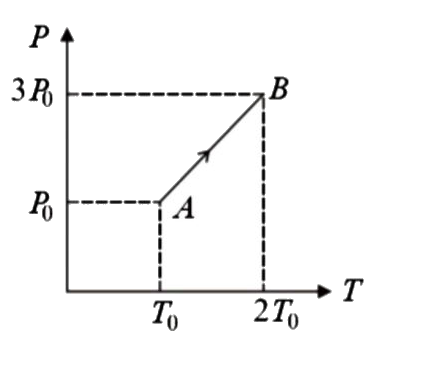
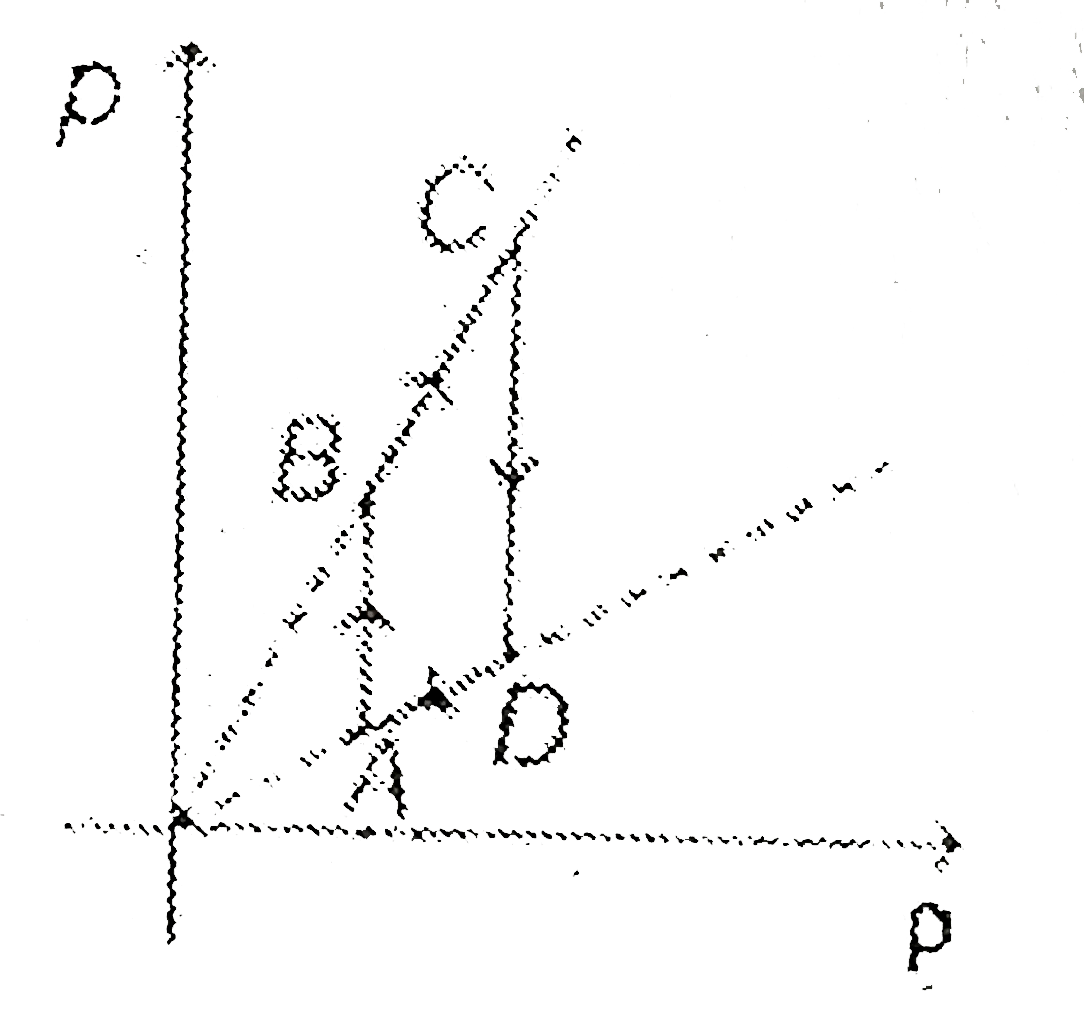
Pressure versus temperature graph of an ideal gas is as shown in figure. Density of the gas at point A is ρ0. Density at point B will be :-
A
34ρ0
B
32ρ0
C
43ρ0
D
2ρ0
Text Solution
The correct Answer is:B
Pρ=RTMW
ρ=PMwRT
ρ∝PT
ρA=ρ0=P0T0
⇒ρB=3P02T0=32ρ0
|
Topper's Solved these Questions
Similar Questions
Knowledge Check
Pressure versus temperature graph of an ideal gas is shown in figure. Density of the gas at point A is P0. Density at B will be
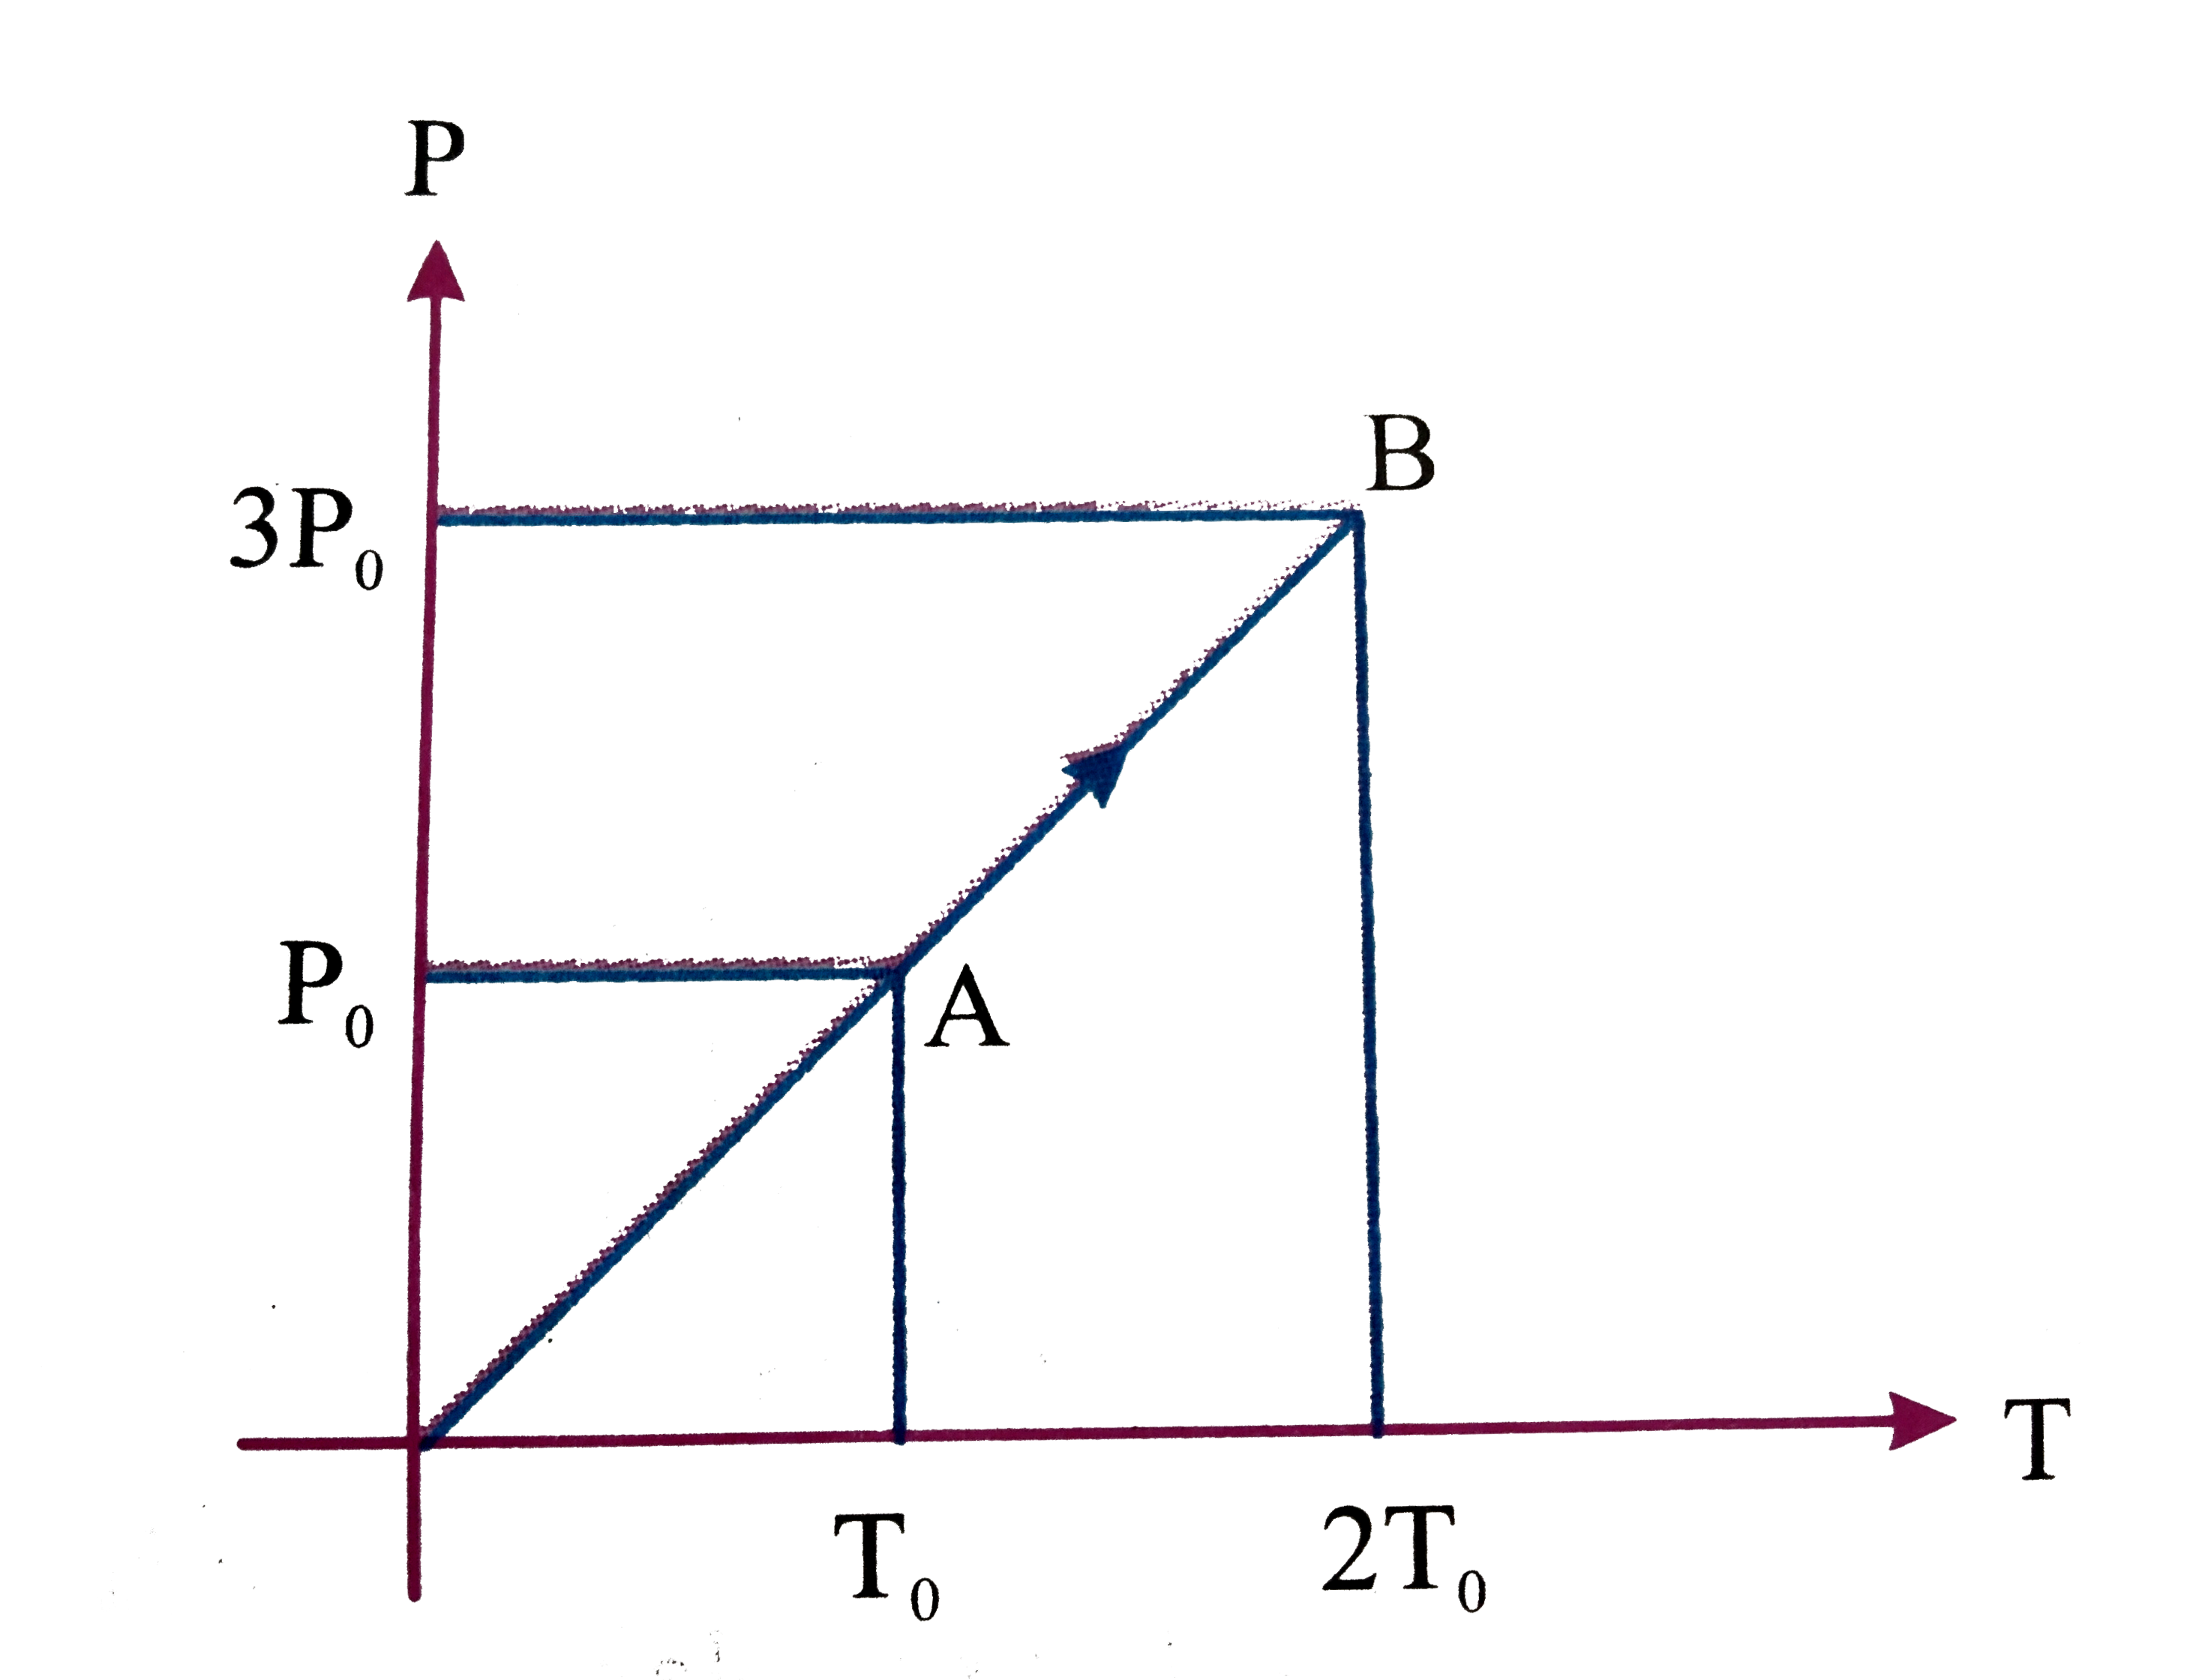 A34ρ0B32ρ0C43ρ0D2ρ0
Pressure versus temperature graph of an ideal gas is shown in figure. Density of the gas at point A is ρ0. Density at B will be
 A2ρ0B23ρ0C32ρ0D3ρ0
Pressure versus temperature graphs of an ideal gas are as shown in figure. Choose the wrong statement
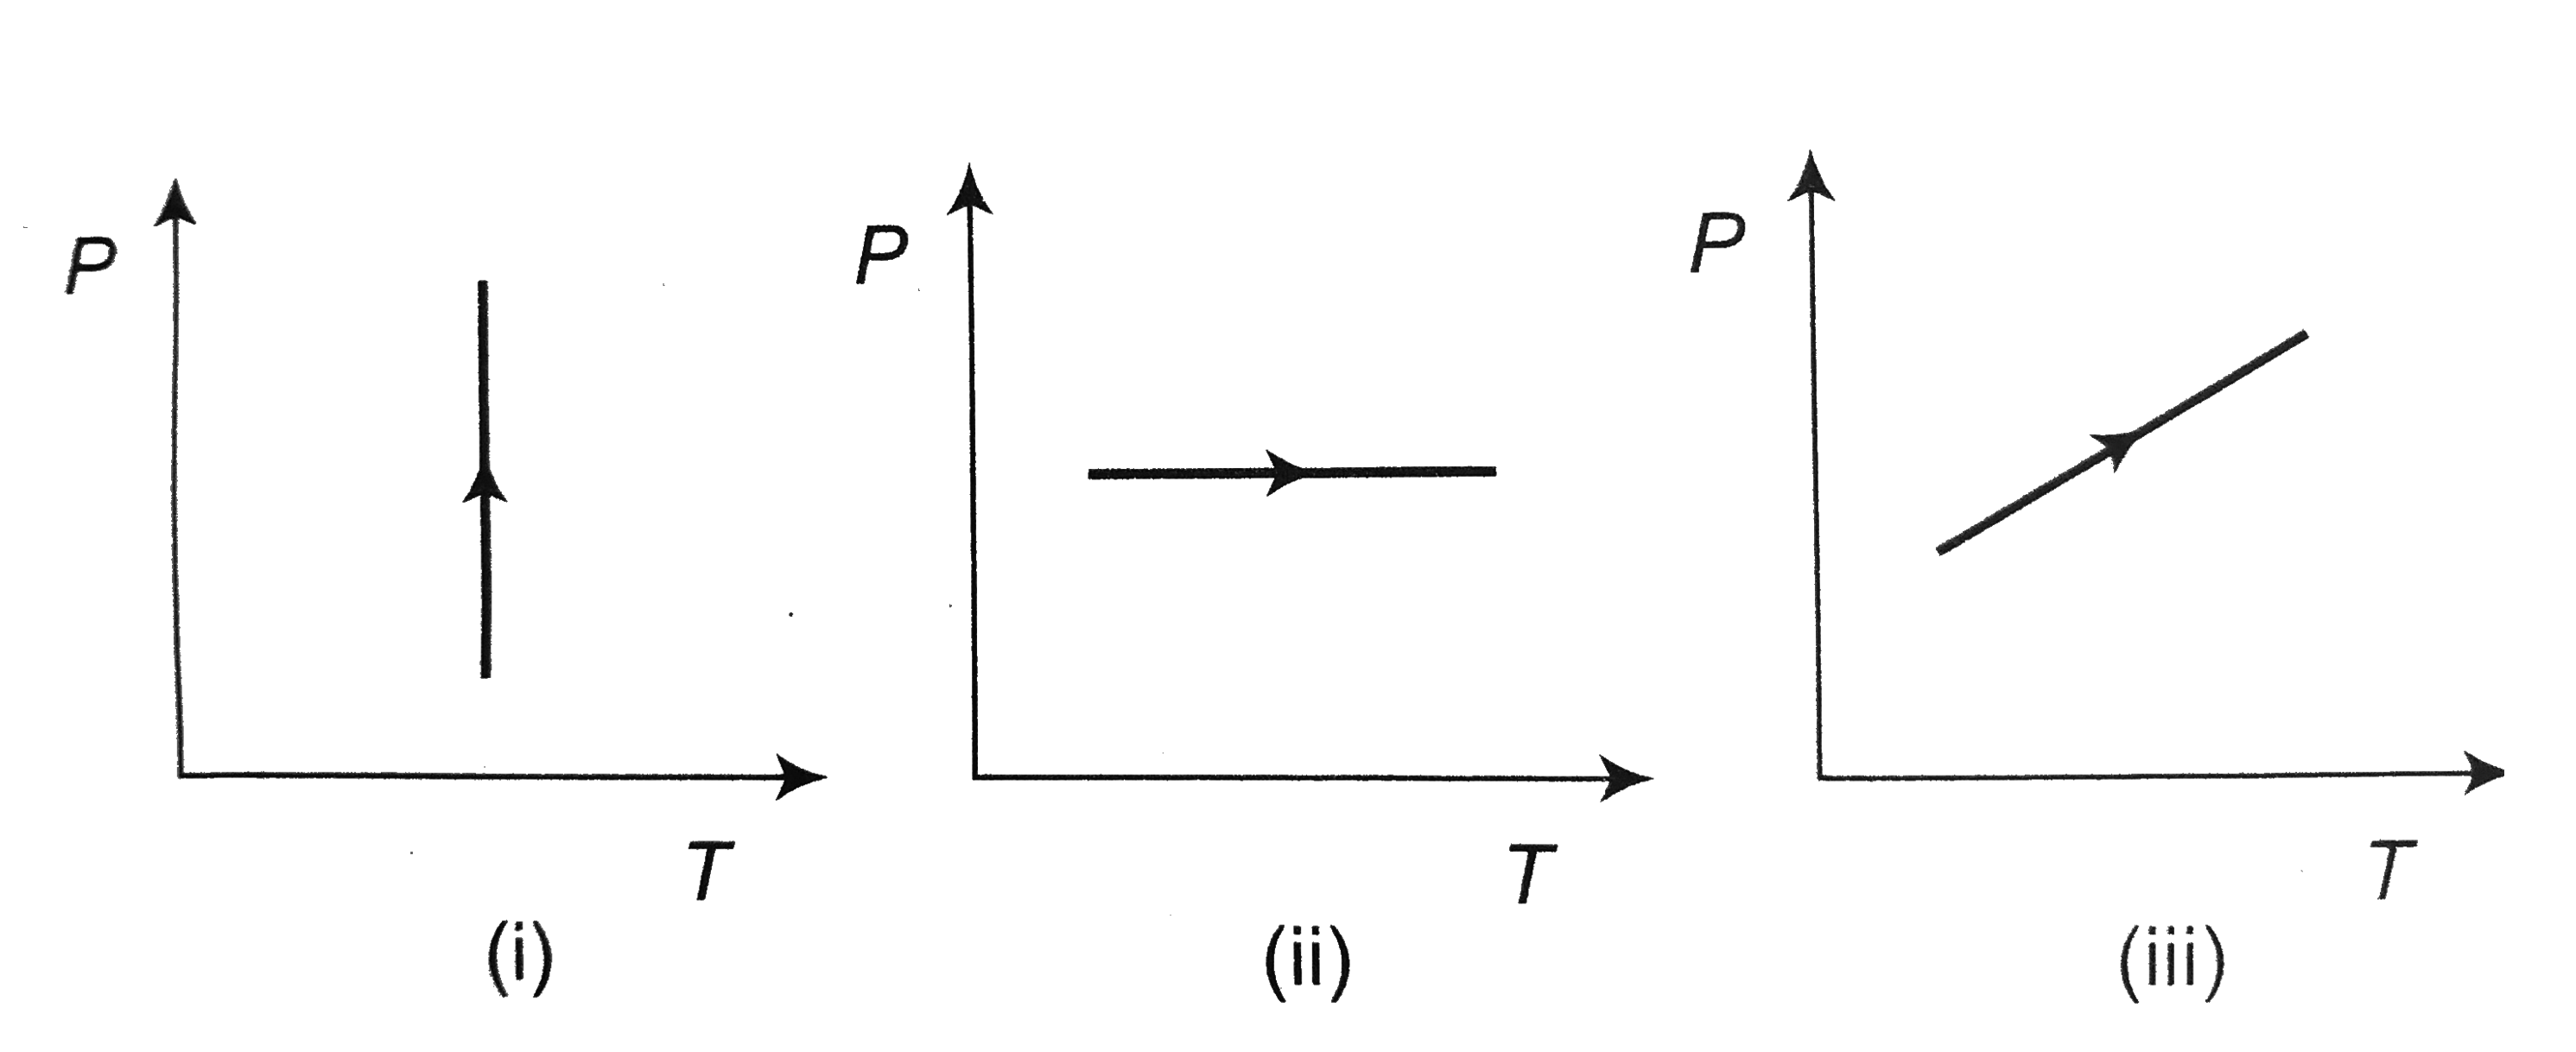 ADensity of gas is increased in graph (i)BDensity of gas is decrease in graph (ii)CDensity of gas is constant in graph (iii)DNone of these
Pressure (P) versus temperature (T) graph of an ideal gas is shown in the figure. Density of the gas at point A is ρ0 and at B is ρ. Find ρρ0.
'(##CEN_KSR_PHY_JEE_C13_E01_014_Q04##)'
View SolutionPressure versus temperature graphs of an ideal gas are as shown in figure. Choose the wrong statement

View SolutionPressure versus temperature graphs of an ideal gas are as shown in figure. Choose the wrong statement

View SolutionPressure versus density graph of an ideal gas is shown in figure
View SolutionPressure versus density graph of an ideal gas is shown in figure

View Solution

