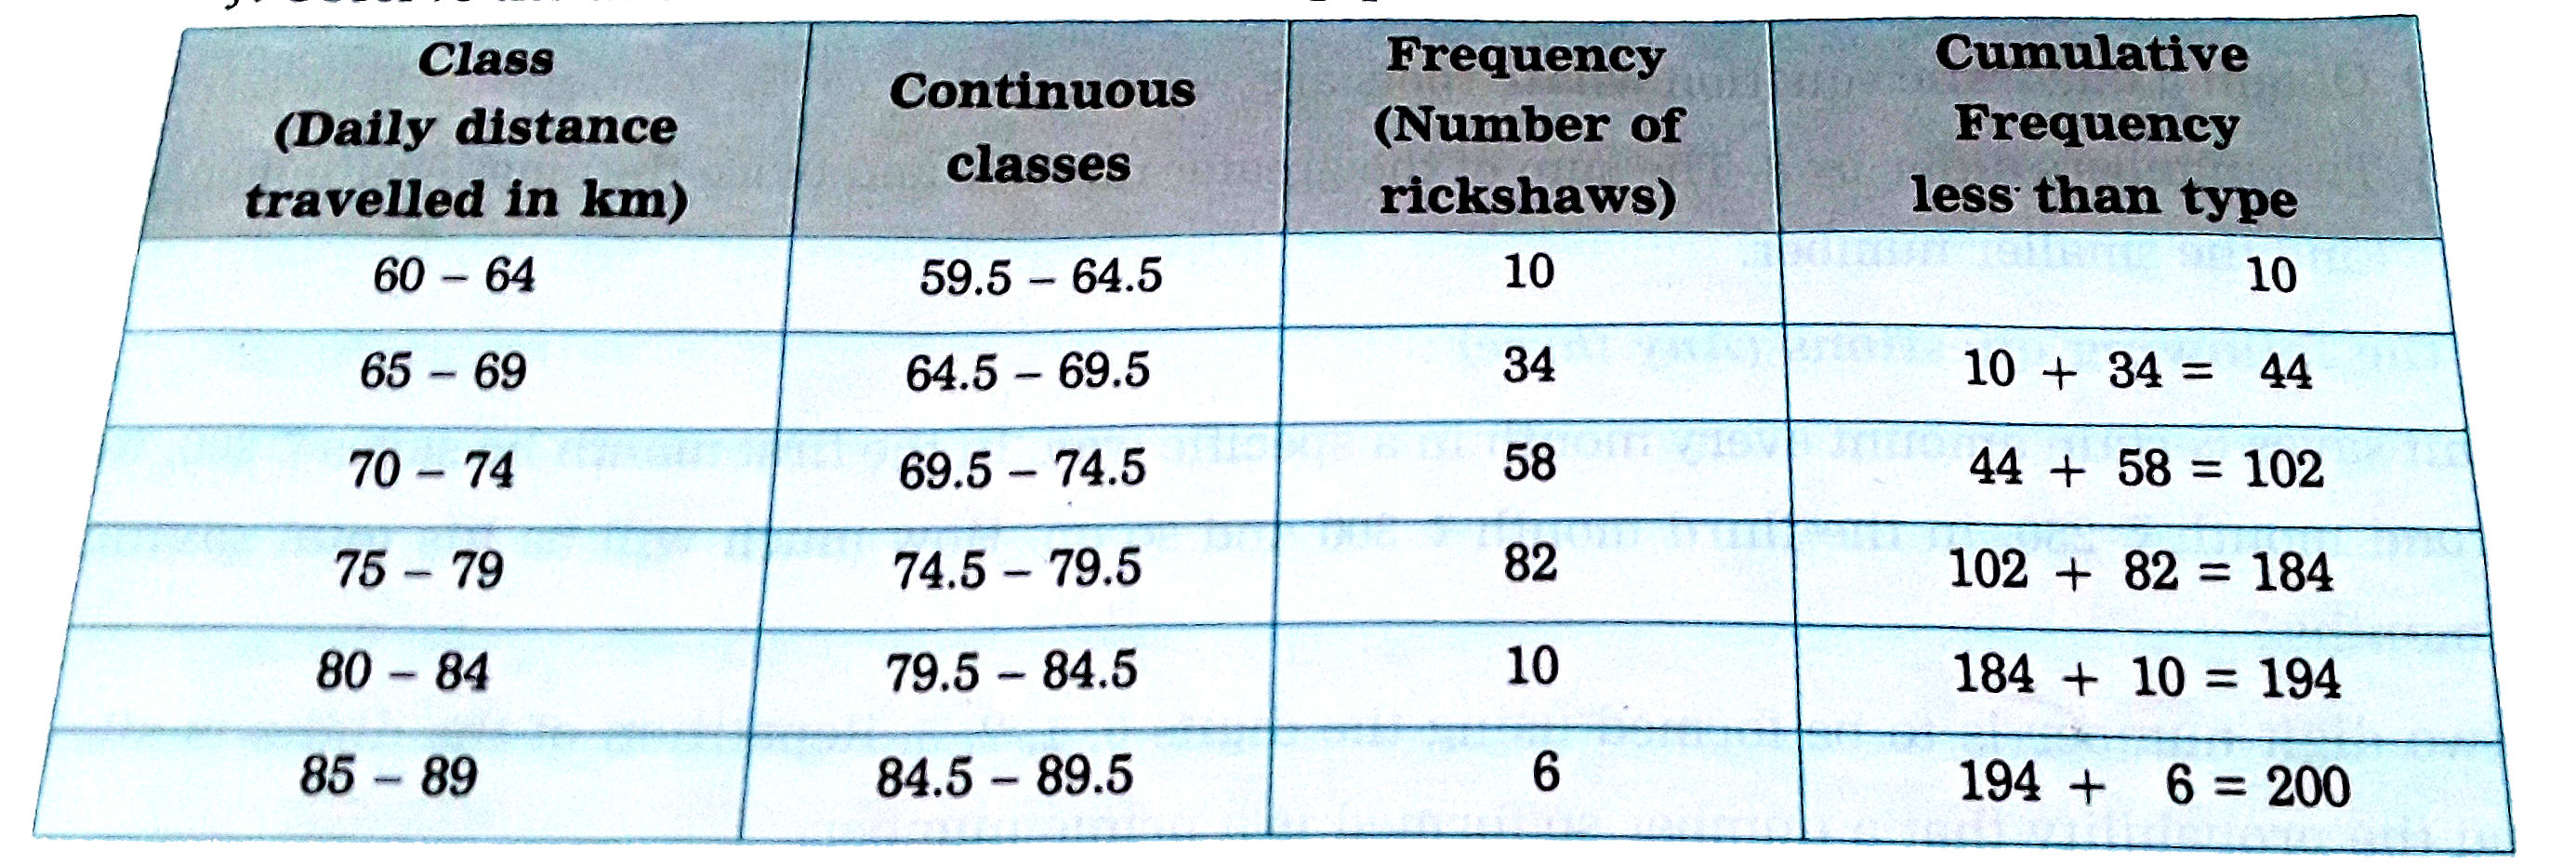
The following frequency distribution table shows the distances travelled by some rickaws in a day .Observe the table and answer the following :

a. Which is the modal class ? Why ?
b. Which is the medium class and why ?
c. Write the cumulative frequency (C.F ) of the preceding the medium class .
d. what is the class interval (h) calculate medium ?
Step by step video & image solution for The following frequency distribution table shows the distances travelled by some rickaws in a day .Observe the table and answer the following : a. Which is the modal class ? Why ? b. Which is the medium class and why ? c. Write the cumulative frequency (C.F ) of the preceding the medium class . d. what is the class interval (h) calculate medium ? by Maths experts to help you in doubts & scoring excellent marks in Class 10 exams.
Updated on:21/07/2023Topper's Solved these Questions
- ALGEBRA MARCH 2019BOOK - GURUKUL PUBLICATION - MAHARASHTRA PREVIOUS YEAR PAPERSCHAPTER - ALGEBRA MARCH 2019EXERCISE - Solve the following questions (Any three):
4 Videos
- ALGEBRA MARCH 2018BOOK - GURUKUL PUBLICATION - MAHARASHTRA PREVIOUS YEAR PAPERSCHAPTER - ALGEBRA MARCH 2018EXERCISE - Attempt any two of the following subquestions:
6 Videos
- GEOMETRY JULY 2017BOOK - GURUKUL PUBLICATION - MAHARASHTRA PREVIOUS YEAR PAPERSCHAPTER - GEOMETRY JULY 2017EXERCISE - Solve any two sub-questions:
5 Videos
Similar Questions
The following frequency distribution table shows the distances travelled by some rickshaws in a day. Observe the table and answer the following question:

(a) which is the modal class? Why?
(b) which is the median class and why?
(c) write the cumulative frequency (c.f.) of the class preceding the median class.
(d) what is the class interval (h) to calculate median?
View SolutionObserve the following frequency distribution table. It shows the distances travelled by 60 public transport buses in a day. Find the median of the distance travelled.

View Solution
Knowledge Check
For the following distribution

the lower limits of the modal class isA15B25C30D35For the following distribution

the modal class isA40-50B20-30C30-40D50-60The table shows distance travelled by three taxies.

Which taxi is not travelling at constant speed ?ATaxi IBTaxi IICTaxi IIIDAll of these
From the frequency distribution table from the following data

View SolutionFor the following distribution :


the modal class is
View SolutionThe following frequency distribution table shows the amount of aid given to 50 flood affected families. Find the mean of the amount of aid.

View SolutionThe following frequency distribution table shows the amount of aid given to 50 flood affected families.Find the mean of the amount of aid.

View SolutionThe following frequency distribution table shows the classification of the number of vehicles and the volume of petrol filled in them. Find the mode of the volume.

View Solution
