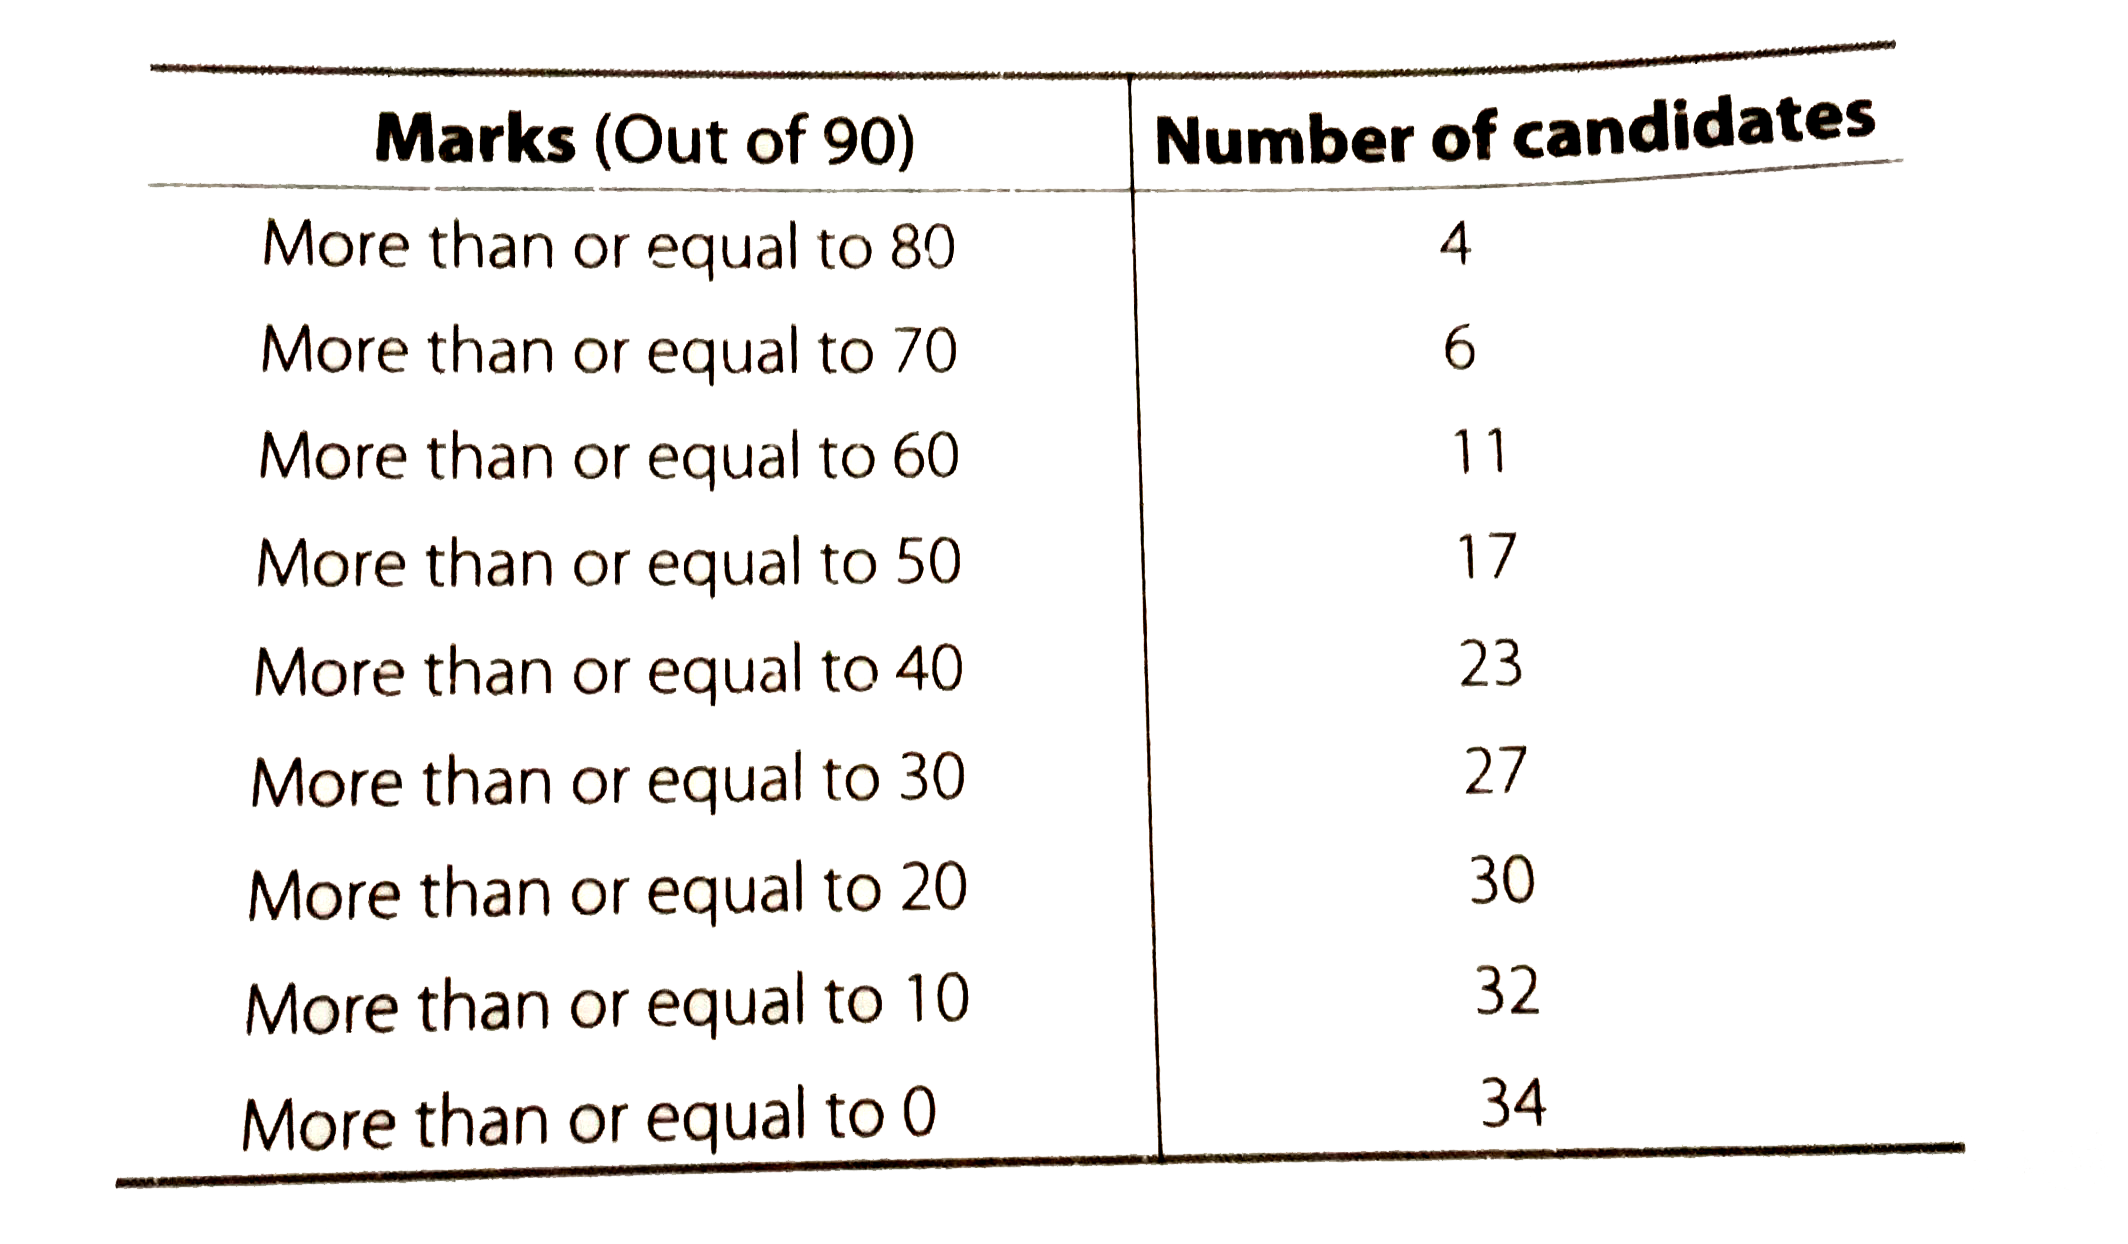
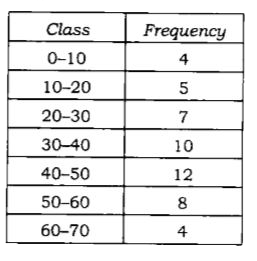
The following frequency distribution table shows the classification of the number of vehicles and the volume of petrol filled in them. Find the mode of the volume.

The correct Answer is:4.55 litres
Step by step video & image solution for The following frequency distribution table shows the classification of the number of vehicles and the volume of petrol filled in them. Find the mode of the volume. by Maths experts to help you in doubts & scoring excellent marks in Class 10 exams.
Topper's Solved these Questions
- BOOK - TARGET PUBLICATIONCHAPTER - STATISTICSEXERCISE - Apply your knowledge5videos
STATISTICS
- BOOK - TARGET PUBLICATIONCHAPTER - STATISTICSEXERCISE - Chapter Assessment15videos
STATISTICS
- BOOK - TARGET PUBLICATIONCHAPTER - STATISTICSEXERCISE - Multiple Choice Questions14videos
STATISTICS
- BOOK - TARGET PUBLICATIONCHAPTER - SIMILARITY EXERCISE - Chapter Assessment19videos
SIMILARITY
- BOOK - TARGET PUBLICATIONCHAPTER - TRIGONOMETRY EXERCISE - Chapter Assessment18videos
TRIGONOMETRY
Similar Questions
The following table shows the classification of number of vehicles and their speeds on Mumbai-Pune express way. Find the median of the data.
 View Solution
The following table shows the classification of number of vehicles and their speeds on Mumbai - Pune expressway. Find the median of the data .
 View Solution
The following table shows the classification of number of vehicles and their speeds on Mumbai-pune express way.Find the median of the data.
 View Solution
The following frequency distribution table shows the amount of aid given to 50 flood affected families. Find the mean of the amount of aid.
 View Solution
From the frequency distribution table from the following data
 View Solution
The following frequency table shows the demand for a sweet and the number of customers. Find the mode of demand of sweet.
 View Solution
Consider the following frequency distribution

What is the mode of the distribution?View SolutionThe following frequency distribution table shows the amount of aid given to 50 flood affected families.Find the mean of the amount of aid.
 View Solution
The following frequency table shows the demand for a sweet and the number of customers. Find the mode of the demand of sweet.
 View Solution
The following frequency table shows the demand for a sweet and the number of customers. Find the mode of the demand of sweet.
 View Solution

