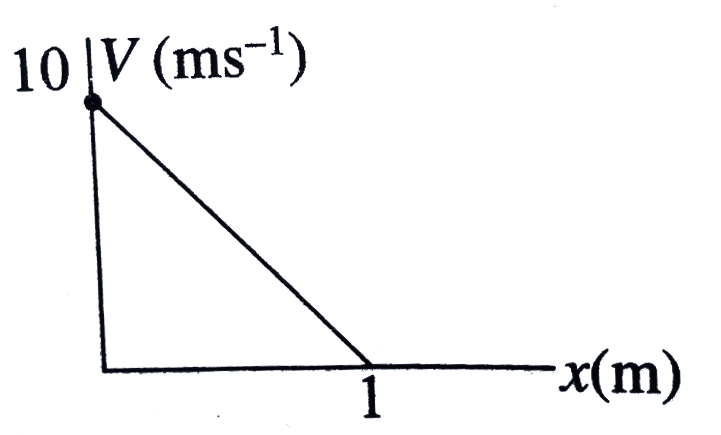
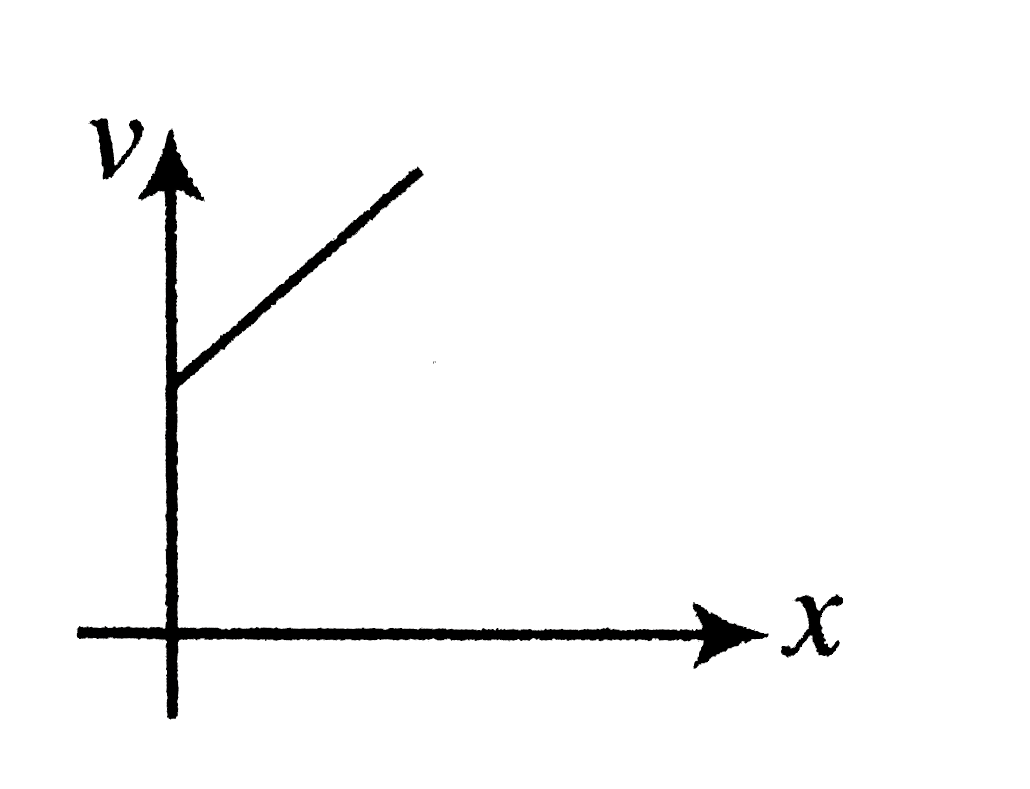
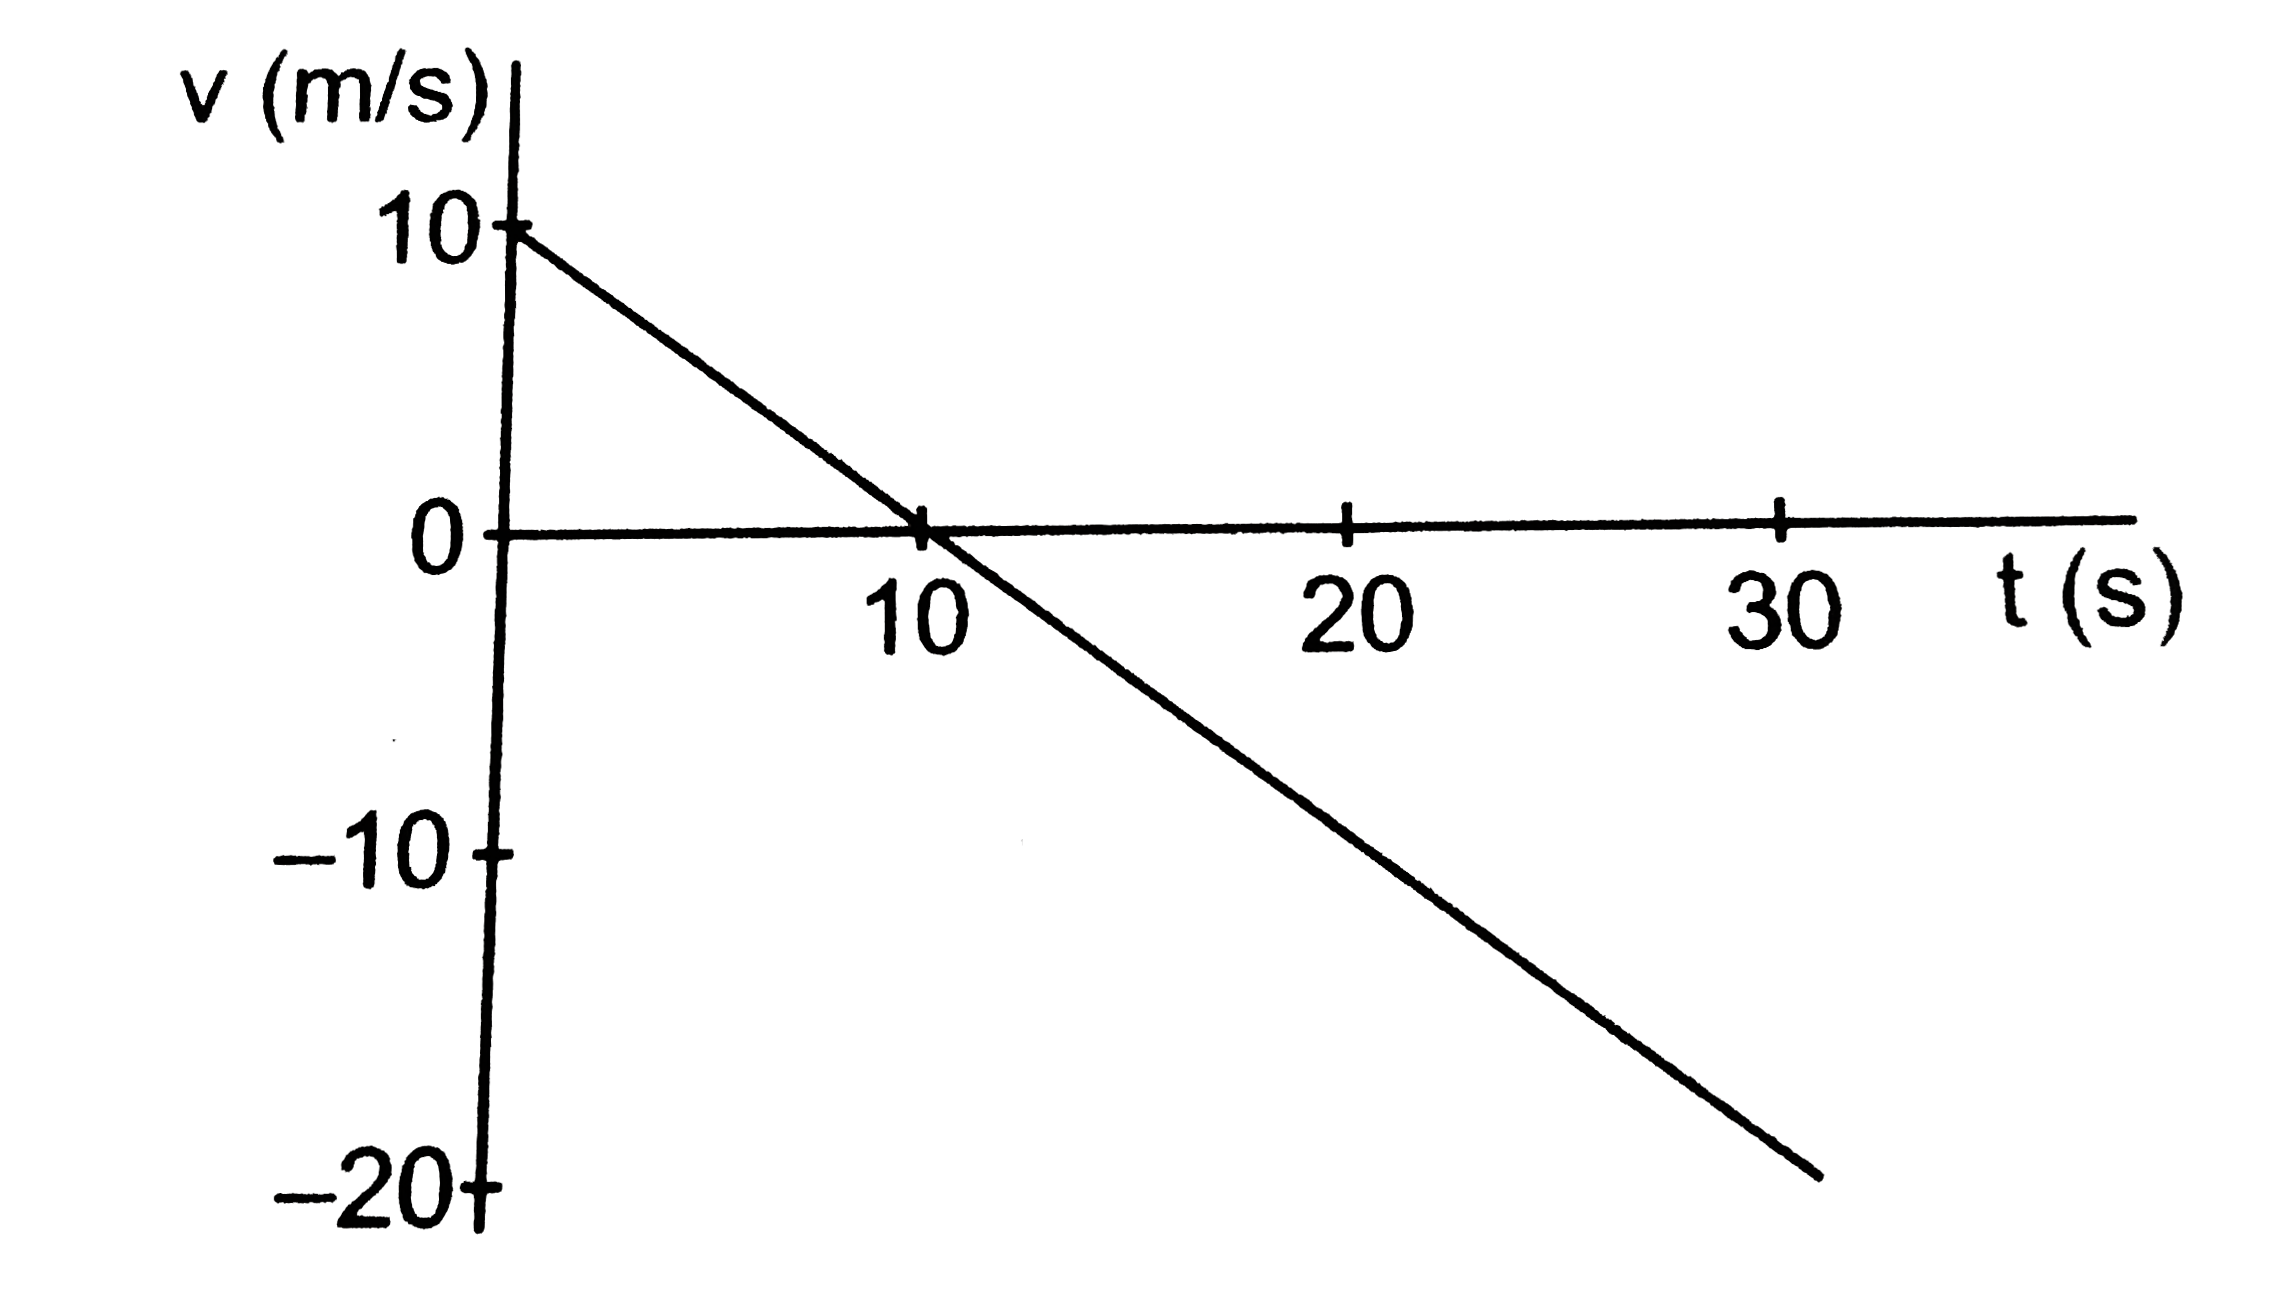
The velcocity displacement graph of a particle moving along a straight line is shown in figure. The velocity as function of x(0≤x≤1) is
A
−10x
B
−10x+10
C
10x−10
D
−10x2+10x+10
Video Solution
Text Solution
The correct Answer is:B
The standard equation of straight line is
y=mx+c ∵ v=mx+c
at x=0,v=10ms
10=m×0+c or c=10
or v=mx+10
At x=1,v=0
0=m×1×10
or m=−10
v=−10x+10
|
Topper's Solved these Questions
- CENGAGE PHYSICS DPPBOOK - CENGAGE PHYSICSCHAPTER - CENGAGE PHYSICS DPPEXERCISE - Fill in the blanks type
26 Videos
- CENGAGE PHYSICS DPPBOOK - CENGAGE PHYSICSCHAPTER - CENGAGE PHYSICS DPPEXERCISE - Comprehension Type
31 Videos
- CENGAGE PHYSICS DPPBOOK - CENGAGE PHYSICSCHAPTER - CENGAGE PHYSICS DPPEXERCISE - Multiple Correct Answer Type
54 Videos
- CAPACITOR AND CAPACITANCEBOOK - CENGAGE PHYSICSCHAPTER - CAPACITOR AND CAPACITANCEEXERCISE - Integer
5 Videos
- CENTRE OF MASS CONVERSATION OF MOMENTUM AND COLLISIONBOOK - CENGAGE PHYSICSCHAPTER - CENTRE OF MASS CONVERSATION OF MOMENTUM AND COLLISIONEXERCISE - Question Bank
38 Videos
Similar Questions
Knowledge Check
Velocity displacement graph of a particle moving in a straight line is as shown in figure.
 Amagnitude of acceleration of particle is decreasingBmagnitude of acceleration of particlre is increasingCacceleration versus displacement graph straight lineDacceleration versus displacement graph is parabola
Displacement time graph of a particle moving in a straight line is a shown in figure.
 Ain region A acceleration is positiveBin region B acceleration is negativeCin region C acceleration is positiveDin region D acceleration is negative
The velocity displacement graph of a particle moving along a straight line is shown in figure.
Then the acceleration displacement graph is.A B
B C
C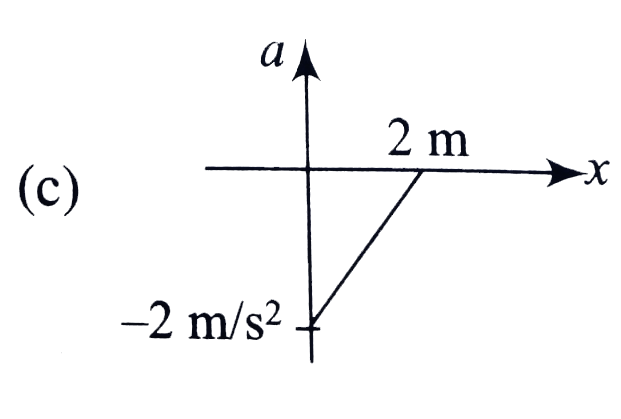 D
D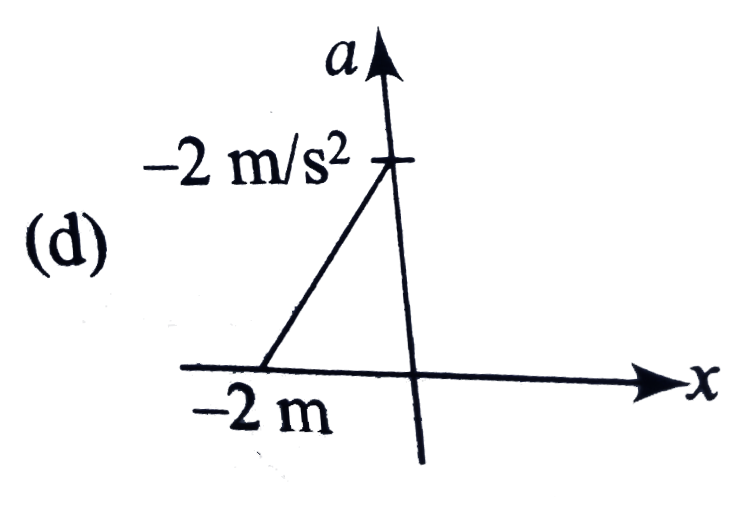
Velocity versus displacement graph of a particle moving in a straight line as shown in figure.
The acceleration of the particle.
View SolutionThe velocity-time plot for a particle moving on a straight line is shown in figure.
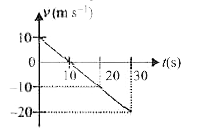
View SolutionThe velocity- time plot for a particle moving on a straight line is shown in the figure
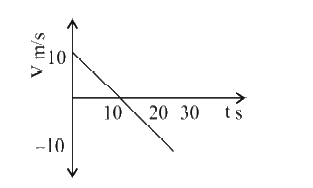
View SolutionThe velocity time plot for a particle moving on straight line is shown in the figure.
View SolutionThe variation of velocity of a particle moving along a straight line is shown in . is
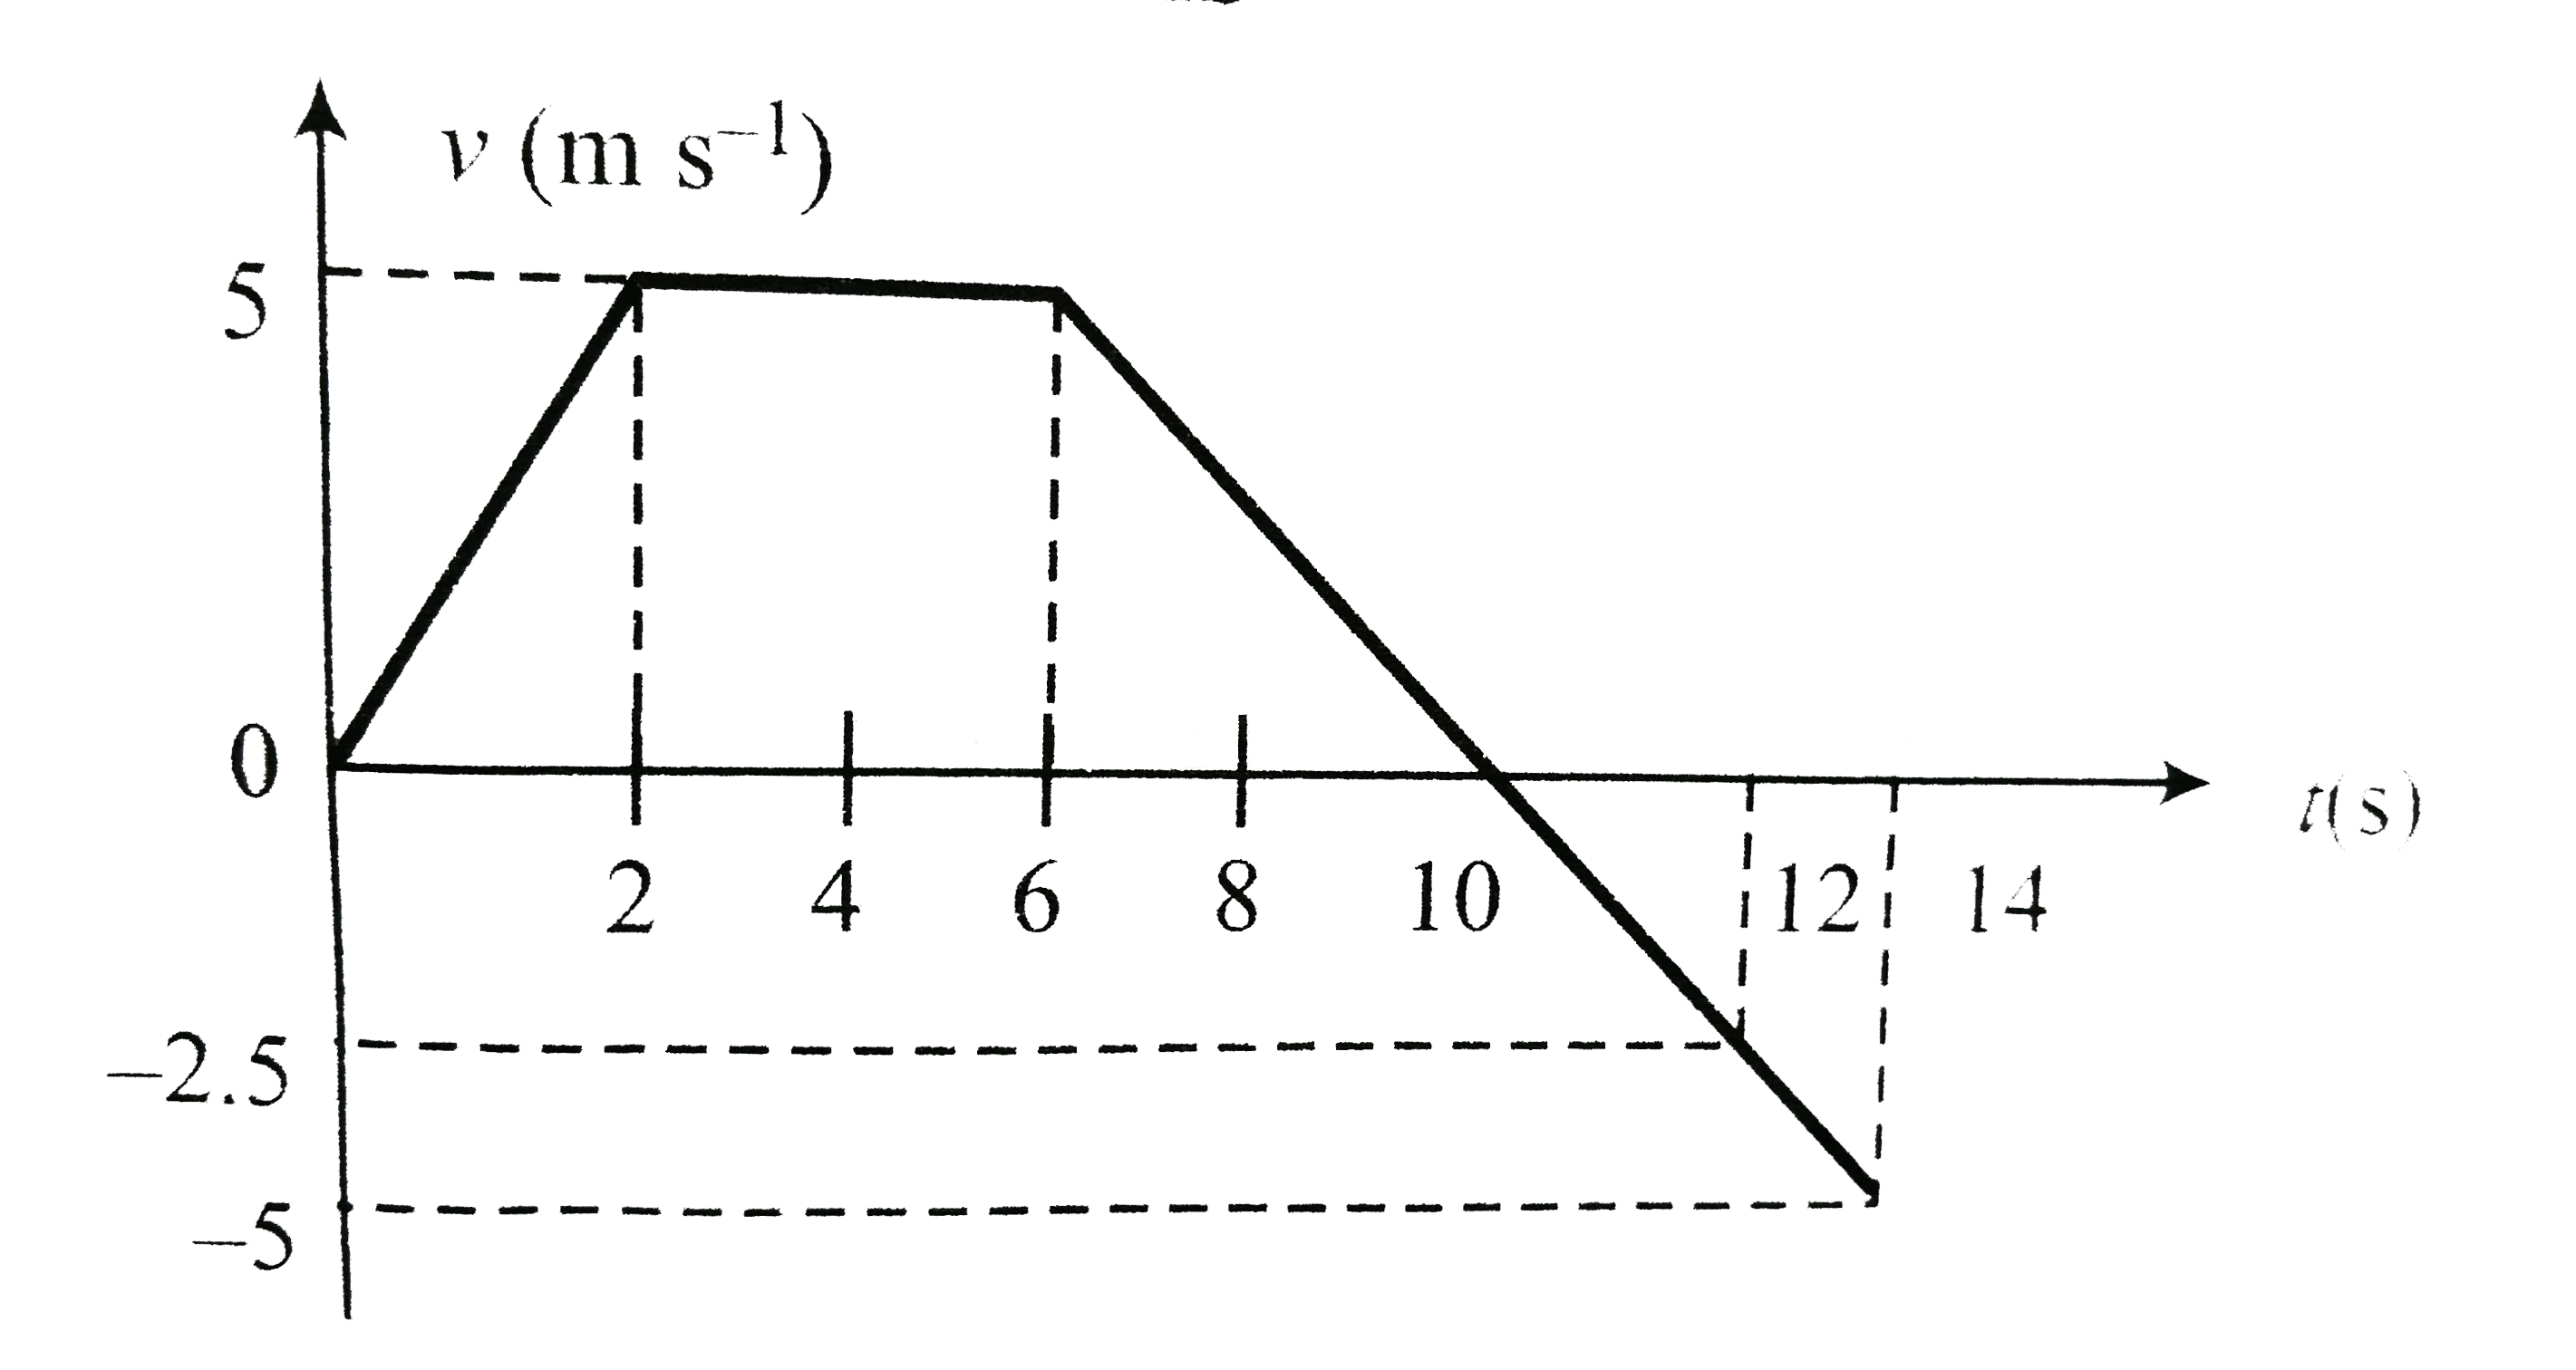 .
.
View Solution
