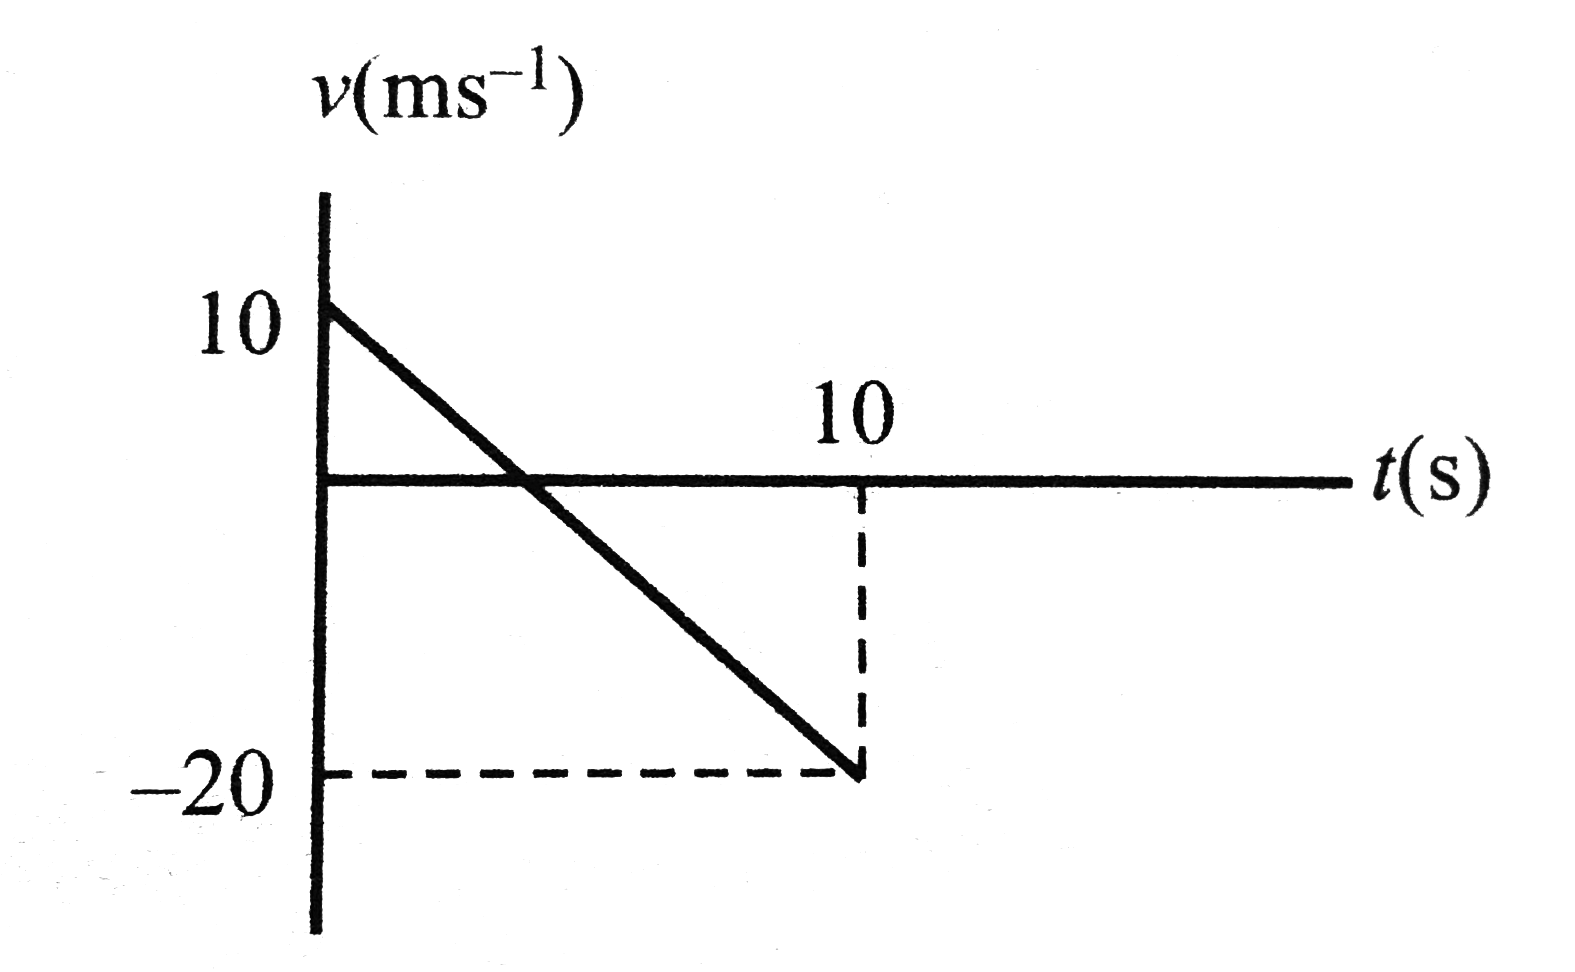
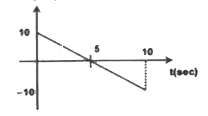
The velocity- time plot for a particle moving on a straight line is shown in the figure
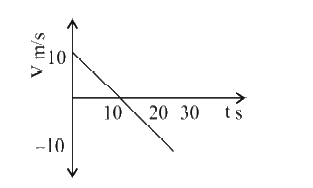
the particle has a non uniform acceleration
the particle has never turned around
the particle has zero displacement
the average speed in the interval 0 to 10 s is the same as the average speed in the interval 10 s to 20 s
The correct Answer is:D
Step by step video, text & image solution for The velocity- time plot for a particle moving on a straight line is shown in the figure by Physics experts to help you in doubts & scoring excellent marks in Class 12 exams.
Similar Questions
Knowledge Check
- Question 1 - Select One or More
The velocity time plot for a particle moving on straight line is shown in the figure.
 AThe particle has a constant accelerationBThe particle has nevedr turned aroundCThe paeticle has zero displacement.DThe average speed in the interval 0 to 10 s is the same as the average speed in the interval 10 s to 20s.
 - Question 2 - Select One or More
The velocity-time plot for a particle moving on a straight line is shown in figure.
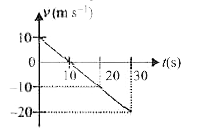 AThe particle has a constant acceleration.BThe particle has never tumed around.CThe particle has zero displacement.DThe average speed in the interval 0 to 10 s is the same as the average speed in the interval 10s to 20 s.
 - Question 3 - Select One or More
The velocity-time plot for a particle moving on a straight line is shown in figure. Choose correct options .
(##VMC_PHY_XI_WOR_BOK_01_C02_E03_026_Q01.png" width="80%">AThe particle has a constant accelerationBThe particle has never turned aroundCThe particle has zero displacementDThe average speed in the interval 0 to 10 s is same as the average speed in the interval 10 s to 20 s
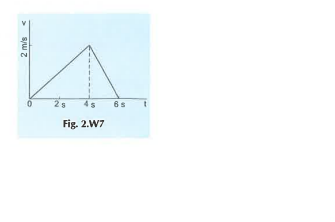
The velocity-time graph of a particle moving along a straight line is shown in Figure 2.W7.
Does the particle change its direction of motion ?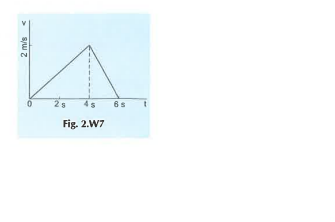 View Solution
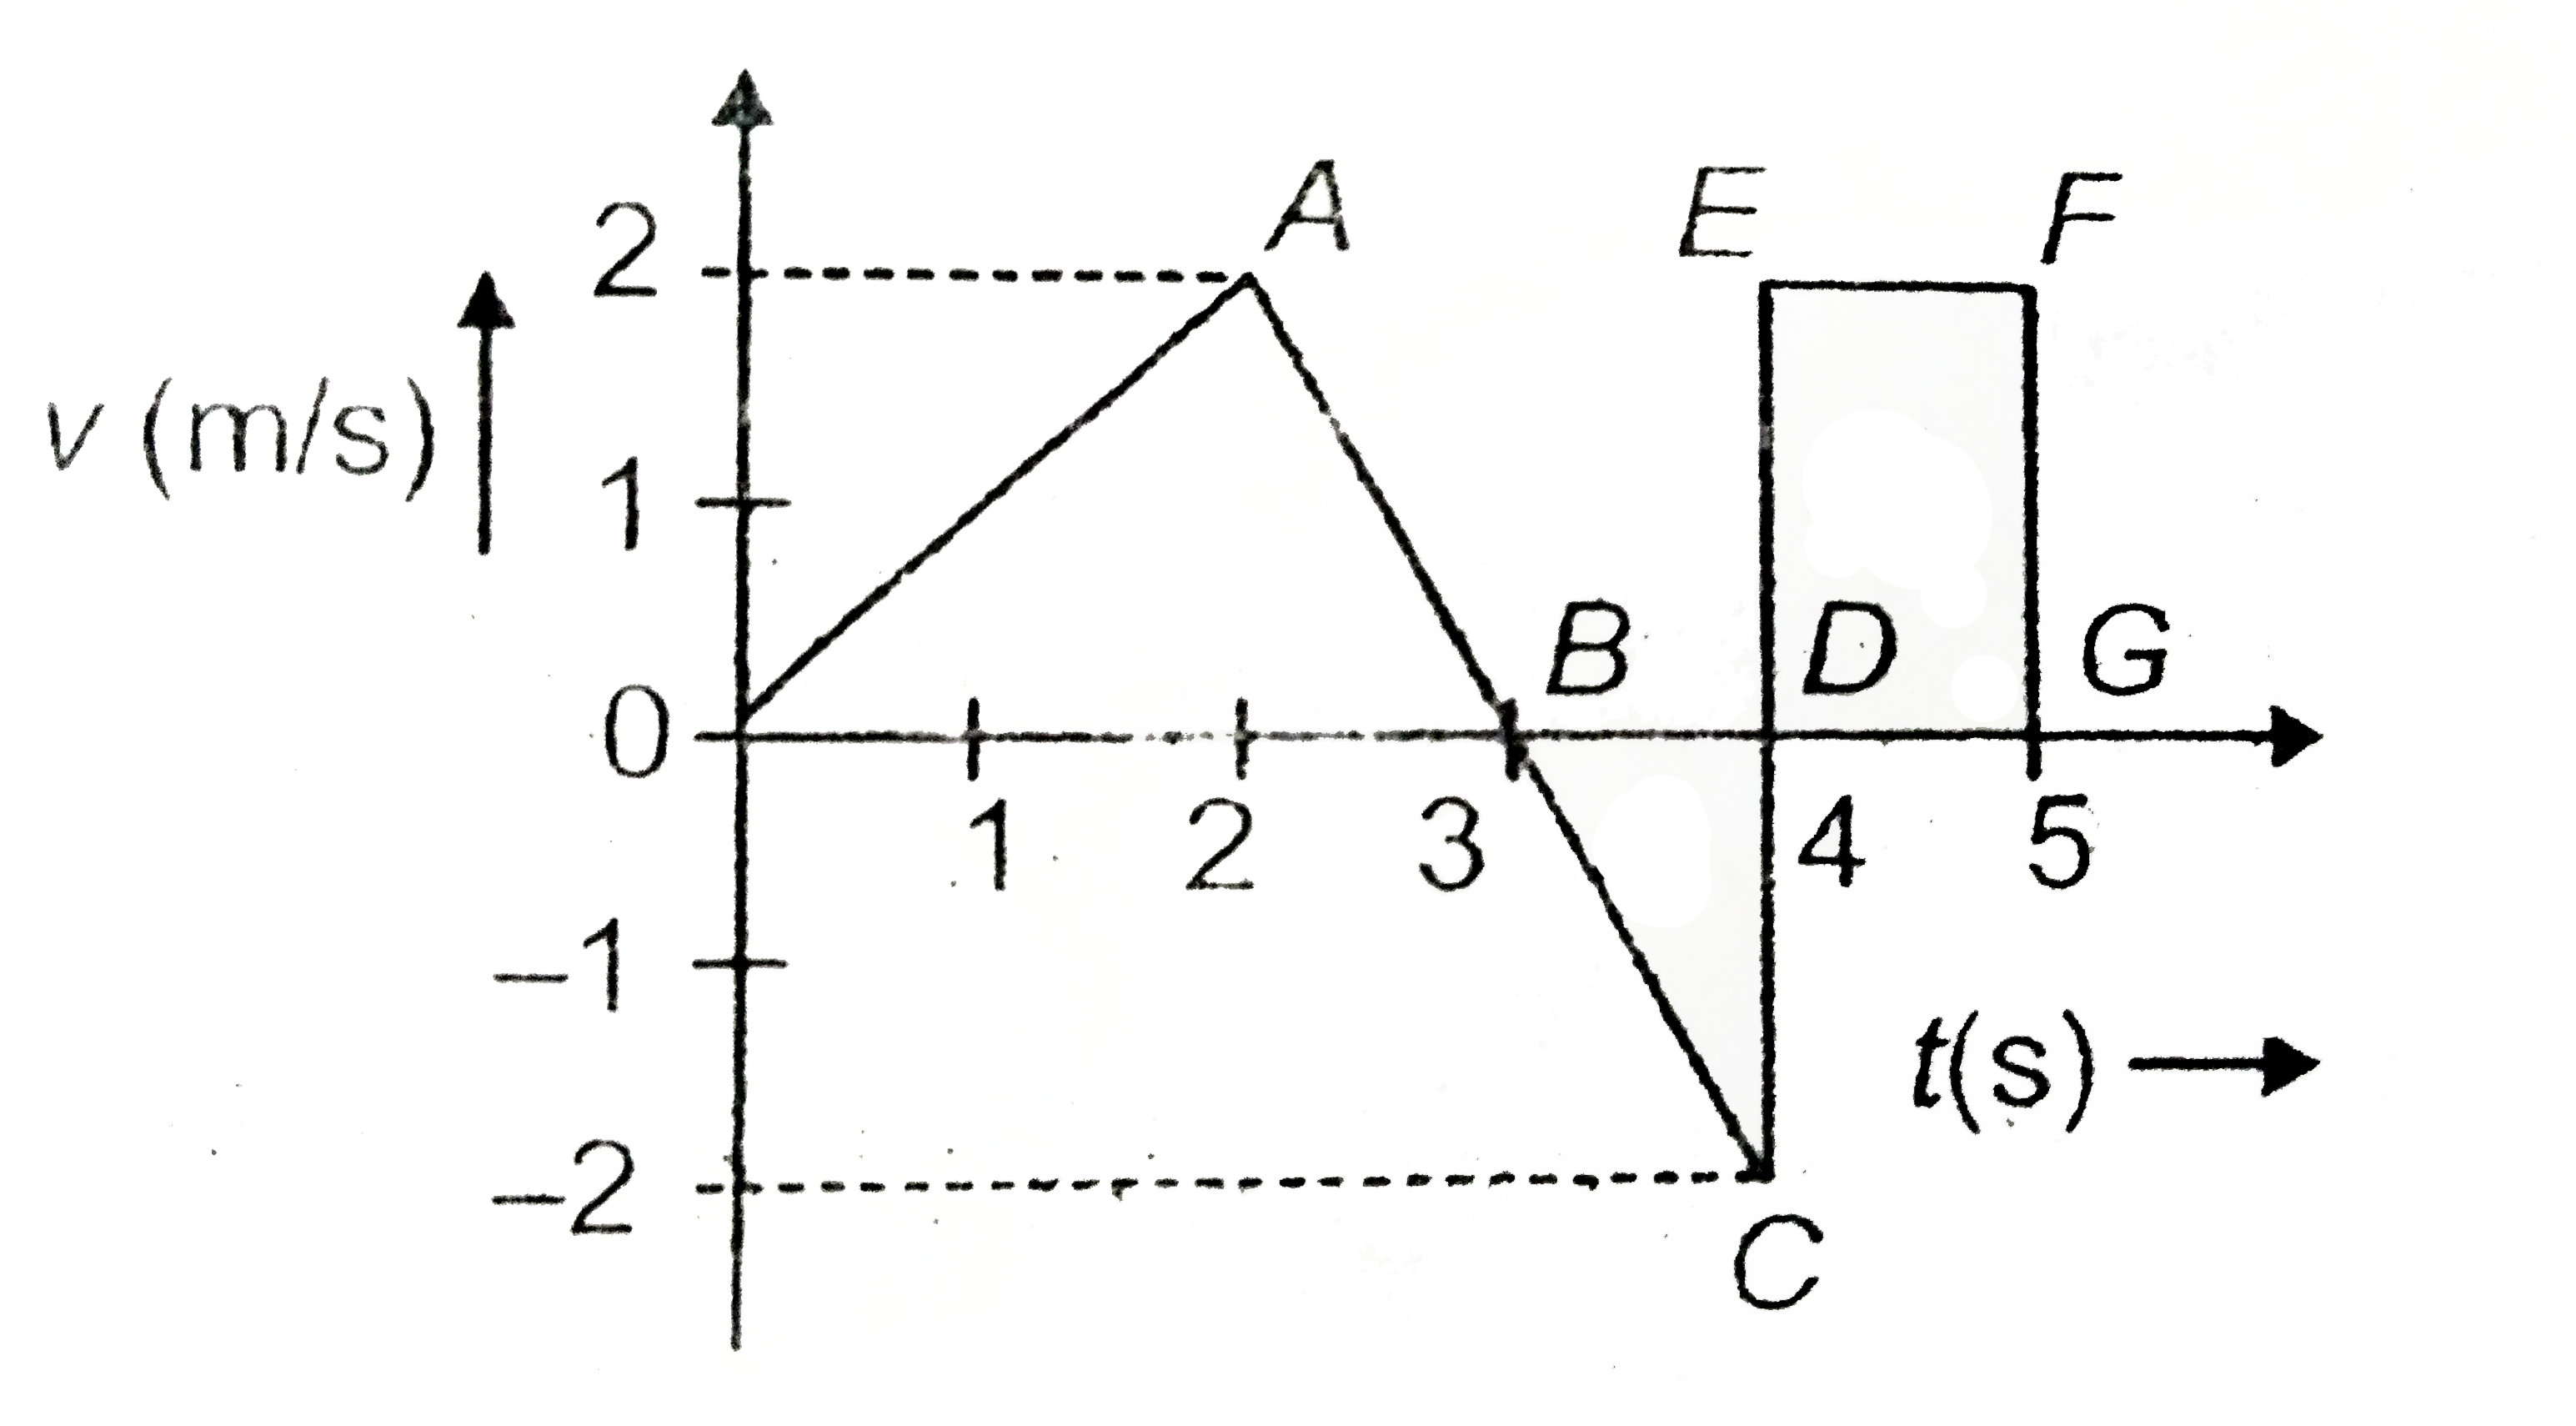
The velocity - time graph of a particle moving along a straight line is shown in the figure given below
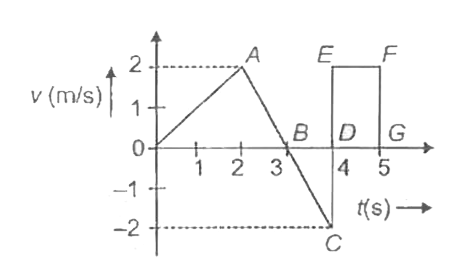
The displacement of the particle in 5 second isView SolutionThe velocity time graph of a particle moving along a straight line is shown in the figure. In the time interval from t=0 to t=8 second, answer the following three question.
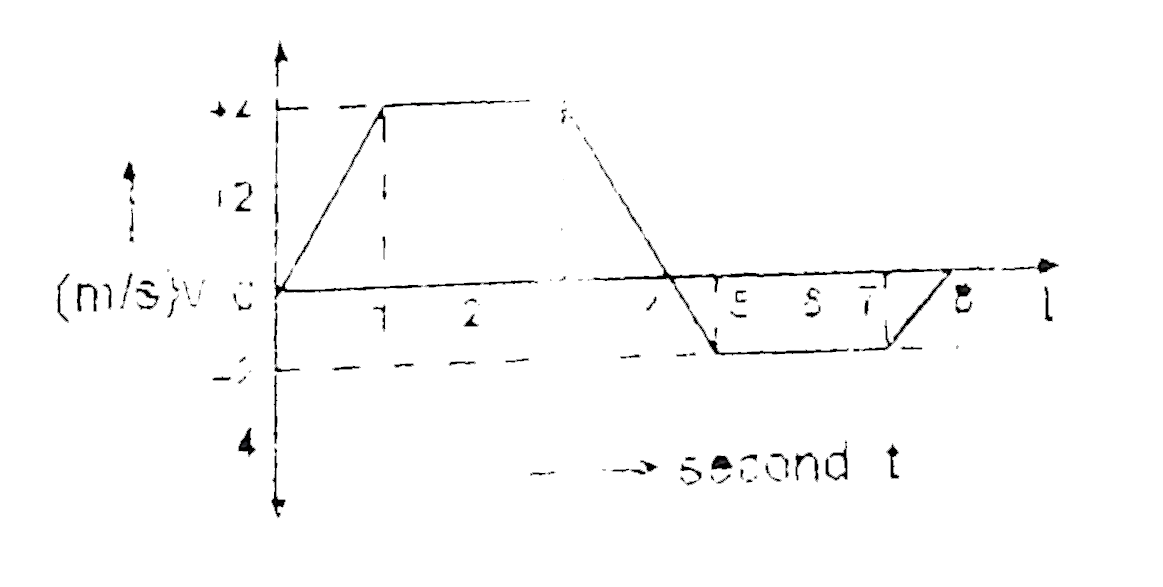
The distance travelled by the particle is :View SolutionThe velocity-time graph of a particle moving in a straight line is shown in figure. The mass of the particle is 2kg. Work done by all the forces acting on the particle in time interval between t=0 to t=10s is
 View Solution
Velocity-time graph of a particle moving in a straight line is shown in the figure. Mass of the particle is 2 kg. Work done by all the forces acting on the particle in time interval t = 0 to t = 10 sec is
 View Solution


