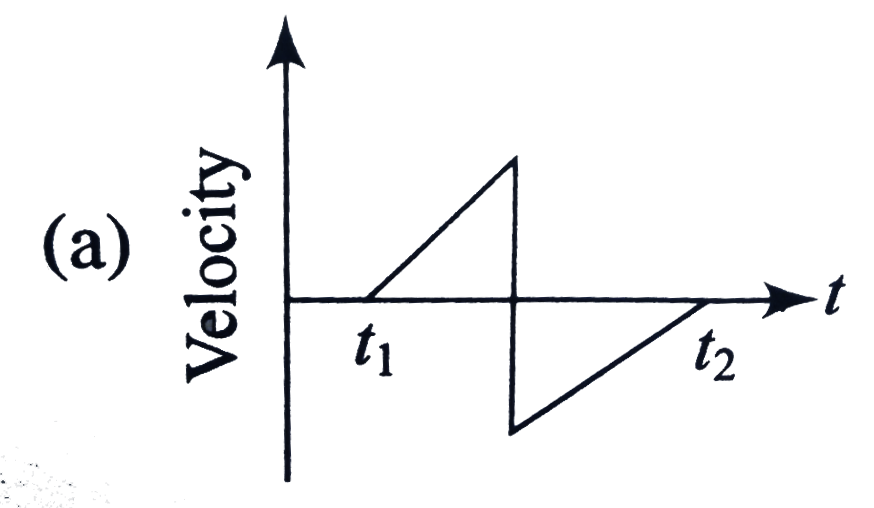
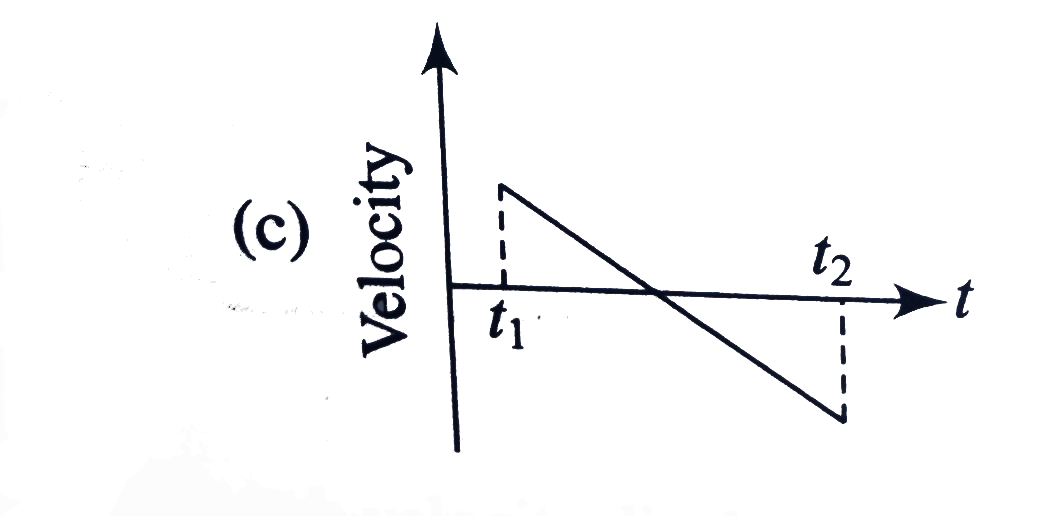
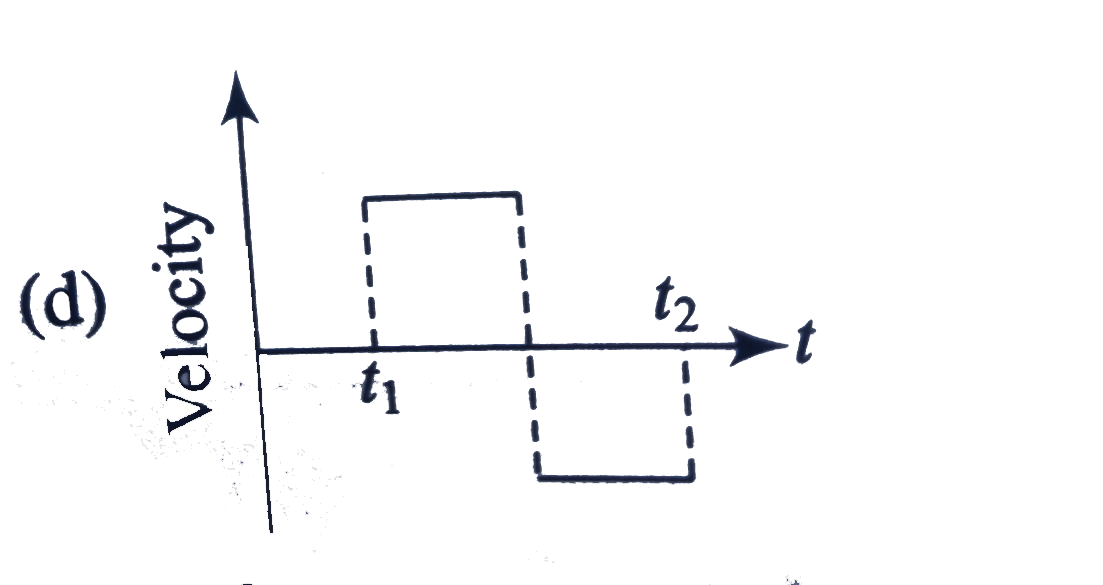
A batsman hits a sixes and the ball touches the ground outside the cricket ground. Which of the following graph describes the variation of the cricket ball's vertical velocity v with time between the time t1 as it hits the bat and time t2 when it touches the ground?

The correct Answer is:C
At time t1 the velocity of ball will be maximum andit goes on decreasing with respect to time.
At the highest point of path its velocity becomes zero, then it increases but direction is reversed
This explanation match with graph (c ).
Similar Questions
A particle is projected vertically upwards with a velocity v. It returns to the ground in time T. Which of the following graphs correctly represents the motion.
View SolutionA batsman hits a cricket ball which then rolls on a level ground. After covering a short distance, the ball comes to rest. The ball slows to a stop because (a) the batsman did not hit the ball hard enough, (b) velocity is proportional to the force exerted on the ball, (c ) there is a force on the ball opposing the motion ,(d) there is no unbalanced forcr on the ball, so the ball would want to come to rest.
View Solution
Knowledge Check
- Question 1 - Select One
The graph shown the variation with times t of the velocity v of an object . Which one of the following graphs best represents the variation of acceleration a of the object with time t?
 A
A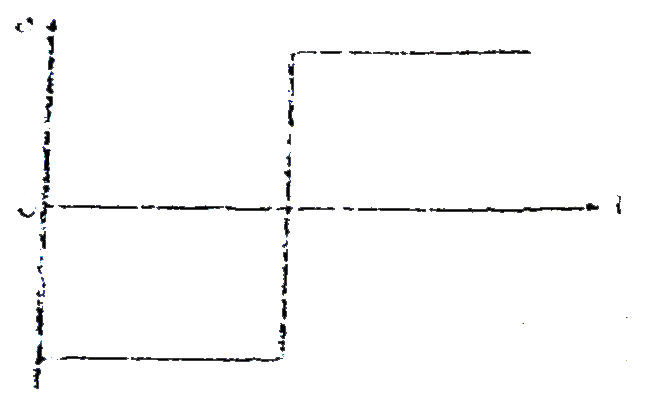 B
B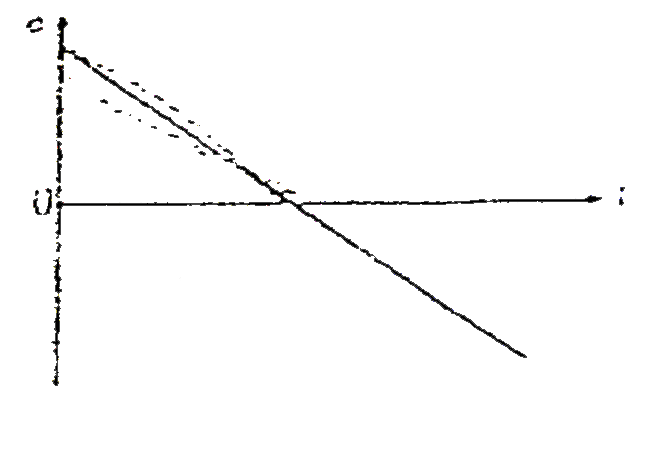 C
C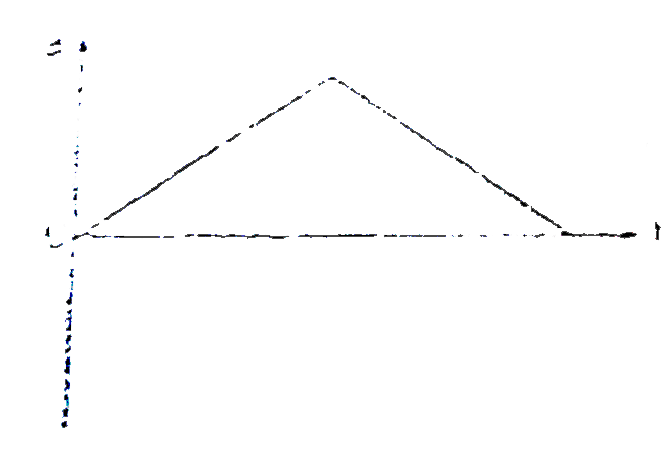 D
D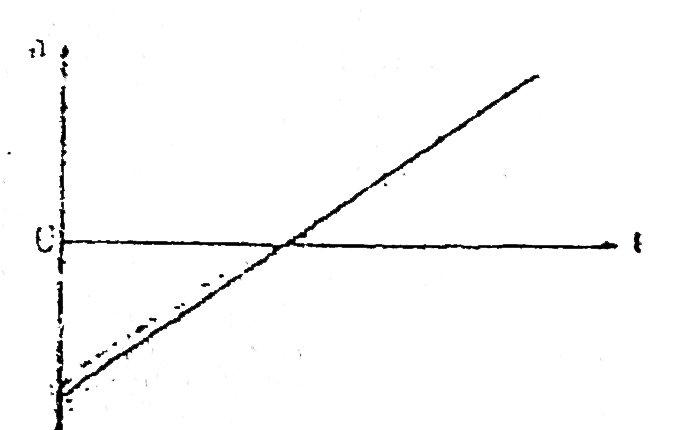
- Question 2 - Select One
A batsman hits a cricket ball which then rolls on a level ground . After covering a short distance, the ball comes to rest, The ball slows to a stop because
Amagnetic forceBfrictional forceCgravitational forceDmuscular force - Question 3 - Select One
Which of the following is the graph between the height (h) of a projectile and time (t), when it is projected from the ground
A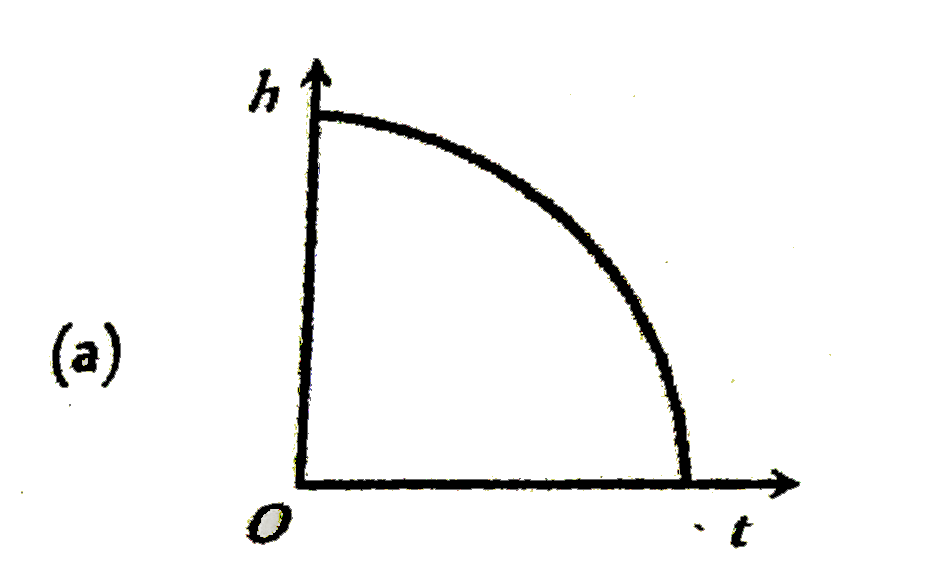 B
B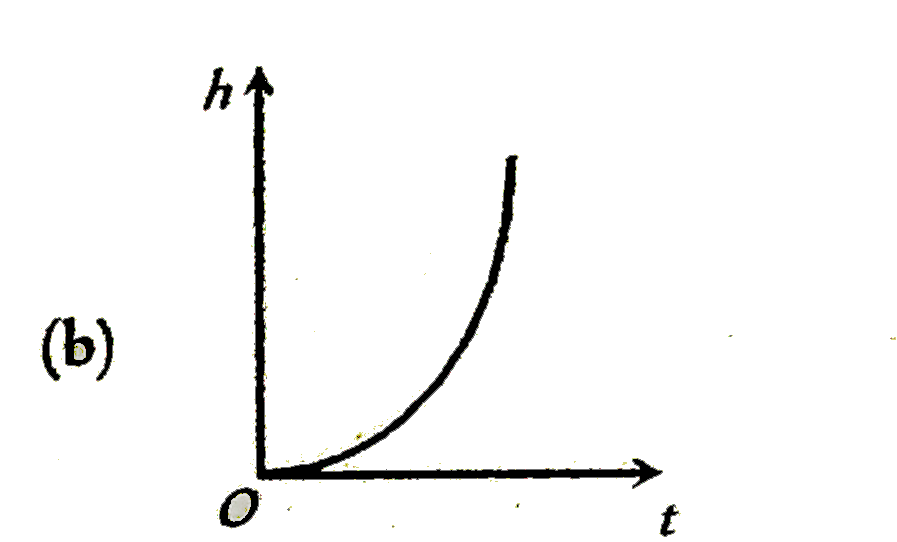 C
C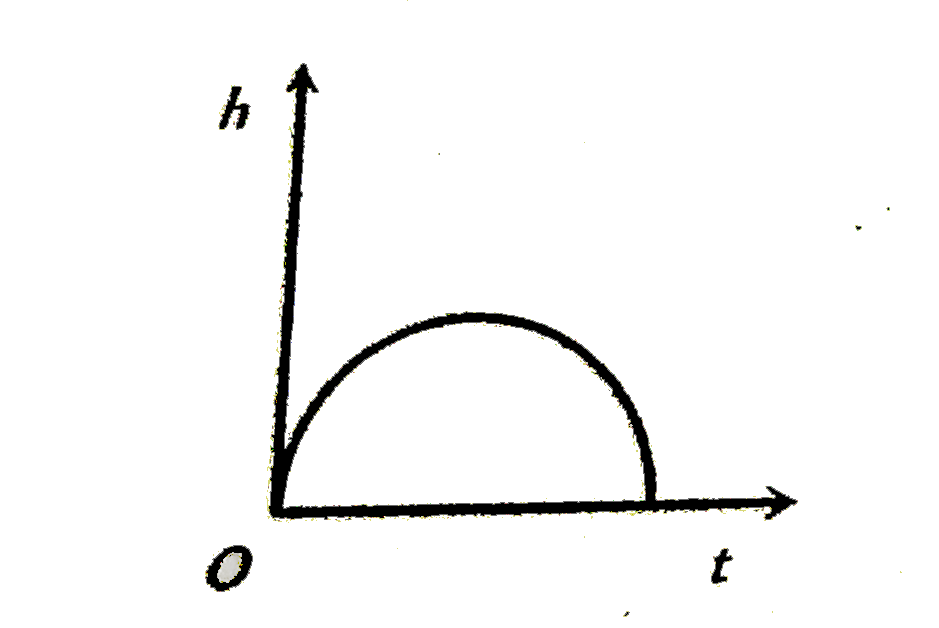 D
D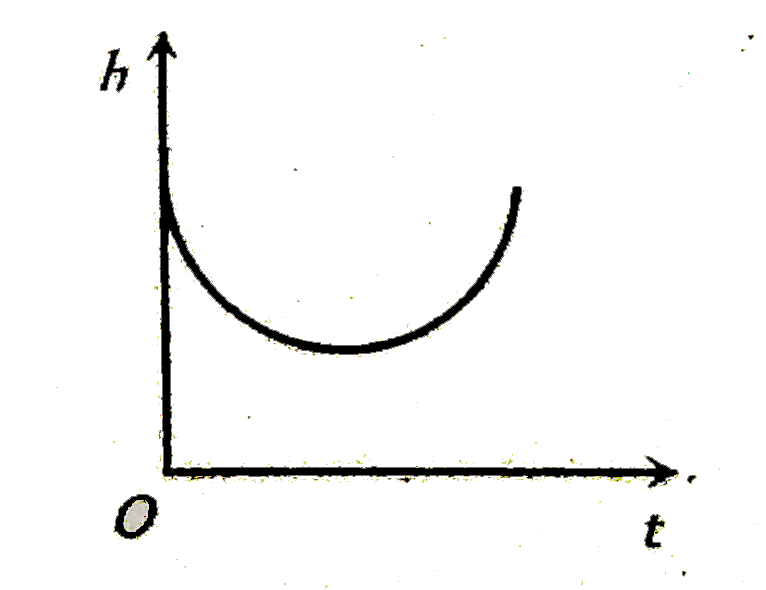
A batsman hits a cricket ball which then rolls on a level ground . After covering a short distance, the ball comes to rest, The ball slows to a stop because
View SolutionA particle is thrown vertically upwards with a velocity v. It returns to the ground in time T. which of the following graphs correctly represents the motion ?
View SolutionWhich of the following change appreciably when a batsman hits a moving cricket ball ?
A. Shape B. Direction C. Size D. speedView SolutionA ball falls from a height ‘h’ and collides with the ground. Each time it collides, its velocity is halved. Which of the following graphs are correct? Here t, v and y represent time, velocity and height above ground respectively. (vertically upwards direction is taken as positive and ground as y = 0)
View SolutionA ball is thrown vertically upward with a velocity u from the top of a tower. If it strikes the ground with velocity 3u, the time taken by the ball to reach the ground is
View Solution

