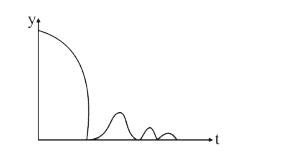
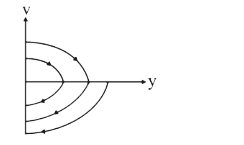
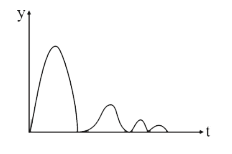
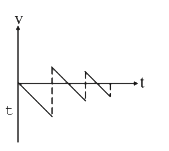
A ball falls from a height ‘h’ and collides with the ground. Each time it collides, its velocity is halved. Which of the following graphs are correct? Here t, v and y represent time, velocity and height above ground respectively. (vertically upwards direction is taken as positive and ground as y = 0)
The correct Answer is:D
To solve the problem step by step, we will analyze the motion of the ball as it falls and rebounds after colliding with the ground.
Step 1: Understanding the Initial Conditions
The ball is dropped from a height h with an initial velocity u=0. When it falls freely under gravity, its velocity just before hitting the ground can be calculated using the equation of motion:
v2=u2+2gh
Since u=0, we have:
v=√2gh
Hint: Remember that the final velocity before impact can be derived from the kinematic equations.
Step 2: Analyzing the Collision
Upon colliding with the ground, the ball's velocity is halved. Therefore, after the first collision:
v′=v2=√2gh2=√2gh2
Step 3: Motion After the First Collision
After the first collision, the ball will ascend to a height h1 before falling again. The maximum height reached can be calculated using:
v′2=0+2gh1⟹h1=(v′)22g=(√2gh2)22g=2gh4⋅2g=h4
Step 4: Repeat the Process
After reaching height h1, the ball will fall again, collide with the ground, and its velocity will again be halved. This process will continue, leading to heights h2,h3, etc., where:
h2=h14=h16,h3=h24=h64,…
Step 5: Graphs Analysis
1. Height vs. Time Graph (y vs. t): The ball starts from height h and decreases to 0, then rebounds to h/4, and so on. The graph will show a decreasing curve with a series of peaks at decreasing heights.
2. Velocity vs. Height Graph (v vs. y): The velocity decreases as the height decreases. The graph will be a downward sloping curve, indicating that as the height above the ground decreases, the velocity increases until it reaches the peak height after each bounce.
3. Velocity vs. Time Graph (v vs. t): The velocity will be negative while falling (increasing in magnitude) and will be positive while ascending (decreasing in magnitude). The graph will show a linear decrease during the fall and a linear increase during the ascent, with the slopes reflecting the acceleration due to gravity.
Conclusion
Based on the analysis, the correct graphs are:
- Height vs. Time: A decreasing curve with peaks.
- Velocity vs. Height: A downward sloping curve.
- Velocity vs. Time: A linear graph with negative slope during descent and positive slope during ascent.
Final Answer: The correct options are A, B, and D.
The ball is dropped from a height h with an initial velocity u=0. When it falls freely under gravity, its velocity just before hitting the ground can be calculated using the equation of motion:
v2=u2+2gh
Since u=0, we have:
v=√2gh
Upon colliding with the ground, the ball's velocity is halved. Therefore, after the first collision:
v′=v2=√2gh2=√2gh2
After the first collision, the ball will ascend to a height h1 before falling again. The maximum height reached can be calculated using:
v′2=0+2gh1⟹h1=(v′)22g=(√2gh2)22g=2gh4⋅2g=h4
After reaching height h1, the ball will fall again, collide with the ground, and its velocity will again be halved. This process will continue, leading to heights h2,h3, etc., where:
h2=h14=h16,h3=h24=h64,…
1. Height vs. Time Graph (y vs. t): The ball starts from height h and decreases to 0, then rebounds to h/4, and so on. The graph will show a decreasing curve with a series of peaks at decreasing heights.
Based on the analysis, the correct graphs are:
- Height vs. Time: A decreasing curve with peaks.
- Velocity vs. Height: A downward sloping curve.
- Velocity vs. Time: A linear graph with negative slope during descent and positive slope during ascent.
Similar Questions
A particle is projected vertically upwards with a velocity v. It returns to the ground in time T. Which of the following graphs correctly represents the motion.
View SolutionA ball is dropped from a height h above ground,Neglect the air resistance,its velocity (v) varies with its height y above the ground as
View Solution
Knowledge Check
A ball is dropped from a height h above ground. Neglect the air resistance, its velocity (v) varies with its height (y) above the ground as :-
A√2g(h−y)B√2ghC√2gyD√2g(h+y)A particle is thrown vertically upwards with a velocity v. It returns to the ground in time T. which of the following graphs correctly represents the motion ?
A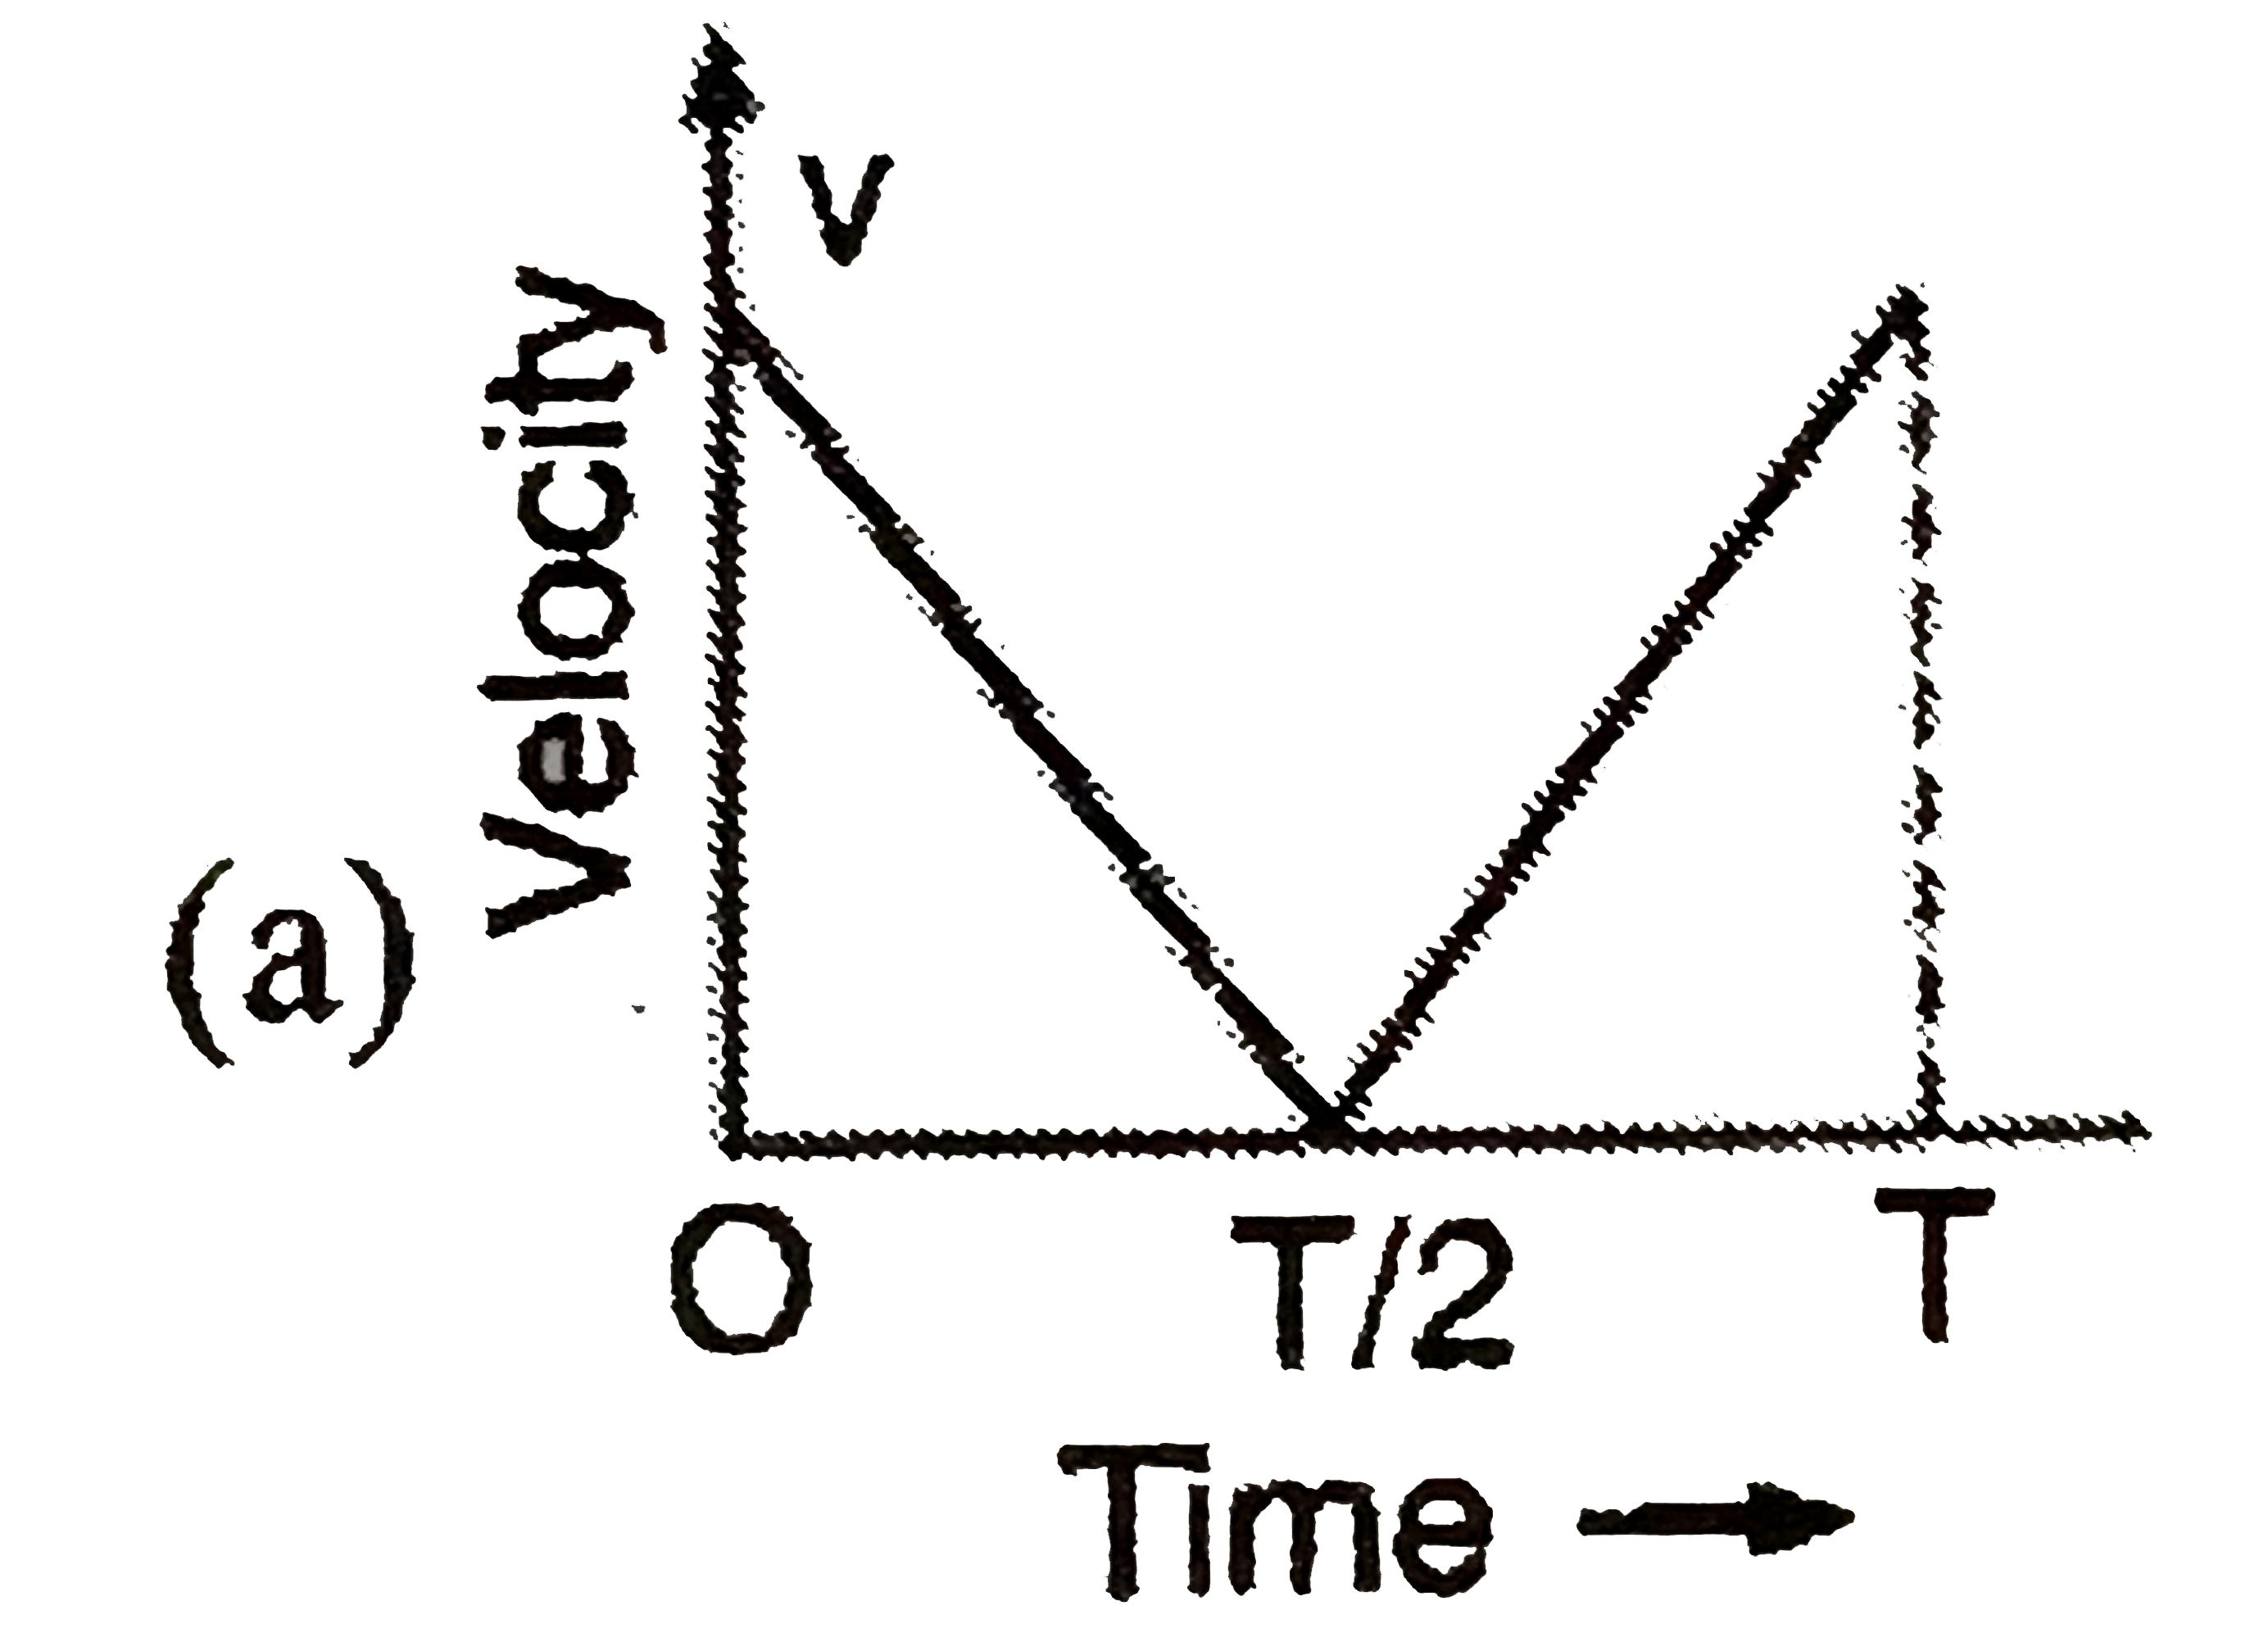 B
B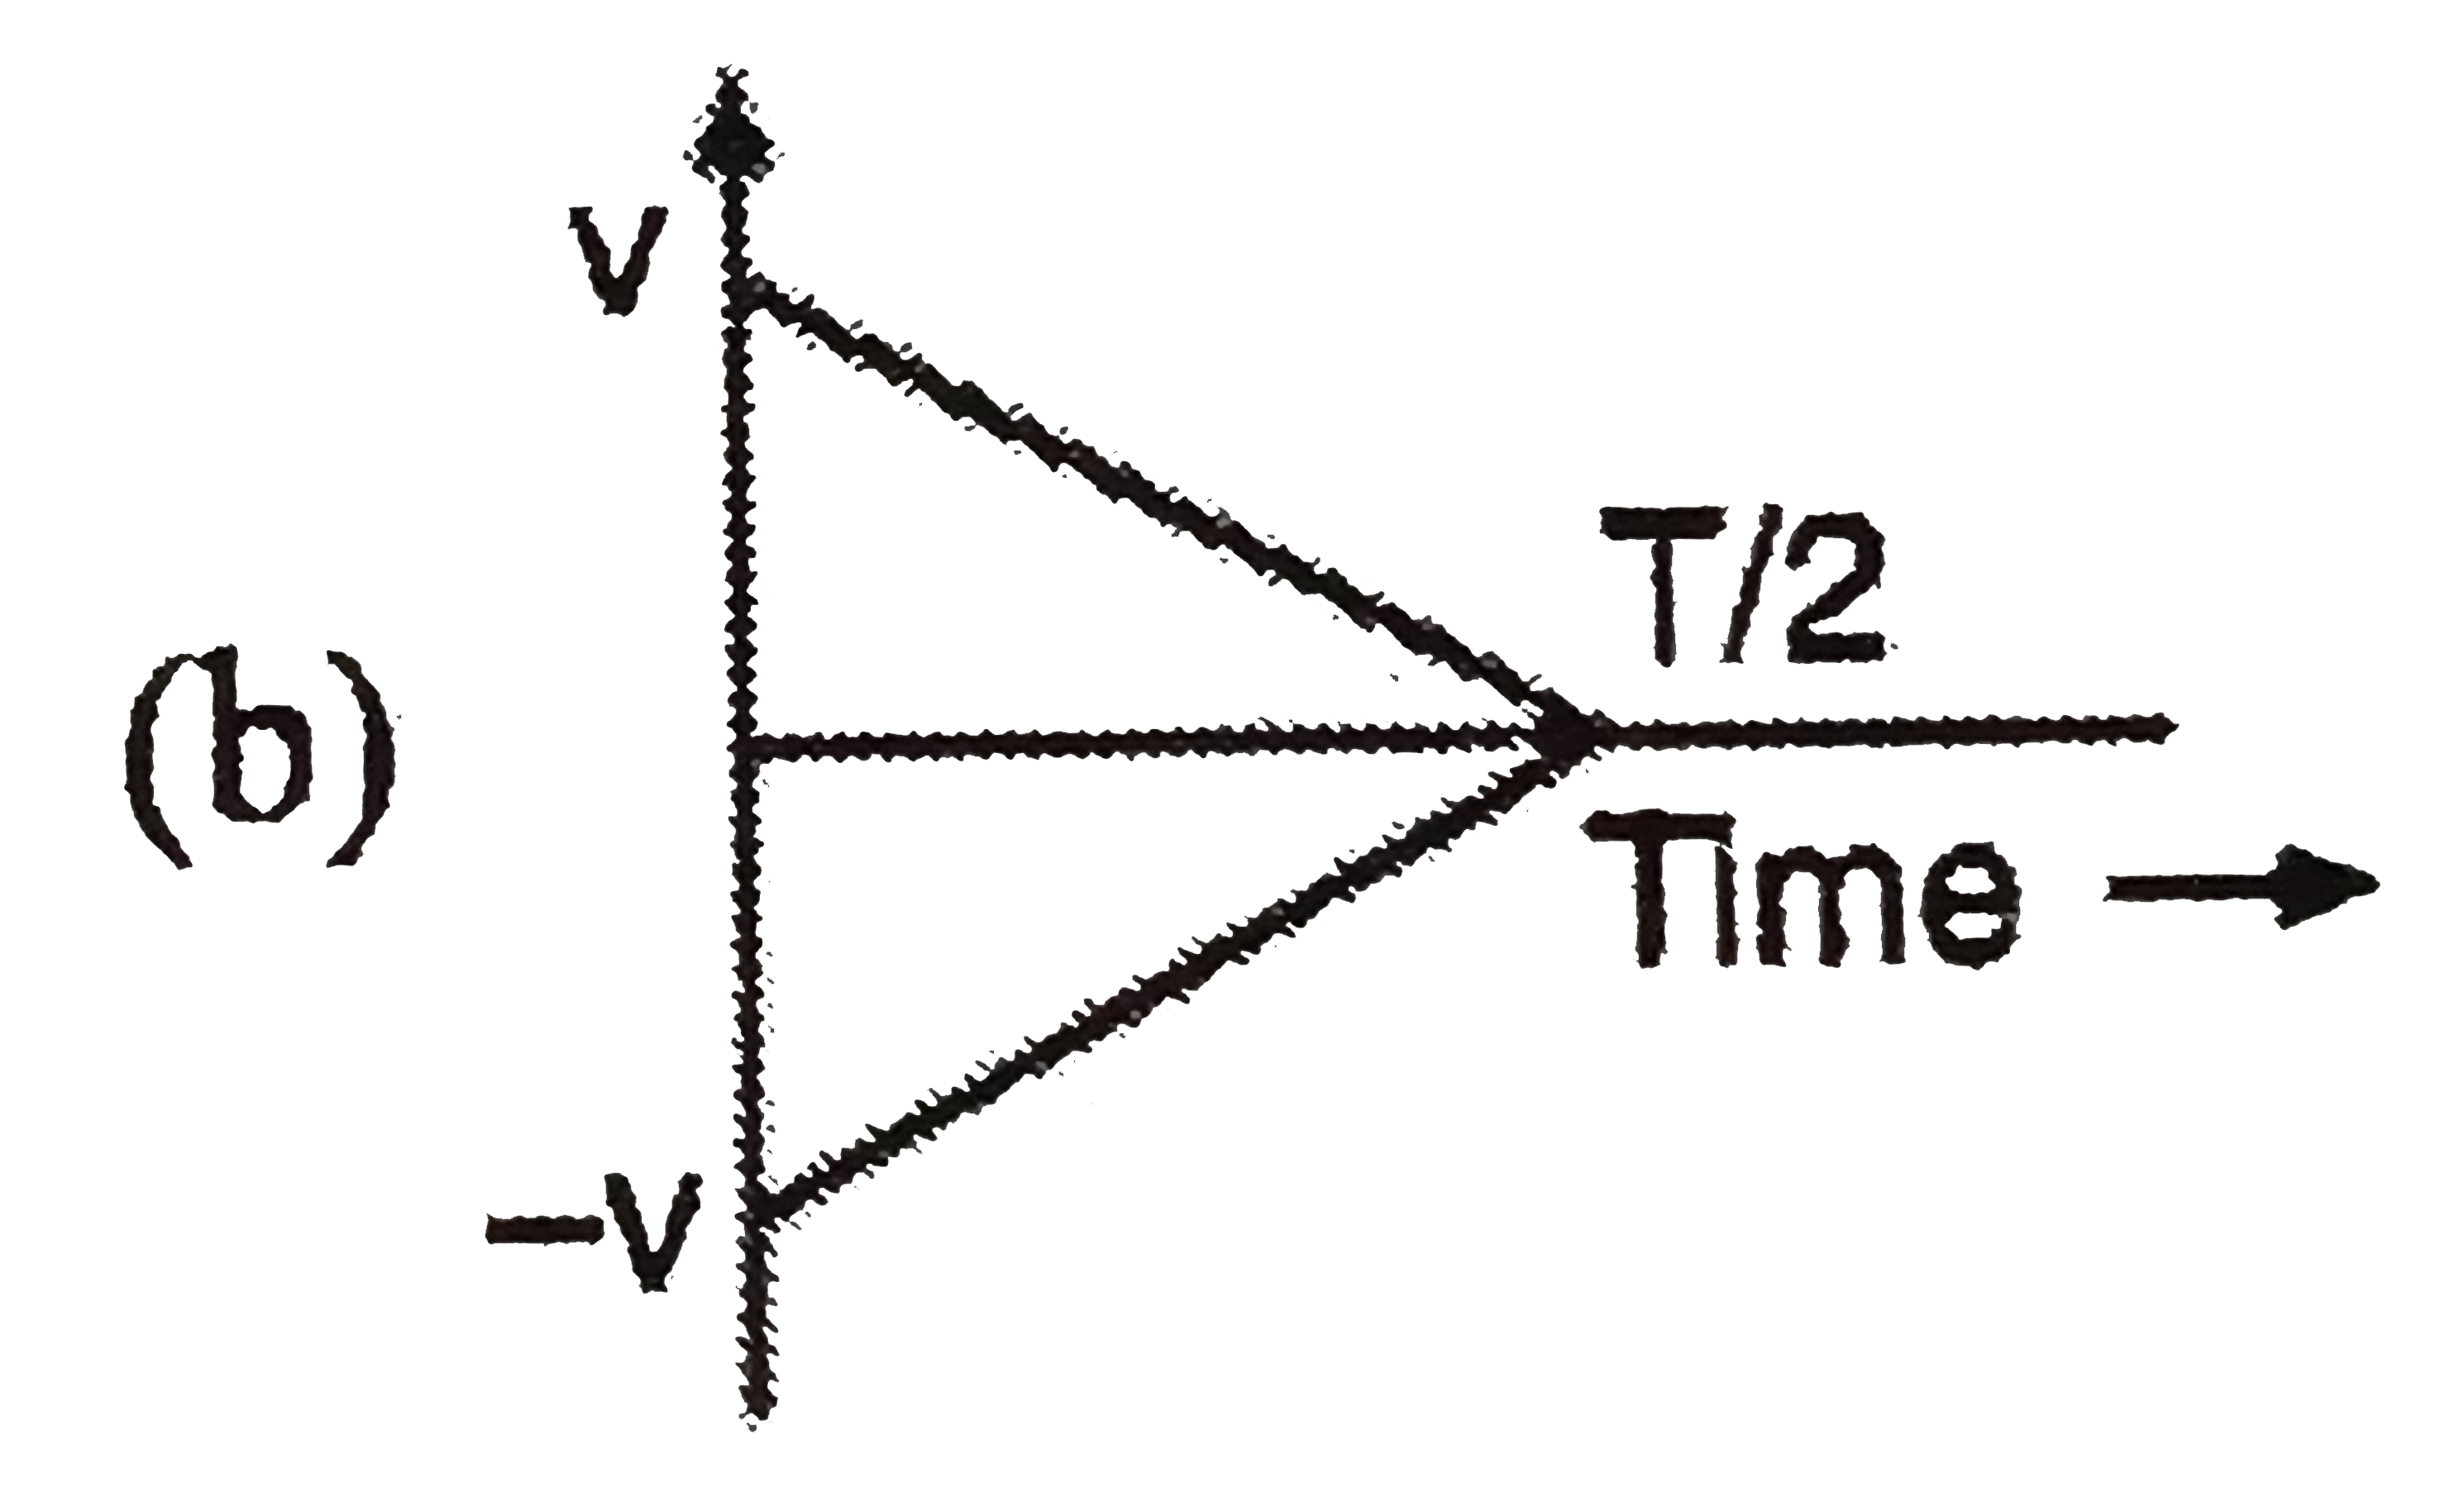 C
C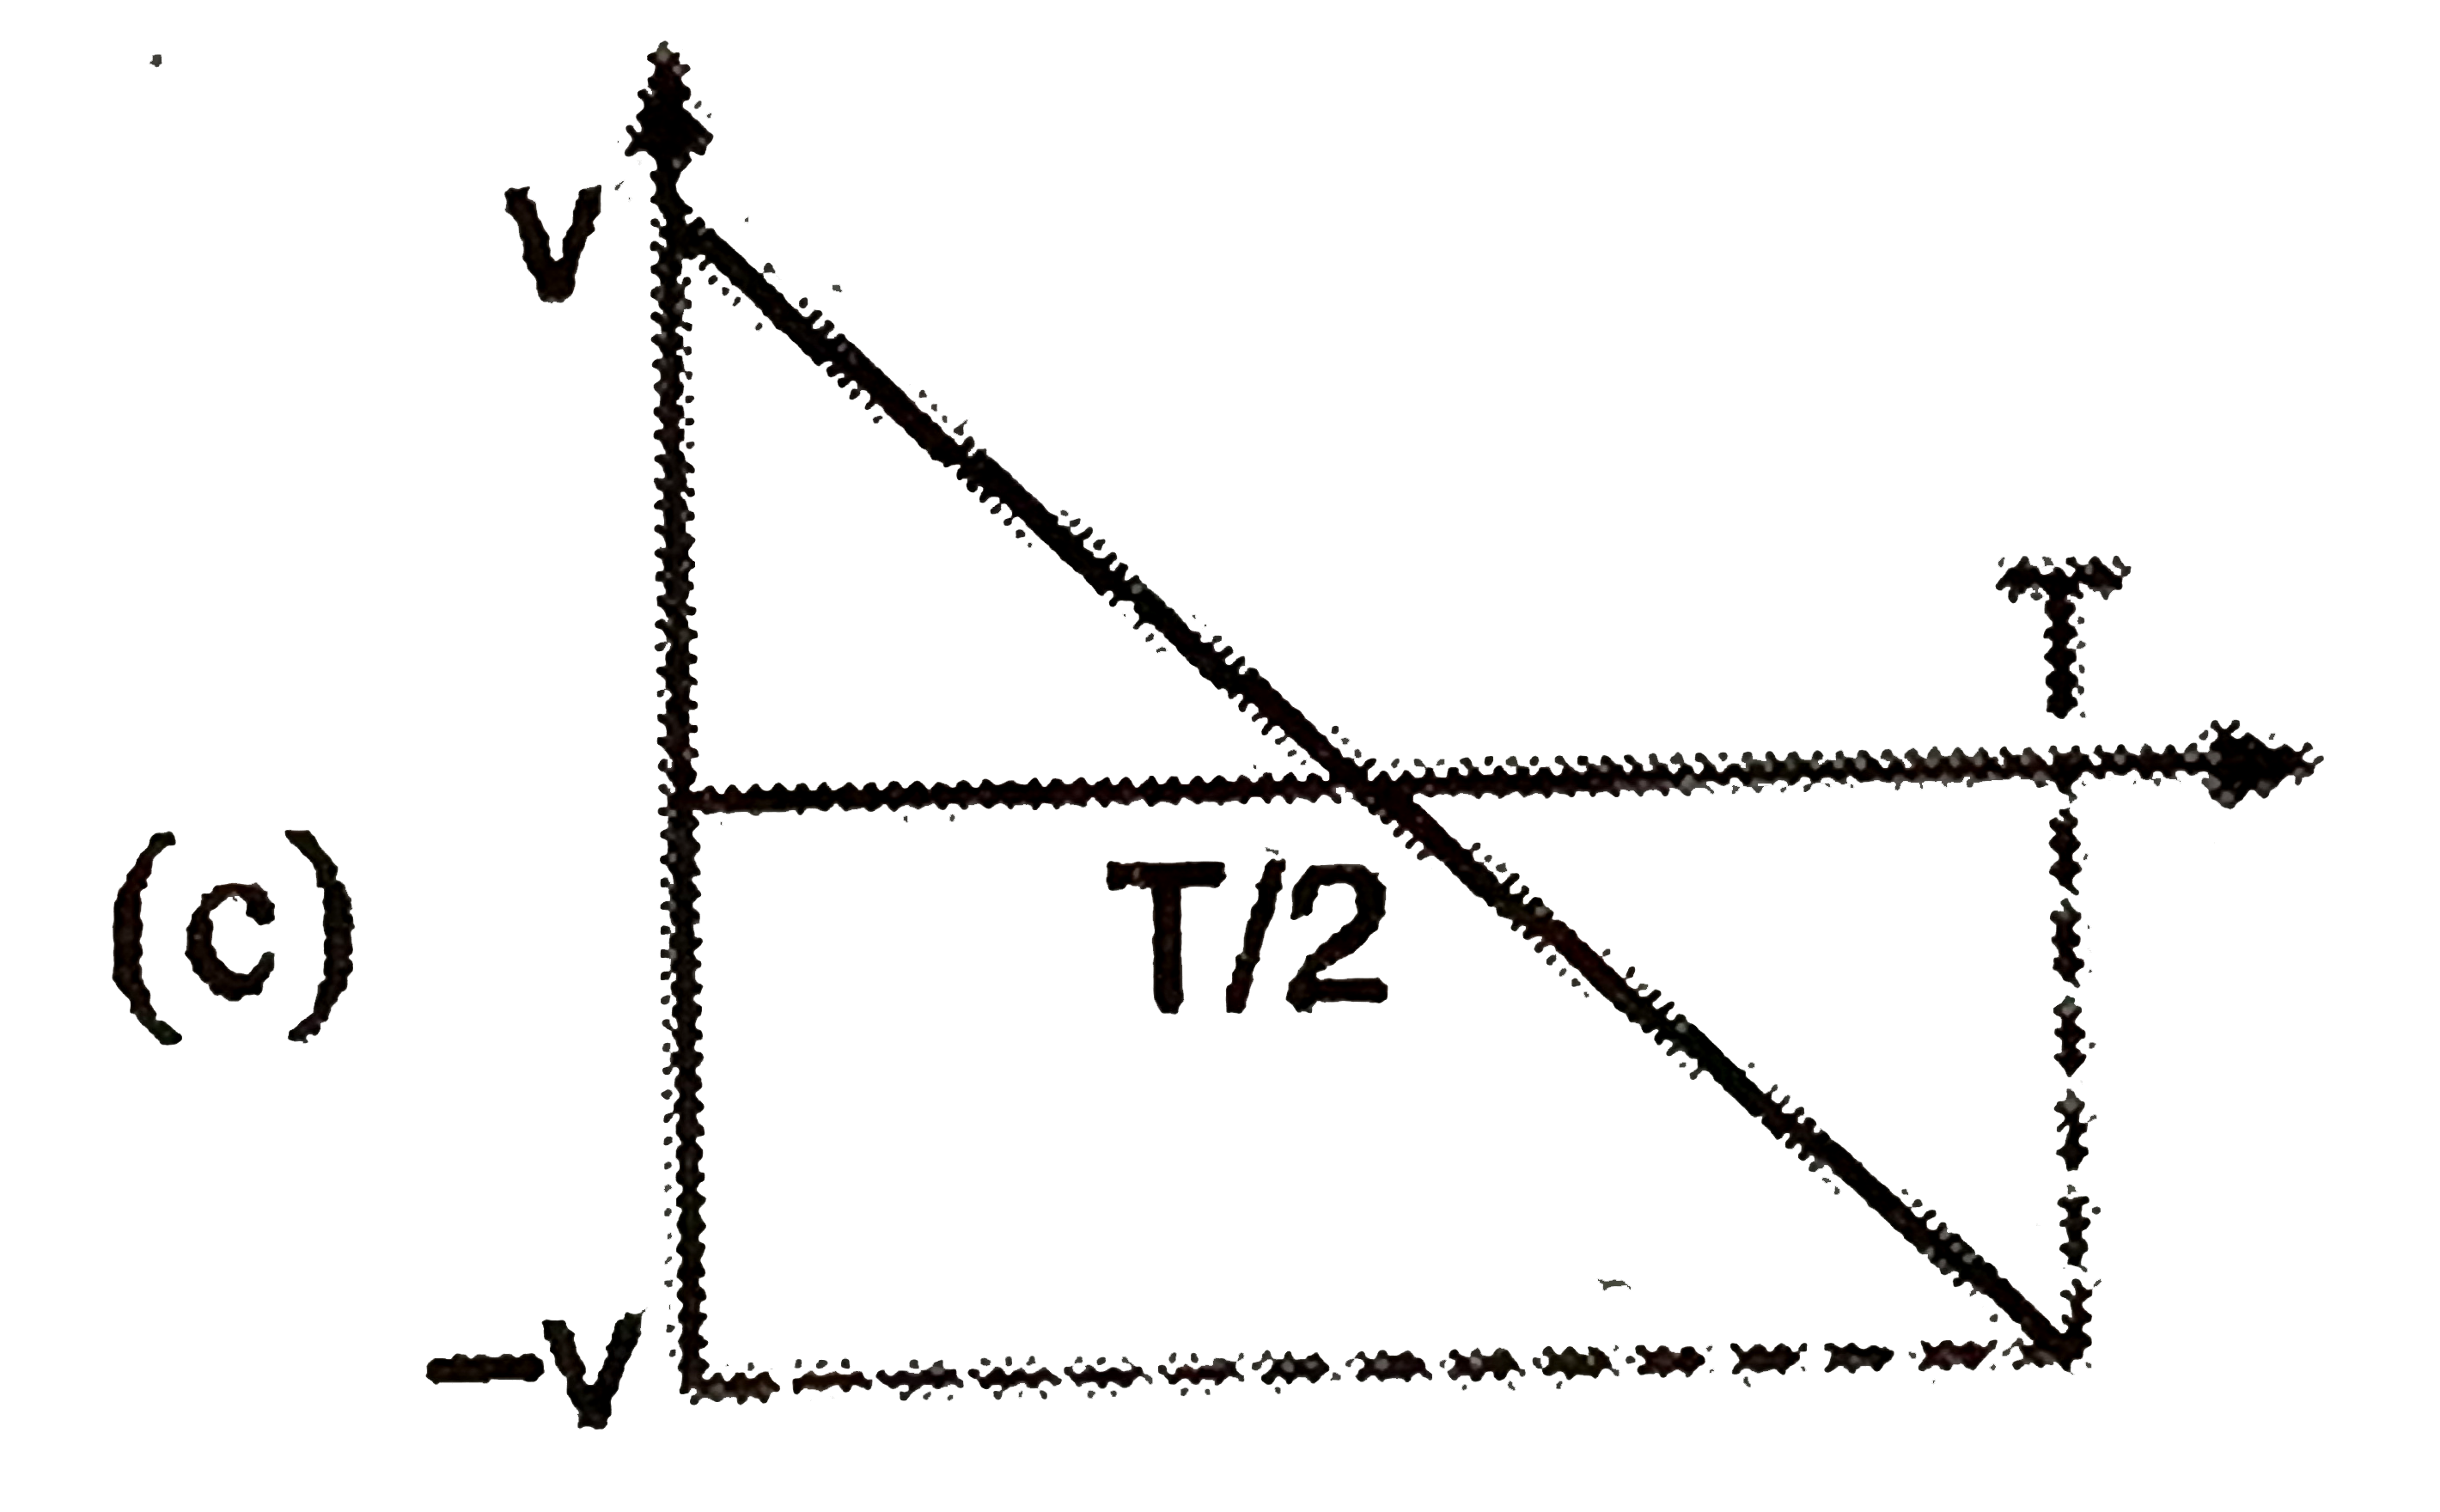 D
D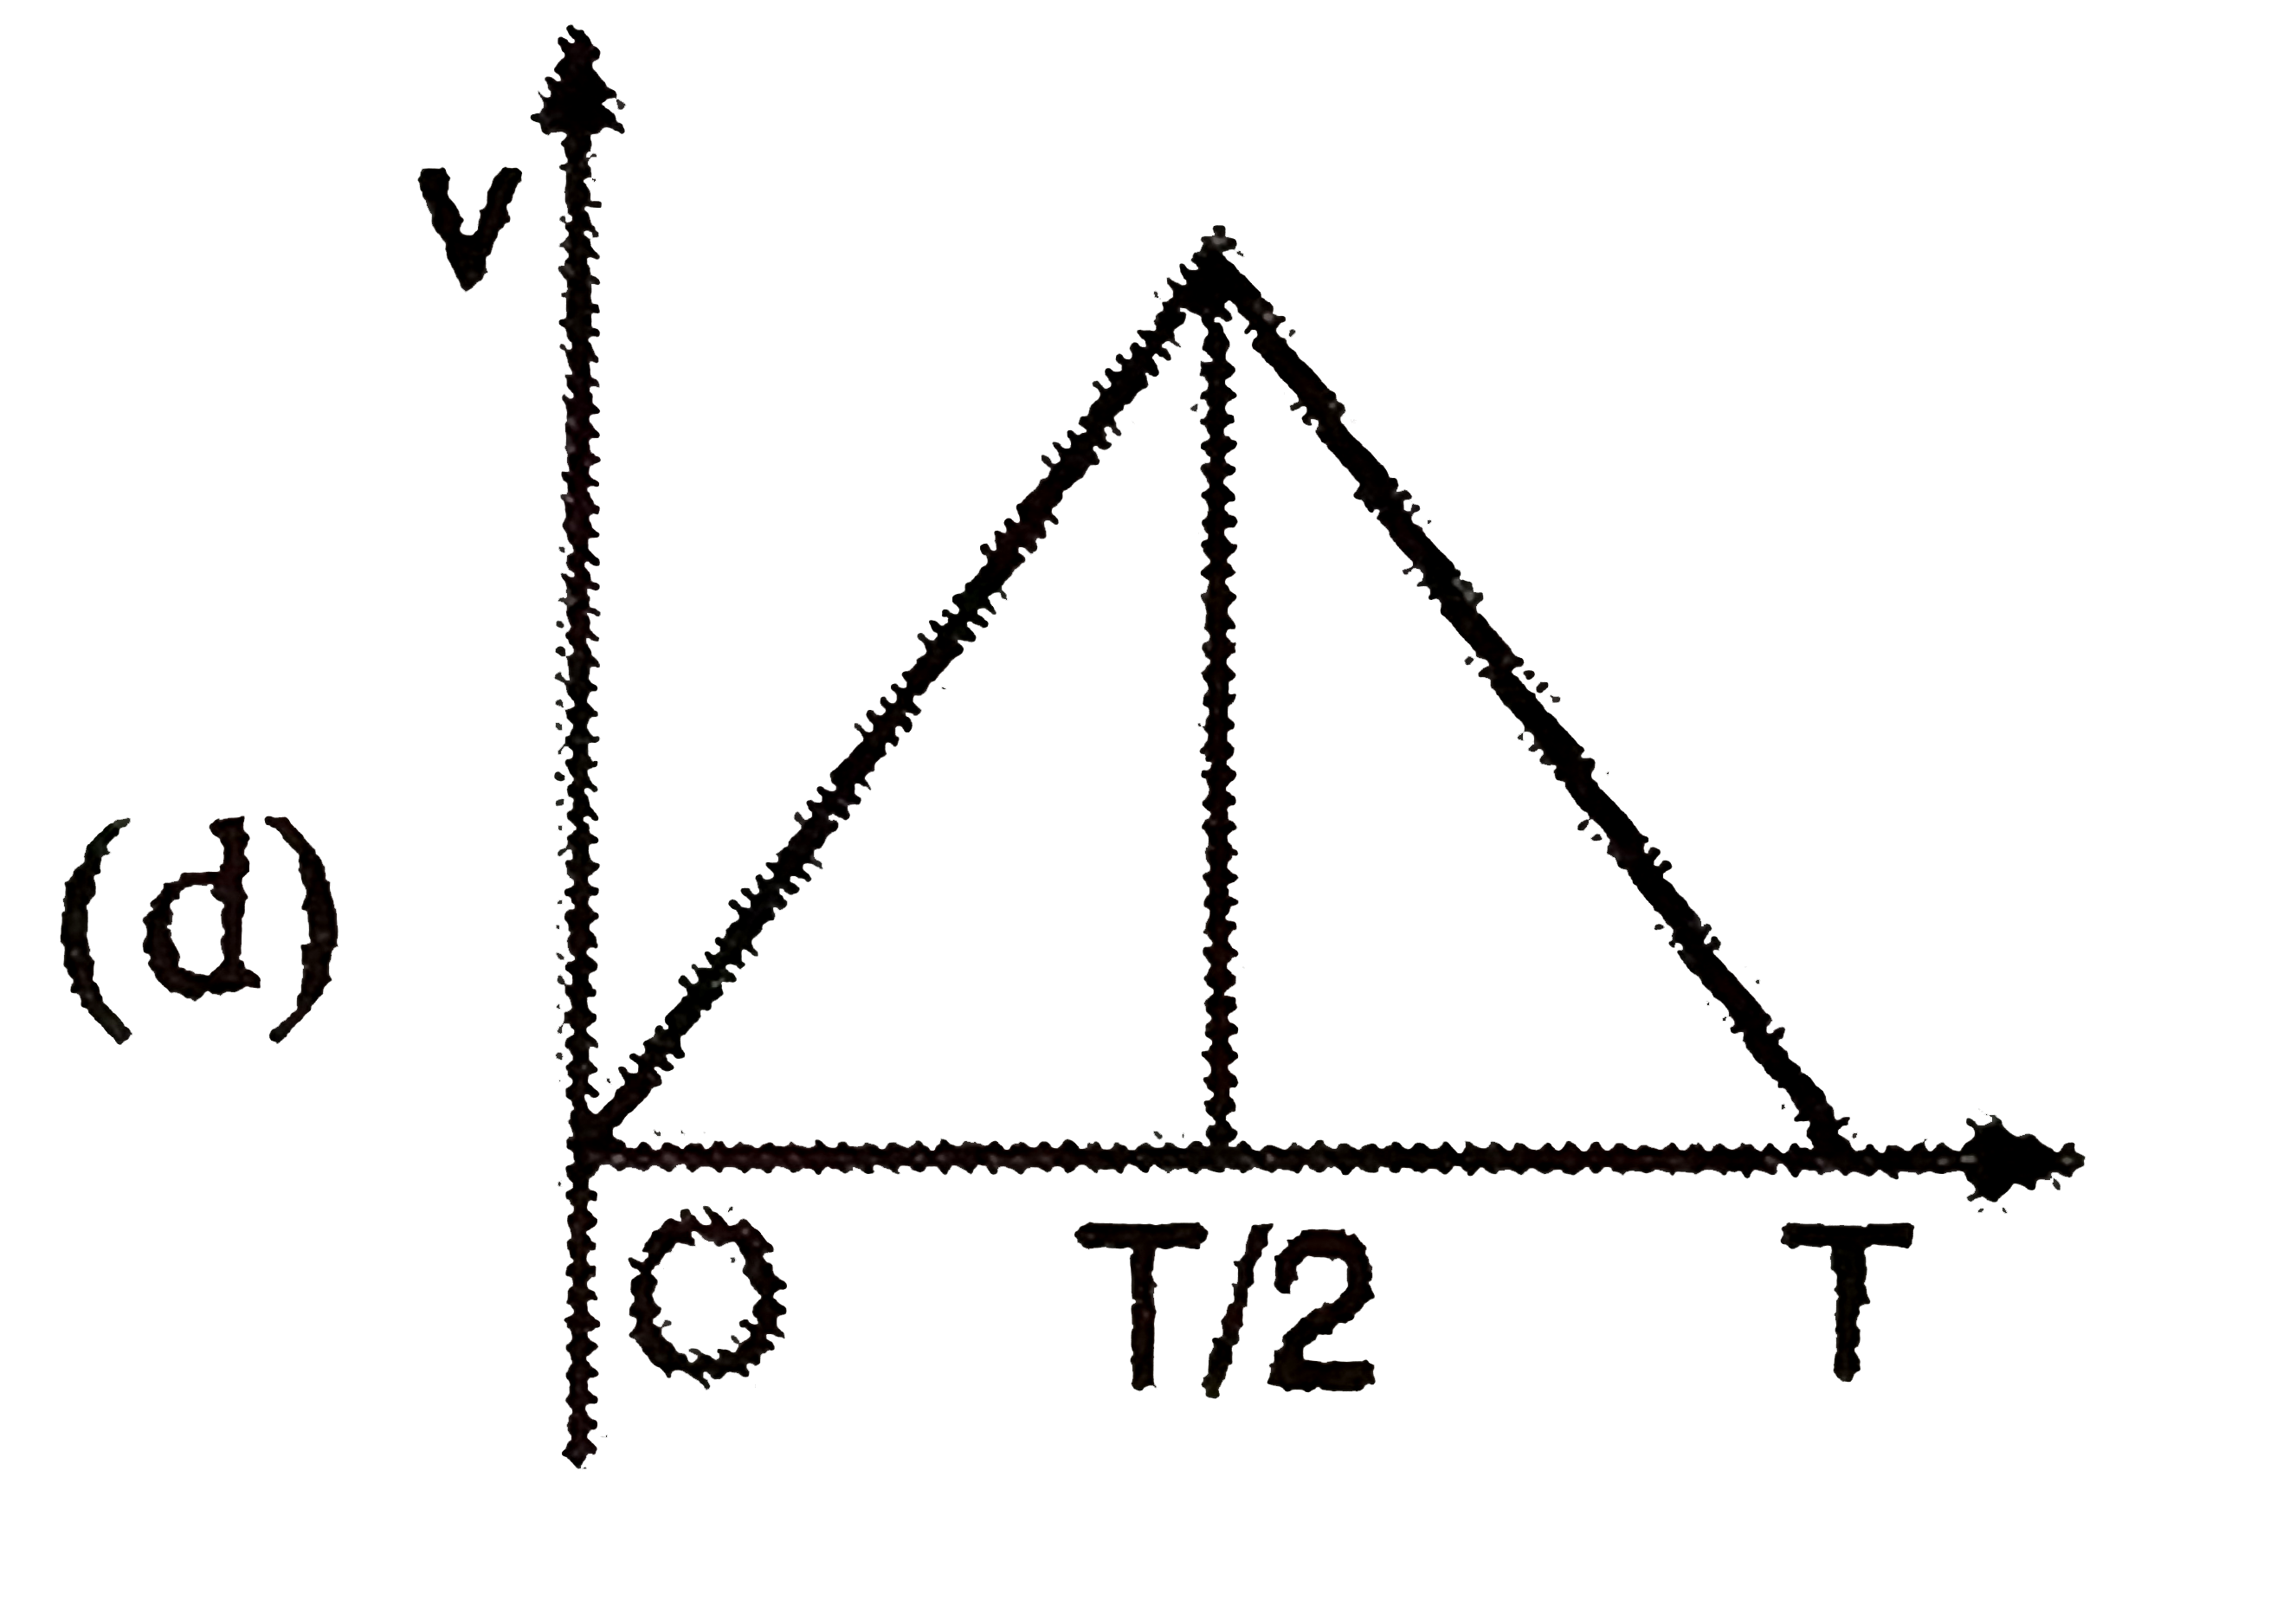
A ball thrown vertically upward with initial velocity u. Which of the following graphs represent the velocity of ball correctly as function of time?
(Take upward direction as positive)ABCD
A small metallic spherical ball is dropped from a height h. If it collides with the ground inelastically and rebounds, then
View SolutionWhat is the area under the velocity-time curve in the case of a body projected vertically upwards from the ground after reaching the ground ?
View SolutionA body is falling from height 'h' it takes t1 time to rech the ground. The time taken to cover the first half of height is:-
View SolutionA ball is projected upwards from a height h above the surface of the earth with velocity v. The time at which the ball strikes the ground is
View Solutionv34
View Solution


