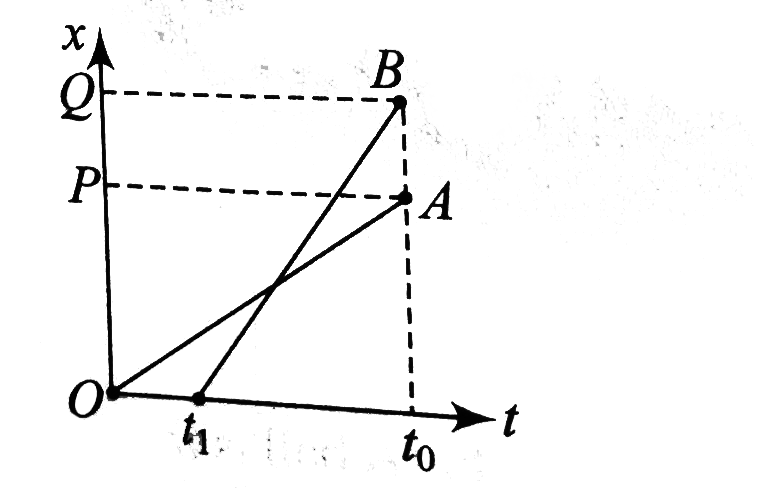
The position-time (x-t) graphs for two children A and B returning from their school O to their homes P and Q respectively along straight line path (taken as x-axis) are shown in figure. Choose the correct statement (s):
A lives closer to the school B
A starts from the school earlier than B
A and B have equal average velocities from 0 to t0.
B overtakes A on the way
The correct Answer is:A, B, D
OP<OQ, so A lives closer. A starts at t=0, whereas B starts at t=t, So A starts earlier than B. Their average velocity is not equal because their displacement OP and OR are not same. B overtakes A, where both the graphs intersect.
Topper's Solved these Questions
- CENGAGE PHYSICS DPPBOOK - CENGAGE PHYSICSCHAPTER - CENGAGE PHYSICS DPPEXERCISE - Single Correct Answer type
491 Videos
- CENGAGE PHYSICS DPPBOOK - CENGAGE PHYSICSCHAPTER - CENGAGE PHYSICS DPPEXERCISE - Fill in the blanks type
26 Videos
- CENGAGE PHYSICS DPPBOOK - CENGAGE PHYSICSCHAPTER - CENGAGE PHYSICS DPPEXERCISE - subjective type
51 Videos
- CAPACITOR AND CAPACITANCEBOOK - CENGAGE PHYSICSCHAPTER - CAPACITOR AND CAPACITANCEEXERCISE - Integer
5 Videos
- CENTRE OF MASS CONVERSATION OF MOMENTUM AND COLLISIONBOOK - CENGAGE PHYSICSCHAPTER - CENTRE OF MASS CONVERSATION OF MOMENTUM AND COLLISIONEXERCISE - Question Bank
38 Videos
Similar Questions
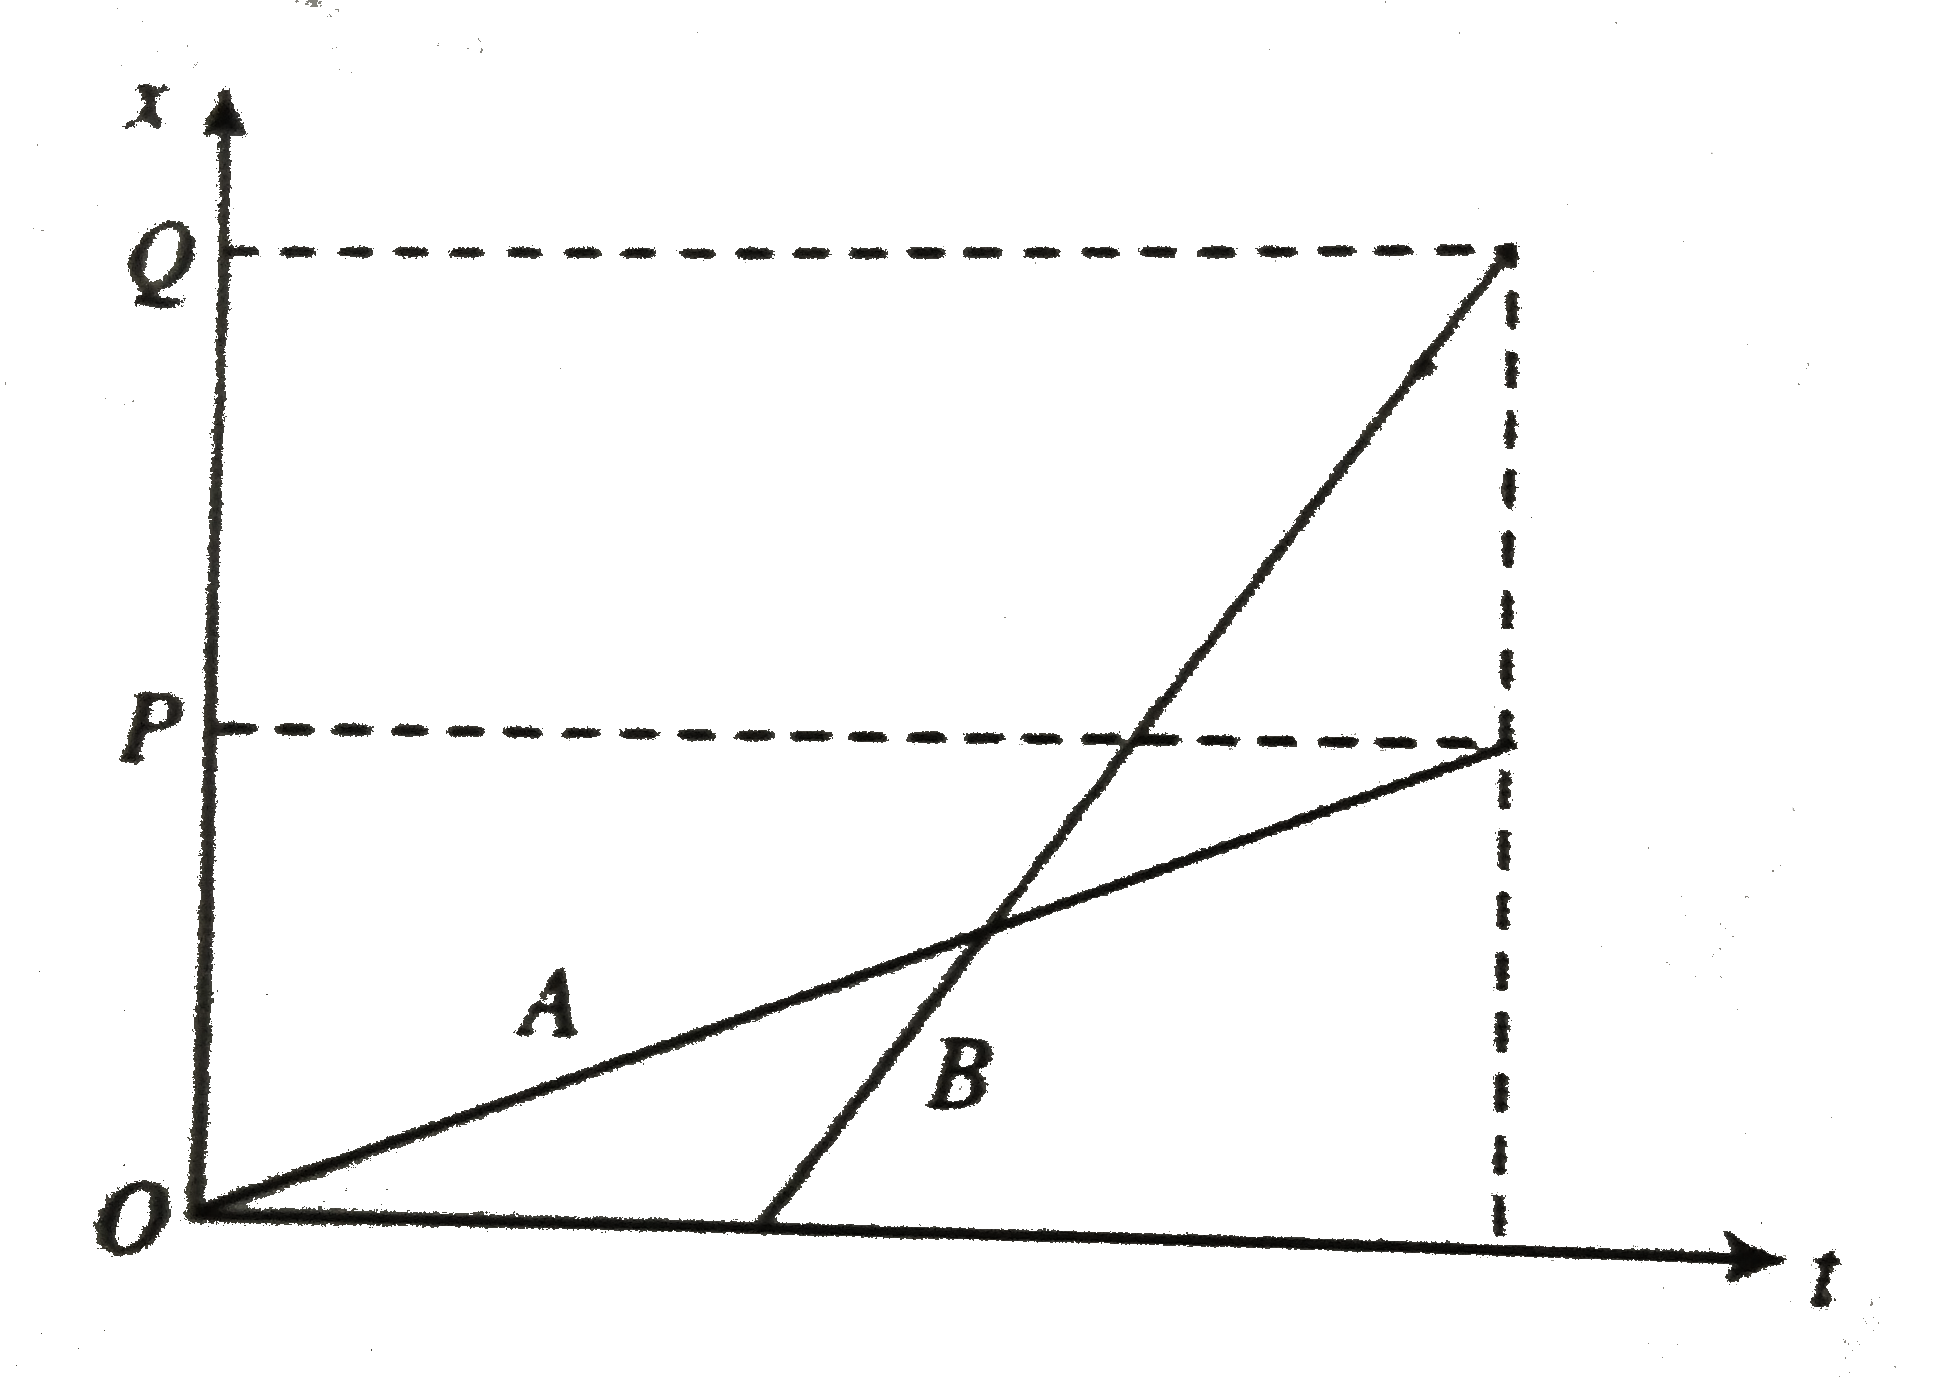
The position-time (x-t) graphs for two children A and B returning from their school O to their homes P and Q, respectively, are shown in figure. P Choose the correct answer.

(i) A and B reach home at the (same/different) time.
(ii) A or B overtakes on the road (once/twice).
View SolutionThe position-time (x-t) graphs for two children A and B returning from their school O to their homes P and Q, respectively, are shown in . Choose the
 .
.
a.(A/B) Iives closer to school than (B/A).
b. (A/B) starts from the school earlier than (B/A).
c. (A/B) walks faster than (B/A).
d. A and B reach home at the (same//differnt) time.
e. (A//B) overtakes on the road (once//twice).
View Solution
Knowledge Check
The position- time (x-t) graphs for two rabbits A and B moving from their carrot field O to their homes P and Q respectively along straight line path (taken as x axis ) are shown in figure below. Choose the correct statement(s):
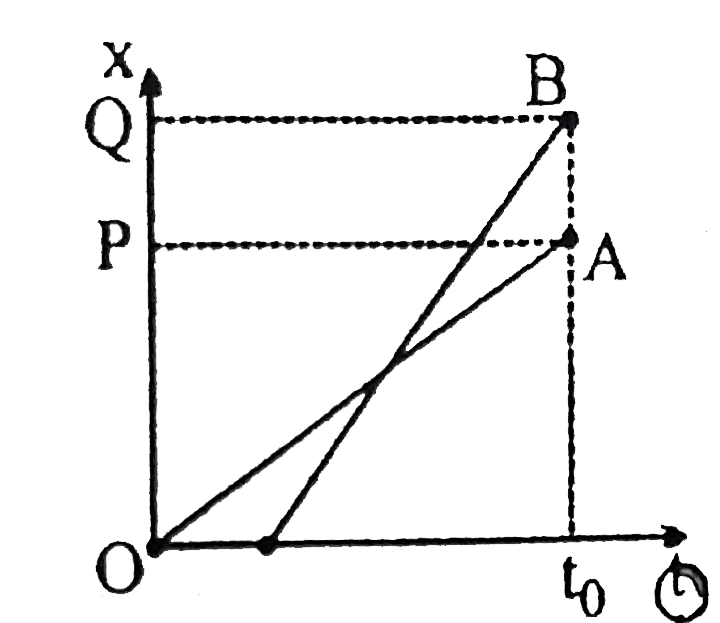 AA lives closer to the carrot field than BBA starts from the carrot field earlier than BCA and B have equal average velocities from 0→t0DB overtakes A on the way
The velocity - time graph of two bodies A and B is shown in figure. Choose correct statement.
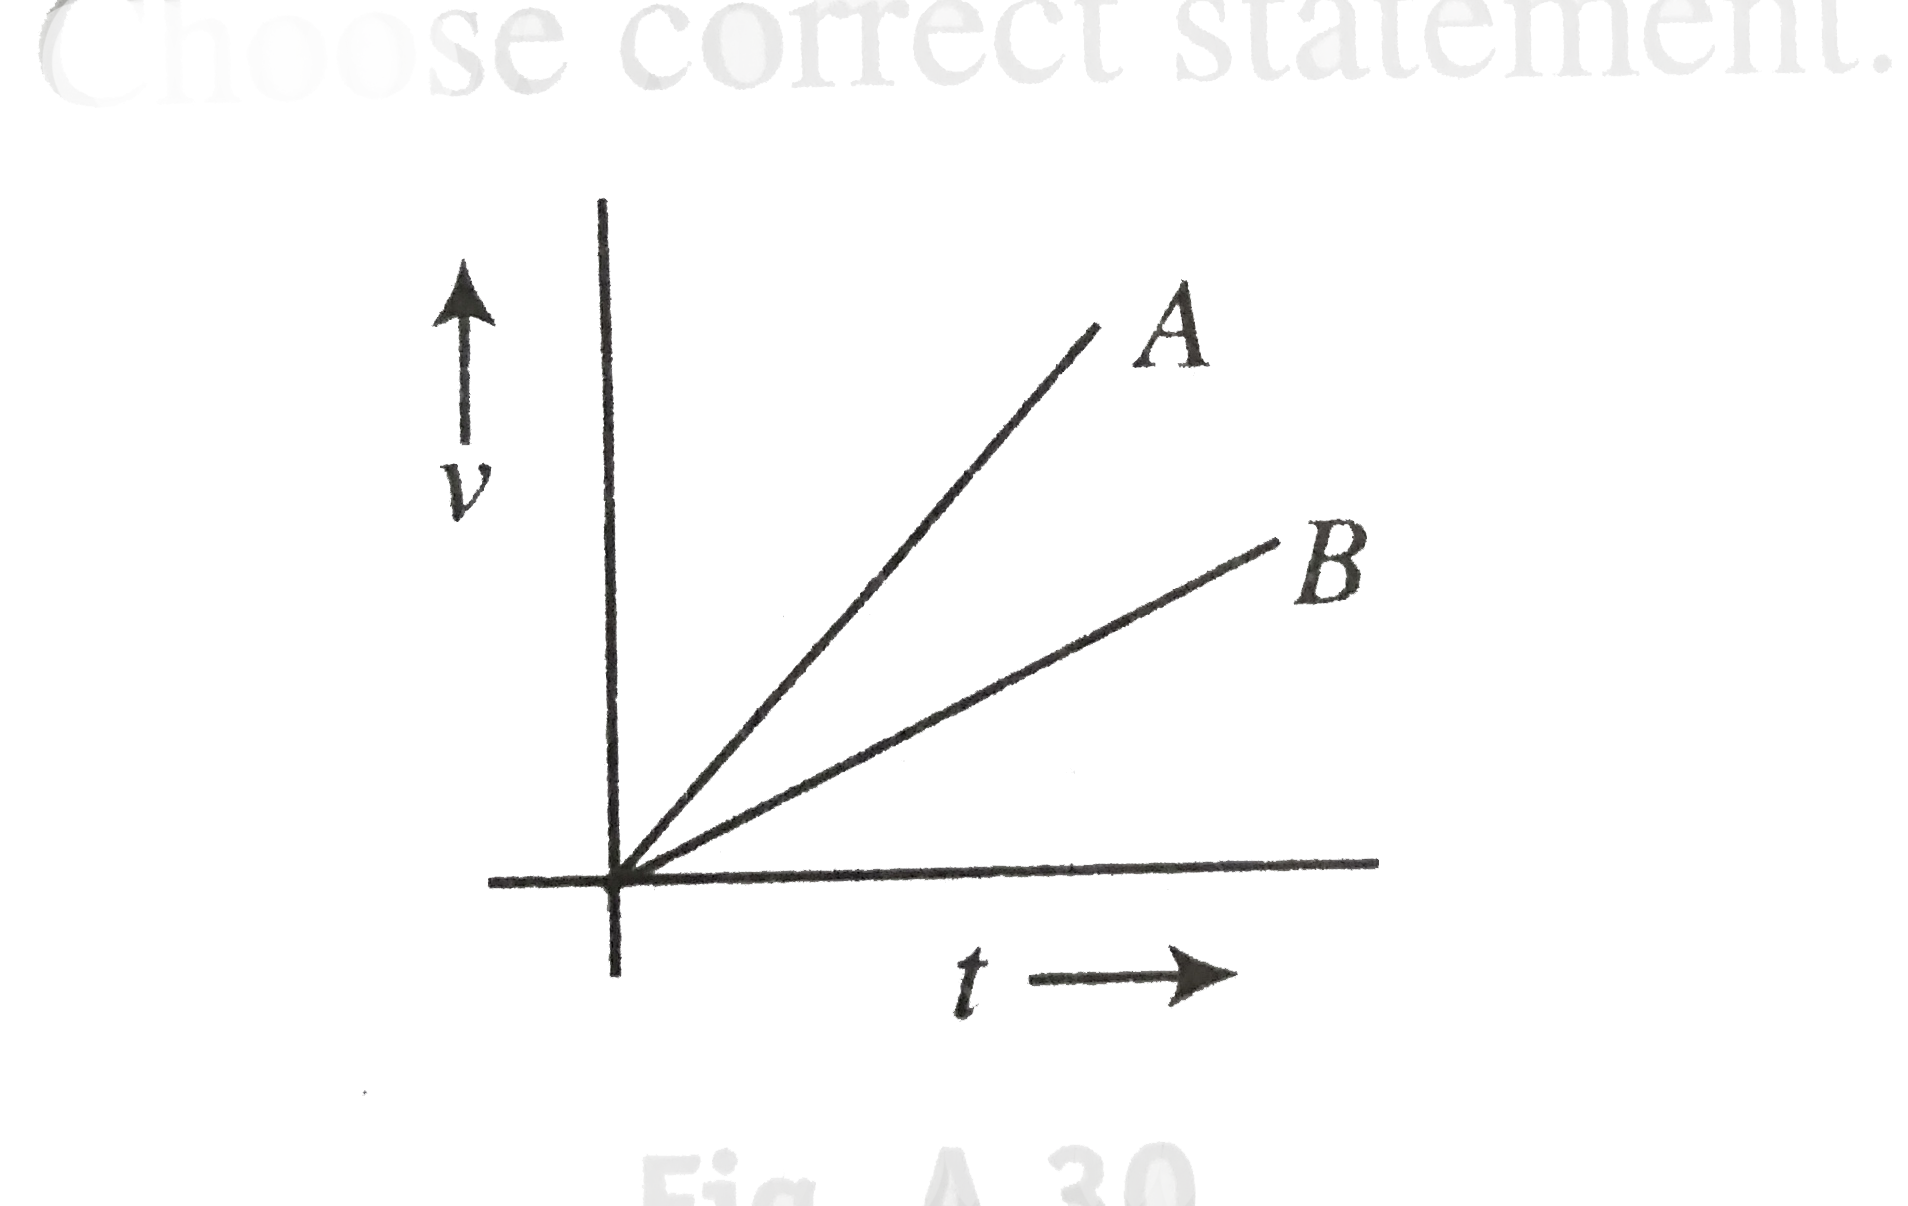 Aacceleration of Bgt acceleration of ABacceleration of A gt acceleration of BCboth are starting from same pointDA covers greater distance than B in the same time.
For a particle moving along x-axis, a scaled x-6 graph is shown in figure. Mark the correct statement (s).
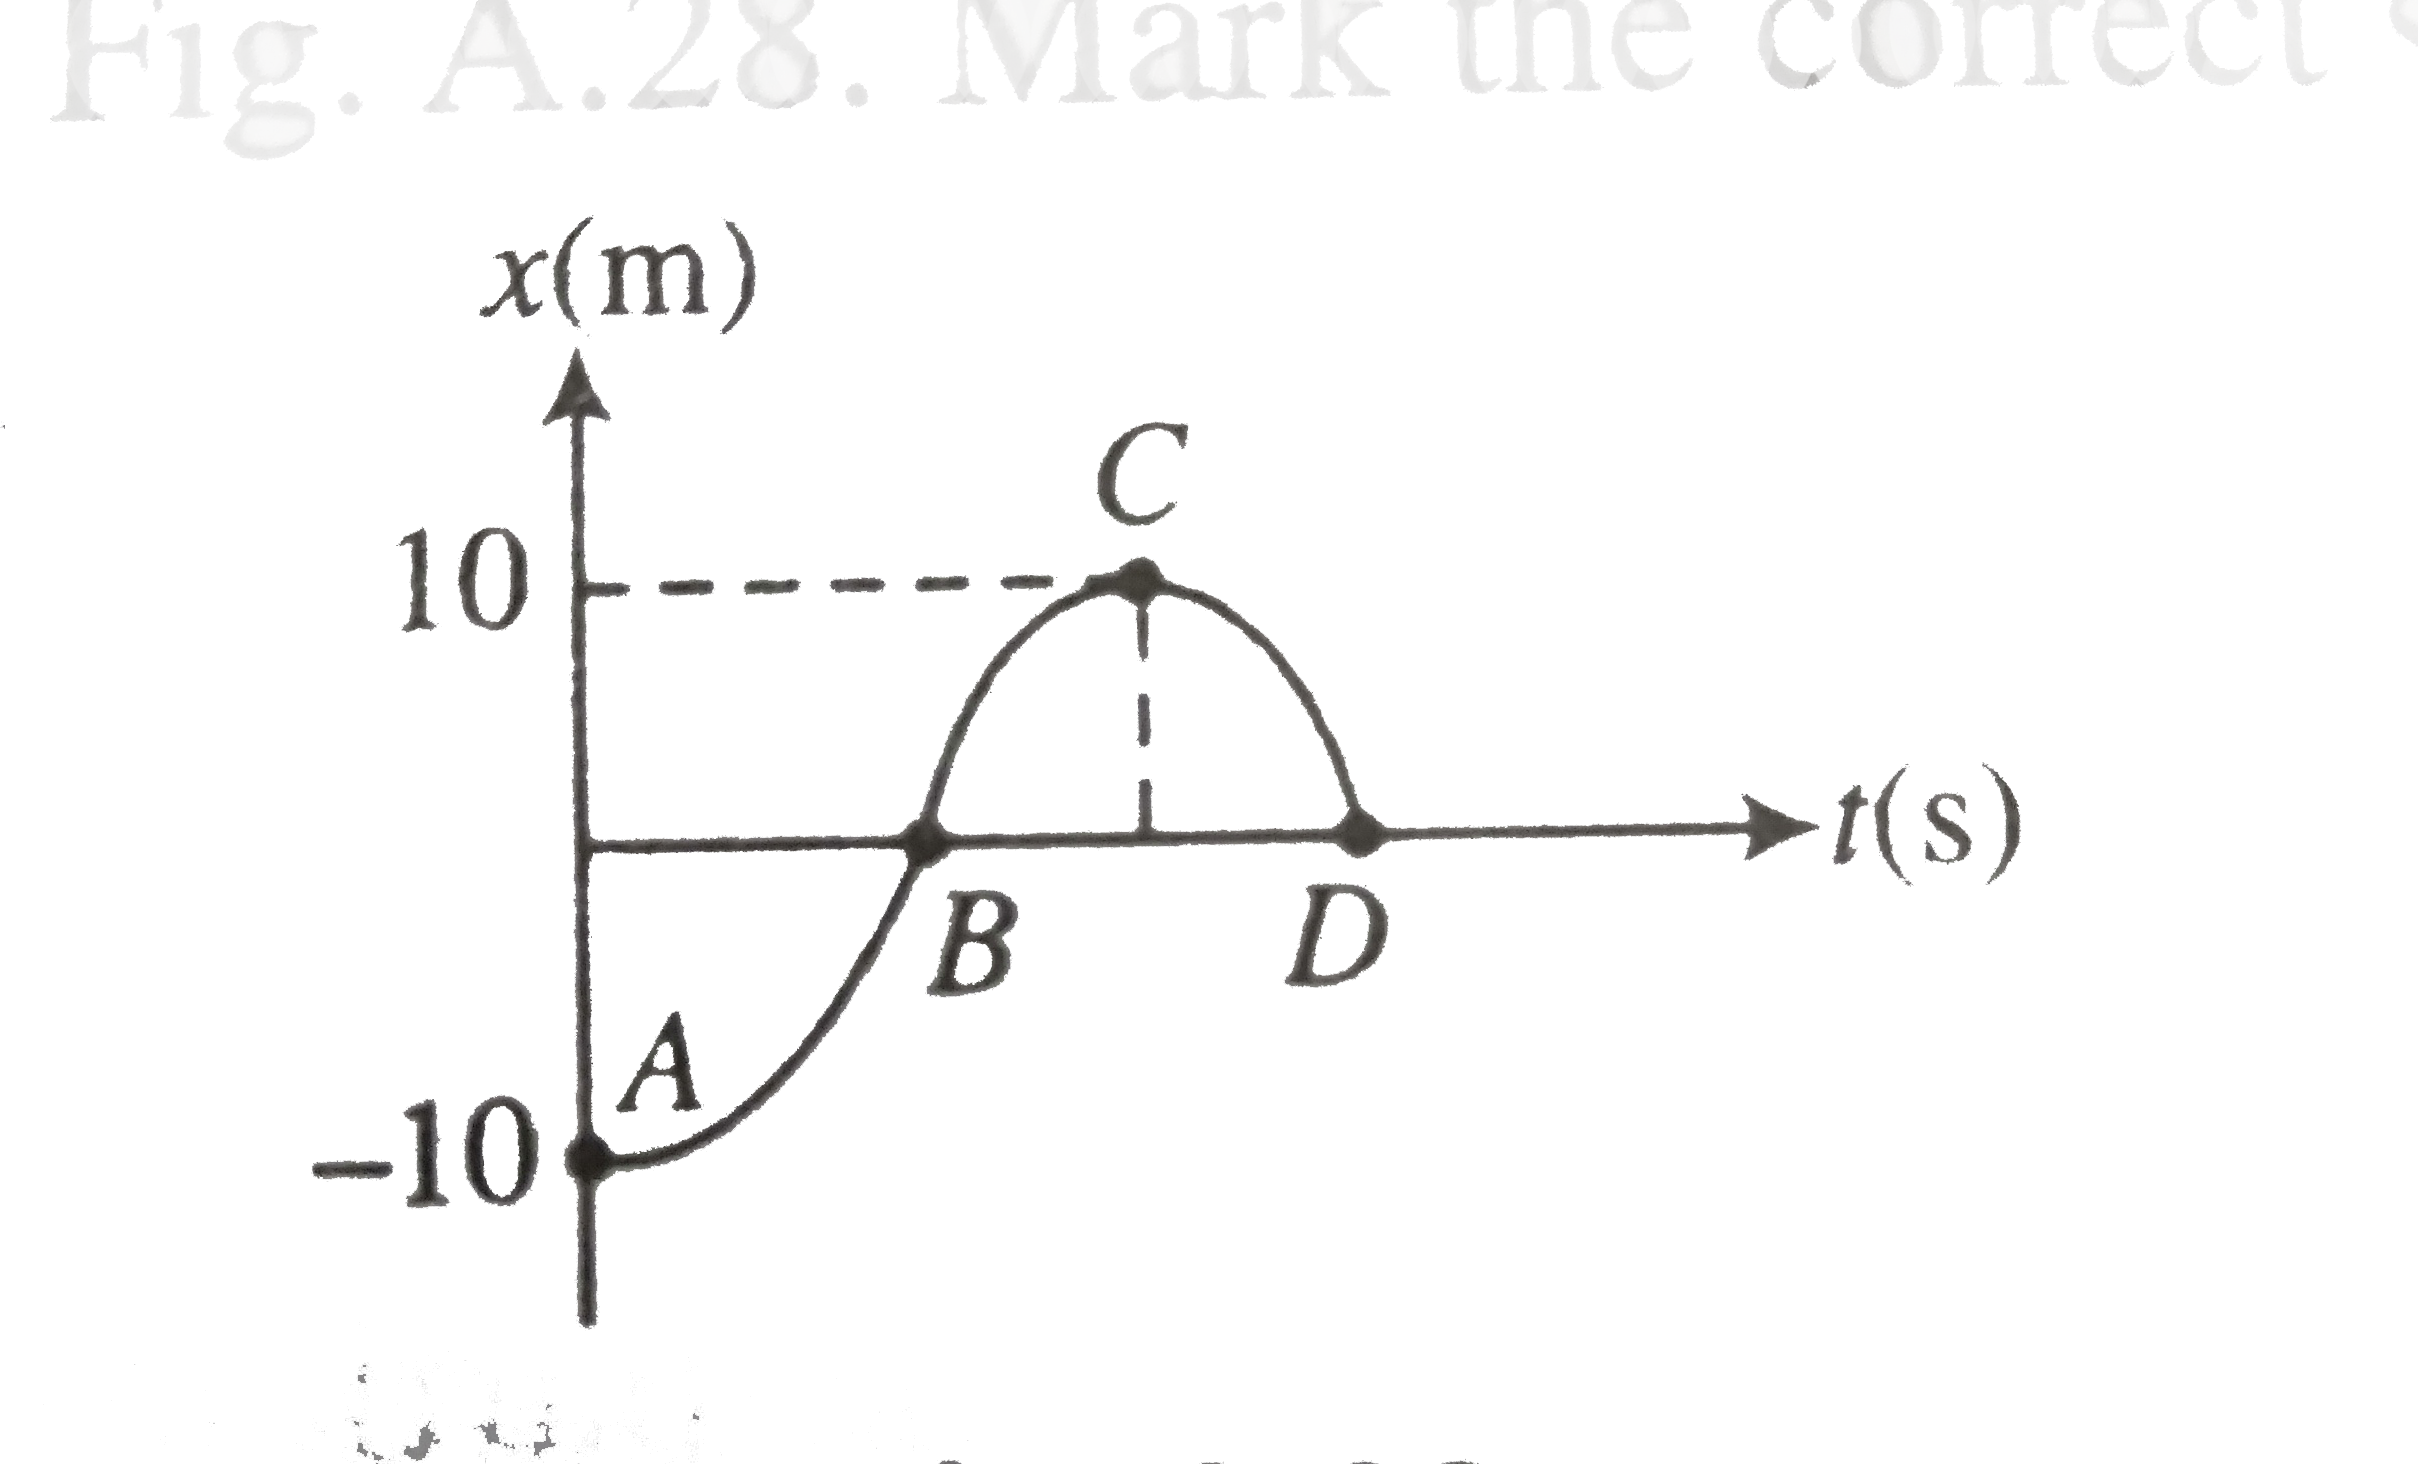 ASpeed of the particle is greatest at C.BSpeed of the particle is greatest at B.CParticle is speeding up in region marked CD.DParticle is speeding up in region marked AB.
The position-time graph for two particles P and Q moving on x-axis is shown in the figure. Then
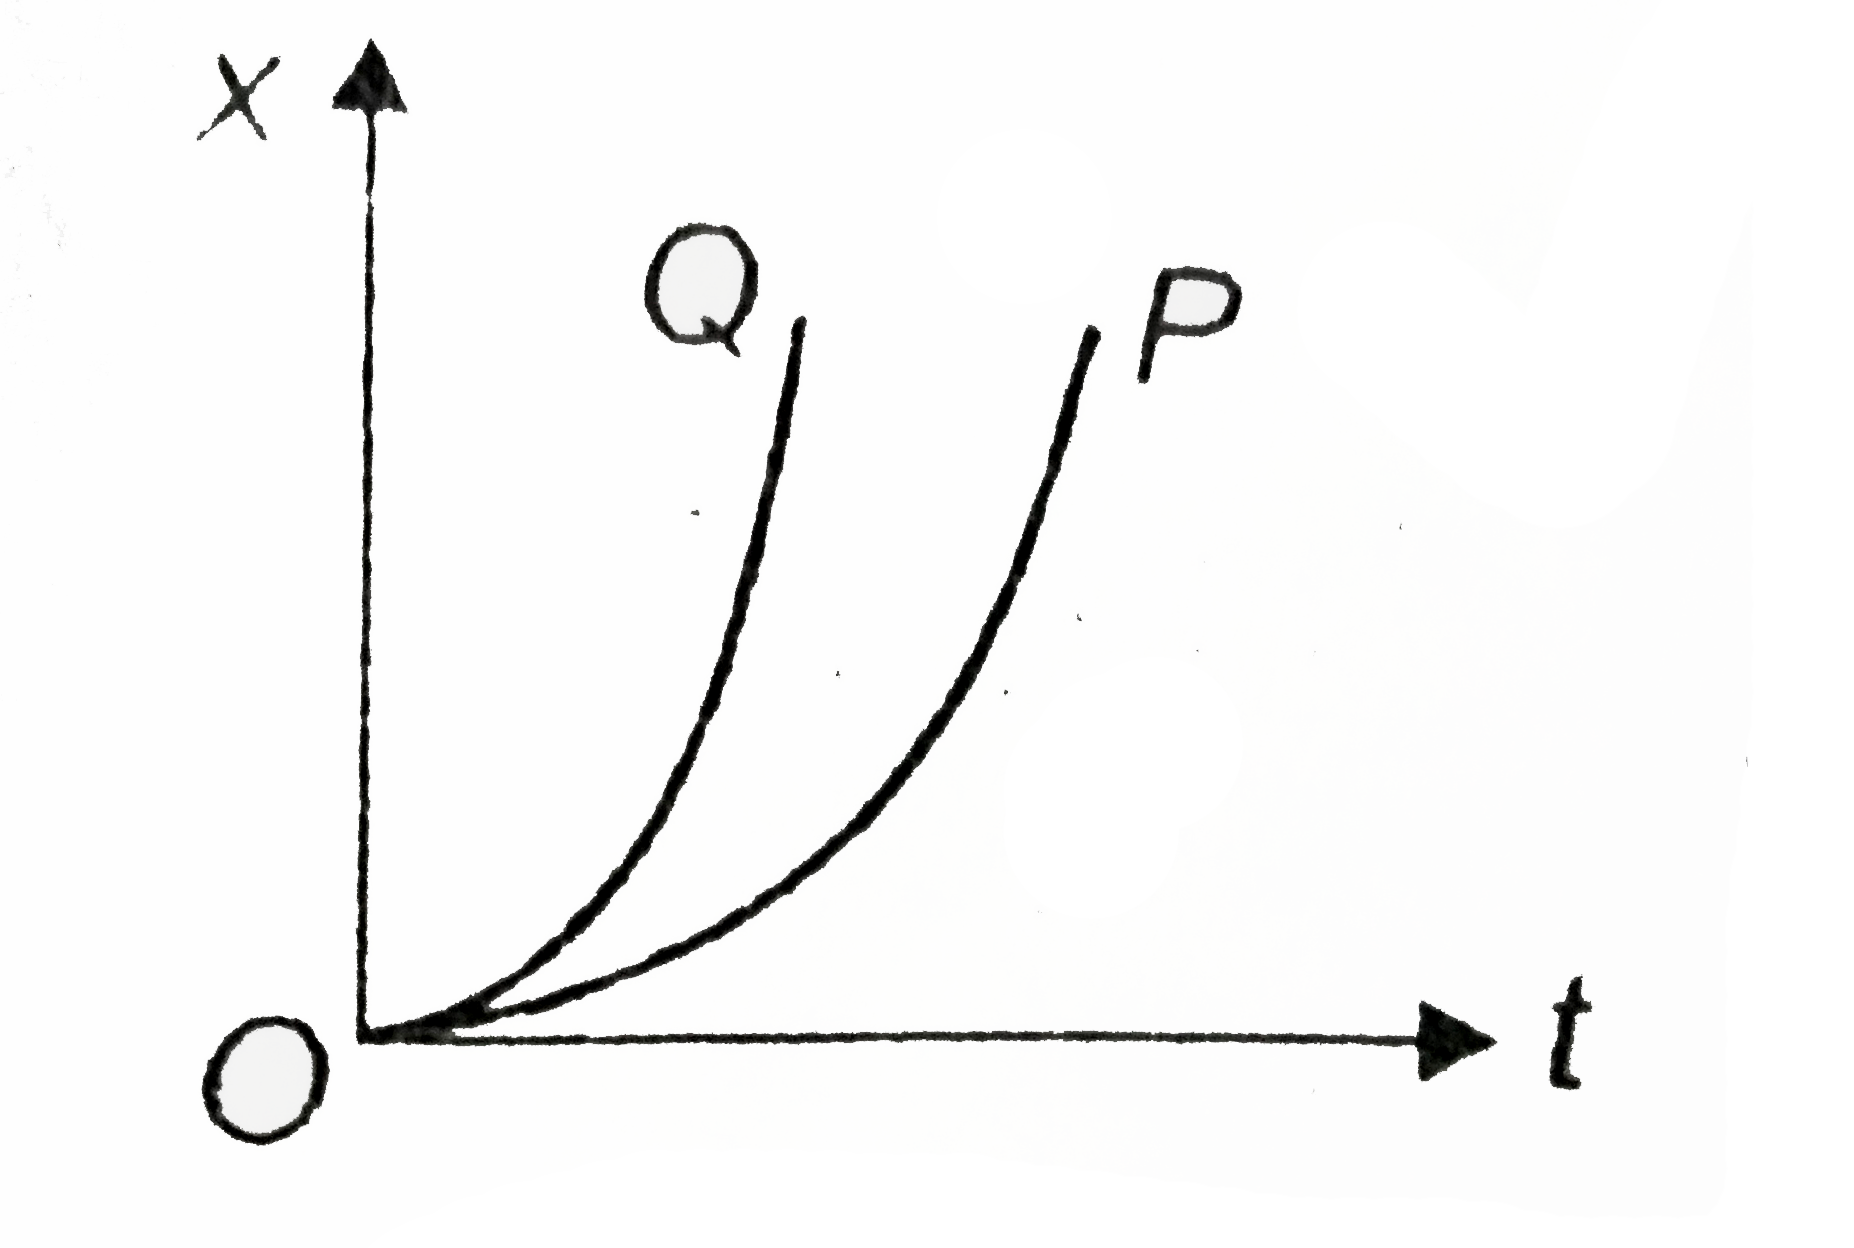
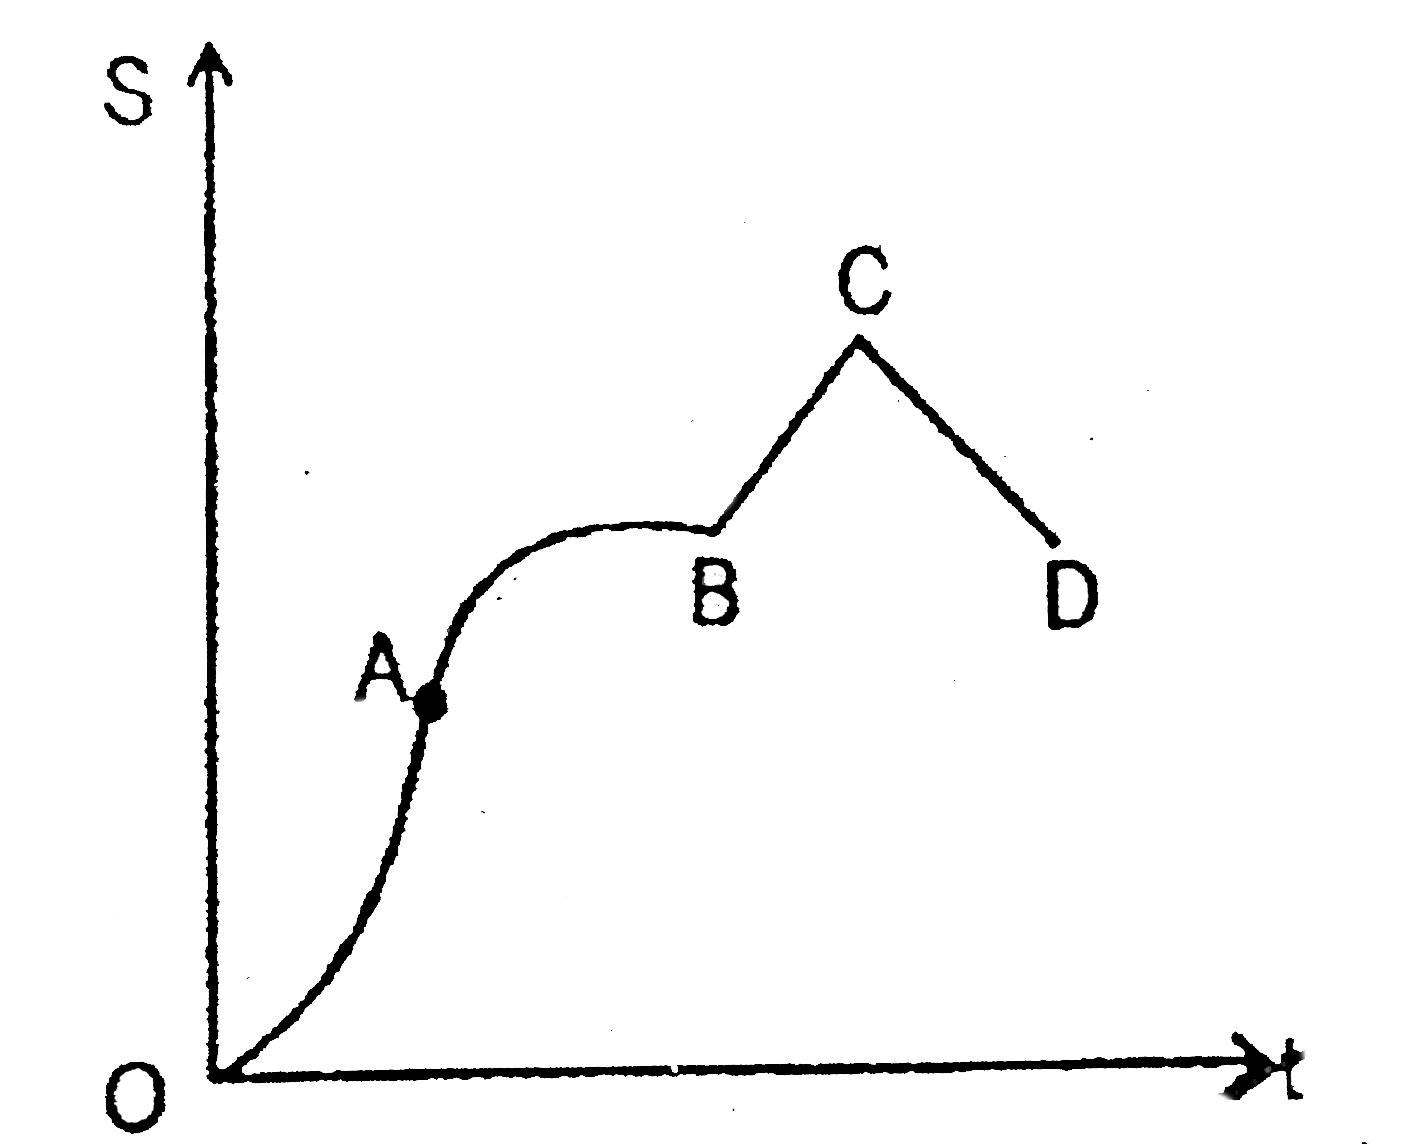
View SolutionDisplacment-time graph of a particle moving in a straight line is as shown in figure. Choose the INCORRECT statement(s)
View SolutionDisplacement time graph of a particle moving in a straight line is as shown in figure. Select the correct alternative (s) :
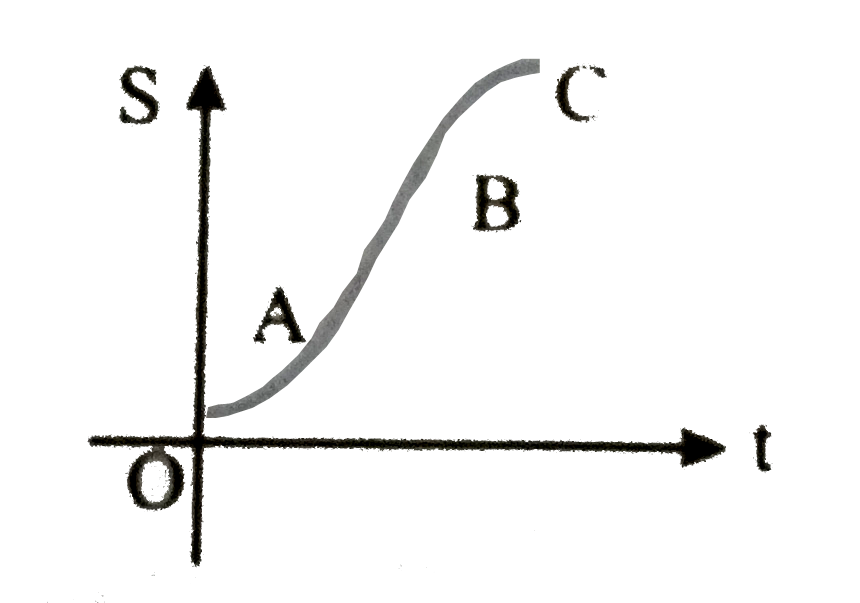 .
.
View Solution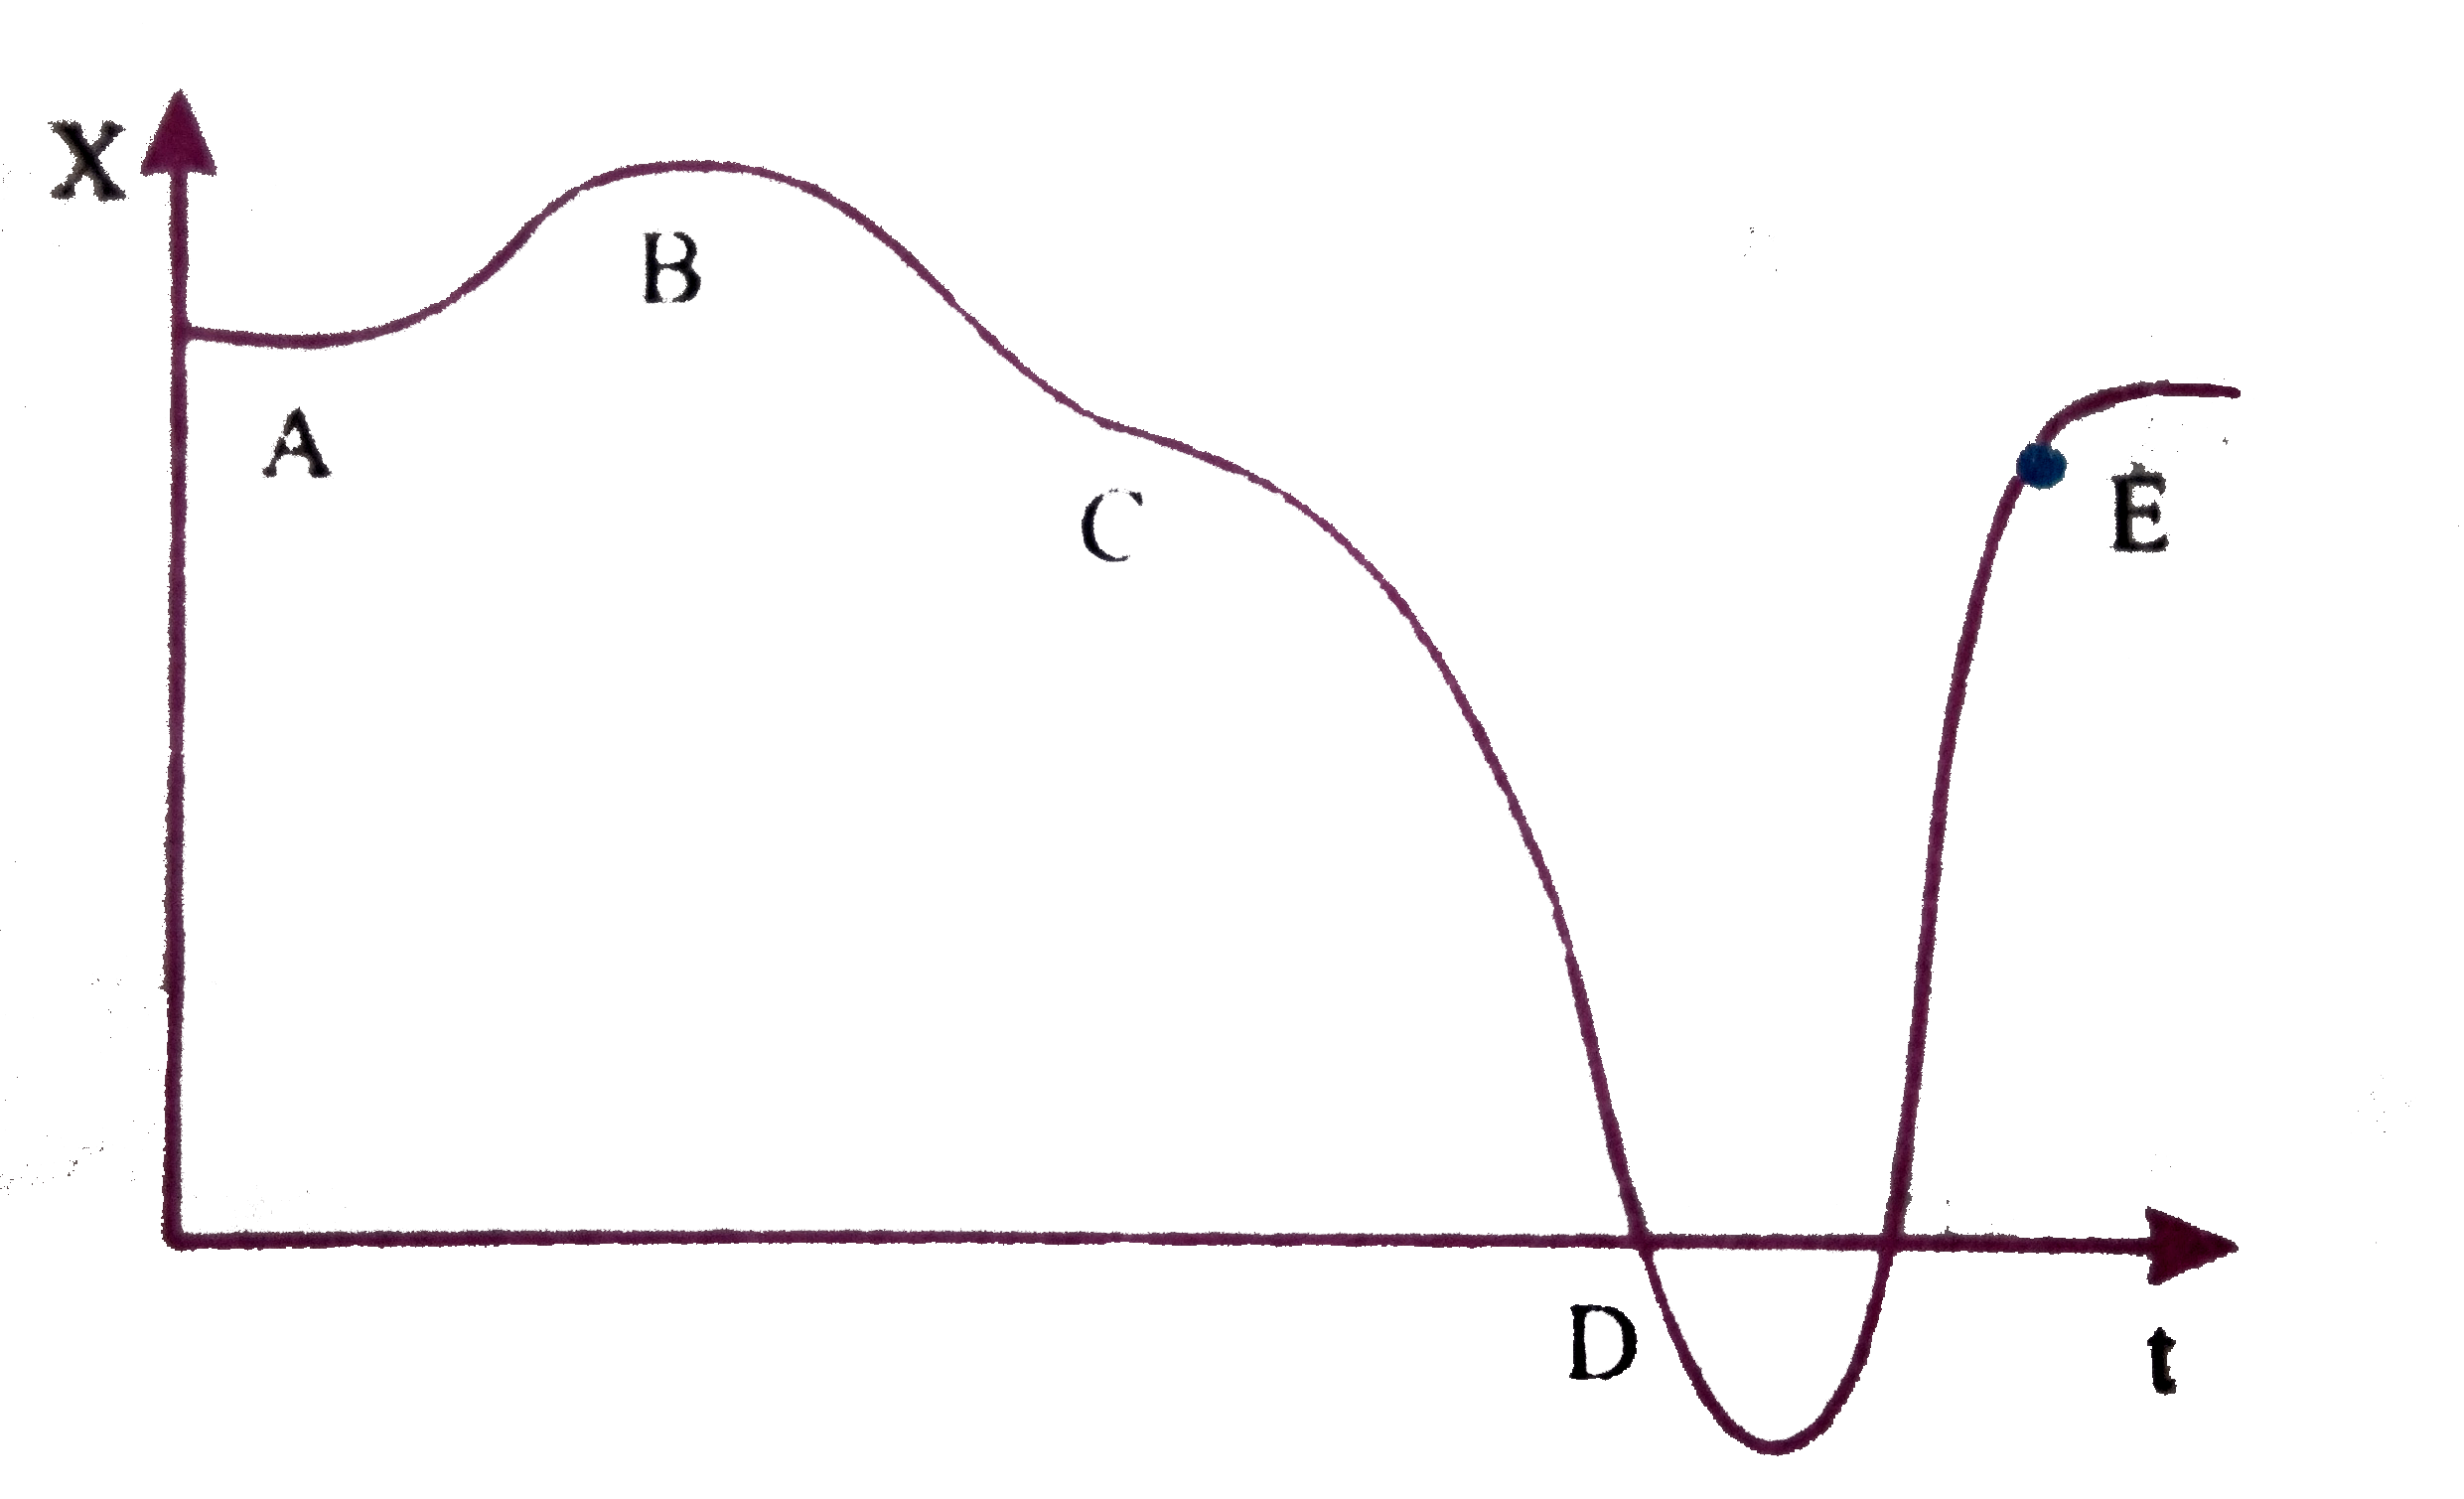
A graph of x versus t is shown in figure. Choose correct alternative from below.
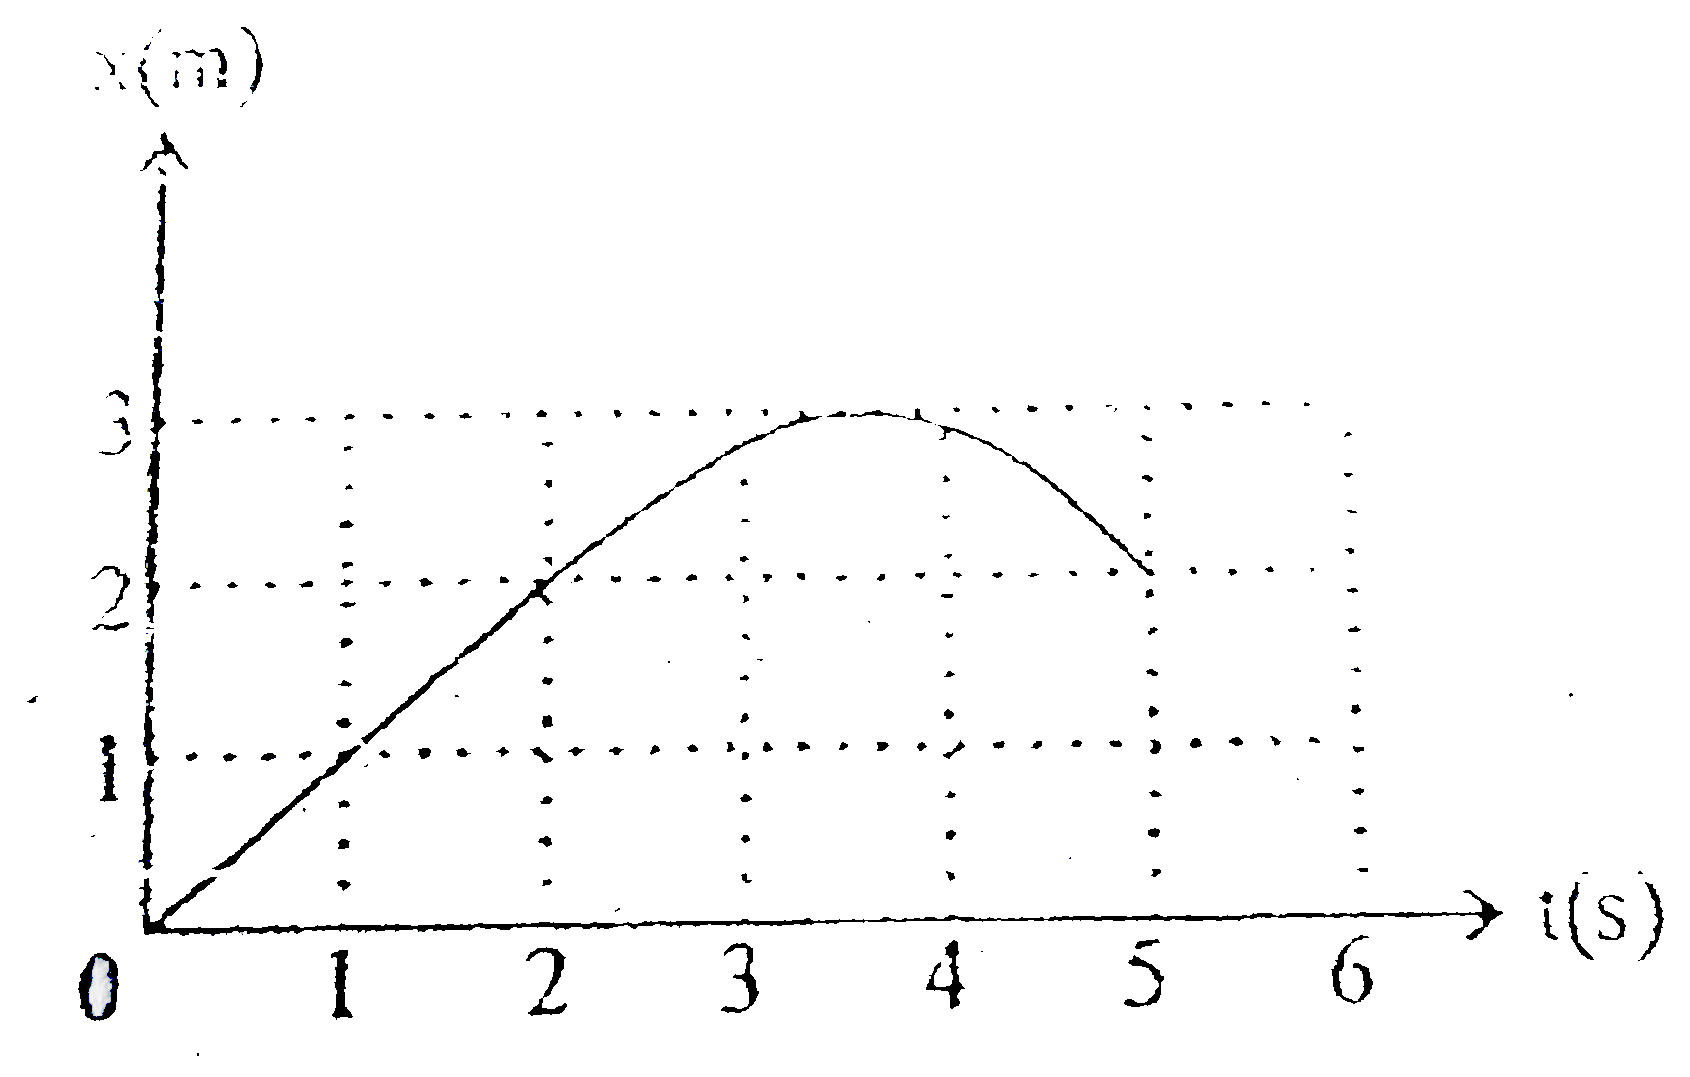
View SolutionA particle moved along the X−axis according to the graph shown in Figure. Choose the incorrct options.
View Solution
