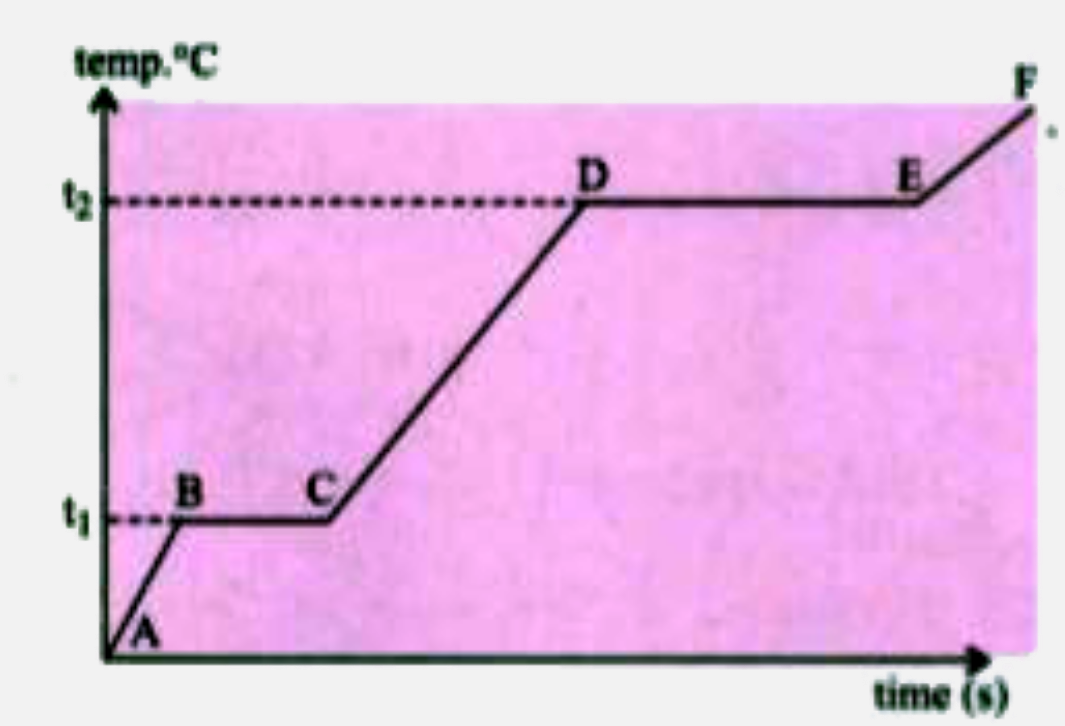
Explain the following temperature vs time graph.

Text Solution
1.The figure represents the graph of temperature versus time for different phases of water.
2. In this graph, line AB represents conversion of ice into water at constant temperature. When ice is heated it melts at 0∘C and converts into water at this constant temperature. The ice absorbs heat energy during this transition and the absorption of energy continues till all the ice converts into water.
3.This constant temperature, at which the ice converts into water is called the melting point of ice.
4. The heat energy absorbed at constant temperature during transformation of solid into liquid is called the latent heat of fusion.
5. Once all the ice is transformed into water, the temperature of water starts rising and reaches 100∘C. Line BC in the graph represents rise in temperature of water from 0∘C to 100∘C.
6. Thereafter, even though heat energy is supplied to water, its temperature does not rise. The heat energy is absorbed by water at this temperature and is used to break
the bonds between molecules of the liquid and convert the liquid into gaseous state.
7. The constant temperature at which the liquid transforms into gaseous state is called the boiling point of the liquid.
8. The heat energy absorbed at constant temperature during transformation of liquid
into gas is called the latent heat of vapourization.
|
Topper's Solved these Questions
- HEATBook:UNIQUE PUBLICATIONChapter:HEATExercise:INTEXT ACTIVITIES
Explore 10 Videos
- HEATBook:UNIQUE PUBLICATIONChapter:HEATExercise:ACTIVITY QUESTIONS
Explore 22 Videos
- HEATBook:UNIQUE PUBLICATIONChapter:HEATExercise:DEFINE
Explore 12 Videos
- GRAVITATIONBook:UNIQUE PUBLICATIONChapter:GRAVITATIONExercise:NUMERICALS
Explore 15 Videos
- INTRODUCTION TO MICROBIOLOGYBook:UNIQUE PUBLICATIONChapter:INTRODUCTION TO MICROBIOLOGYExercise:Intext Activities (can you recall?)
Explore 5 Videos
Similar Questions
Knowledge Check
Which of the substances A, B or C has the highest specific heat ? The temperature vs time graph is shown
 AABBCCDAll have equal specific heat
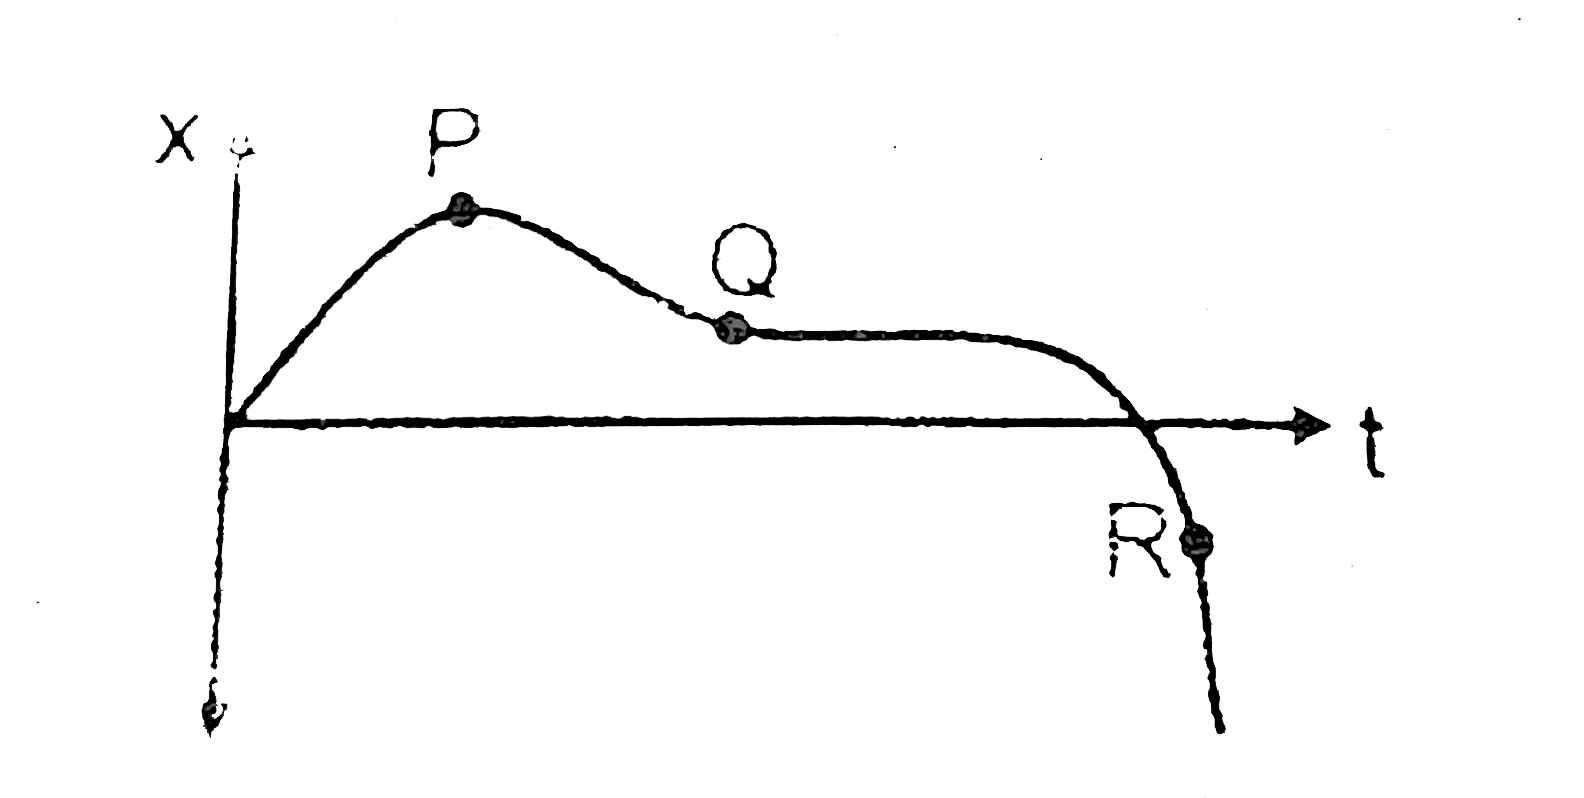
In the following displacement (x) vs time (t) graph, at which among the point P,Q and R is the object speed increasing ?
 AR onlyBP onlyCQ and R onlyDP,Q,R
In which of the following reactions the graph of concentration vs time for reactants and products will be difficult to plot.
AN2O5(g)→2NO2(g)+12O2(g)BCH3O∣∣C−OCH3(aq)[H+]−−−→CH3O∣∣C−OH+CH3OHCH2(g)+12O2(g)→H2O(l)DH2O2(aq)→H2O(l)+12O2(g)
In the following displacement (x) vs time (t) graph, at which among the point P,Q and R is the object speed increasing ?

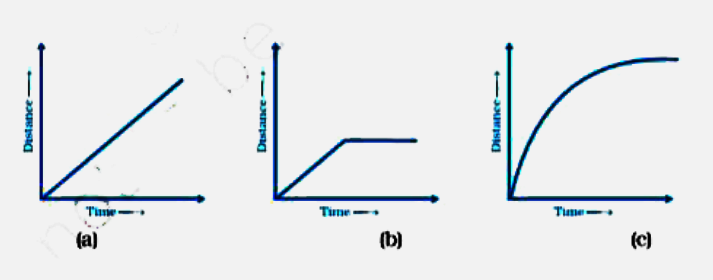
View SolutionExplain the situations represented by the following distance-time graphs.

View SolutionExplain the situations represented by the following distance-time graphs :

View SolutionIf liquefied oxygen at 1 atmospheric pressure is heated from 50K to 300k by supplying heat at constant rate. The graph of temperature vs time will be
View SolutionIf liquefied oxygen at 1 atmospheric pressure is heated from 50K to 300k by supplying heat at constant rate. The graph of temperature vs time will be
View Solution

