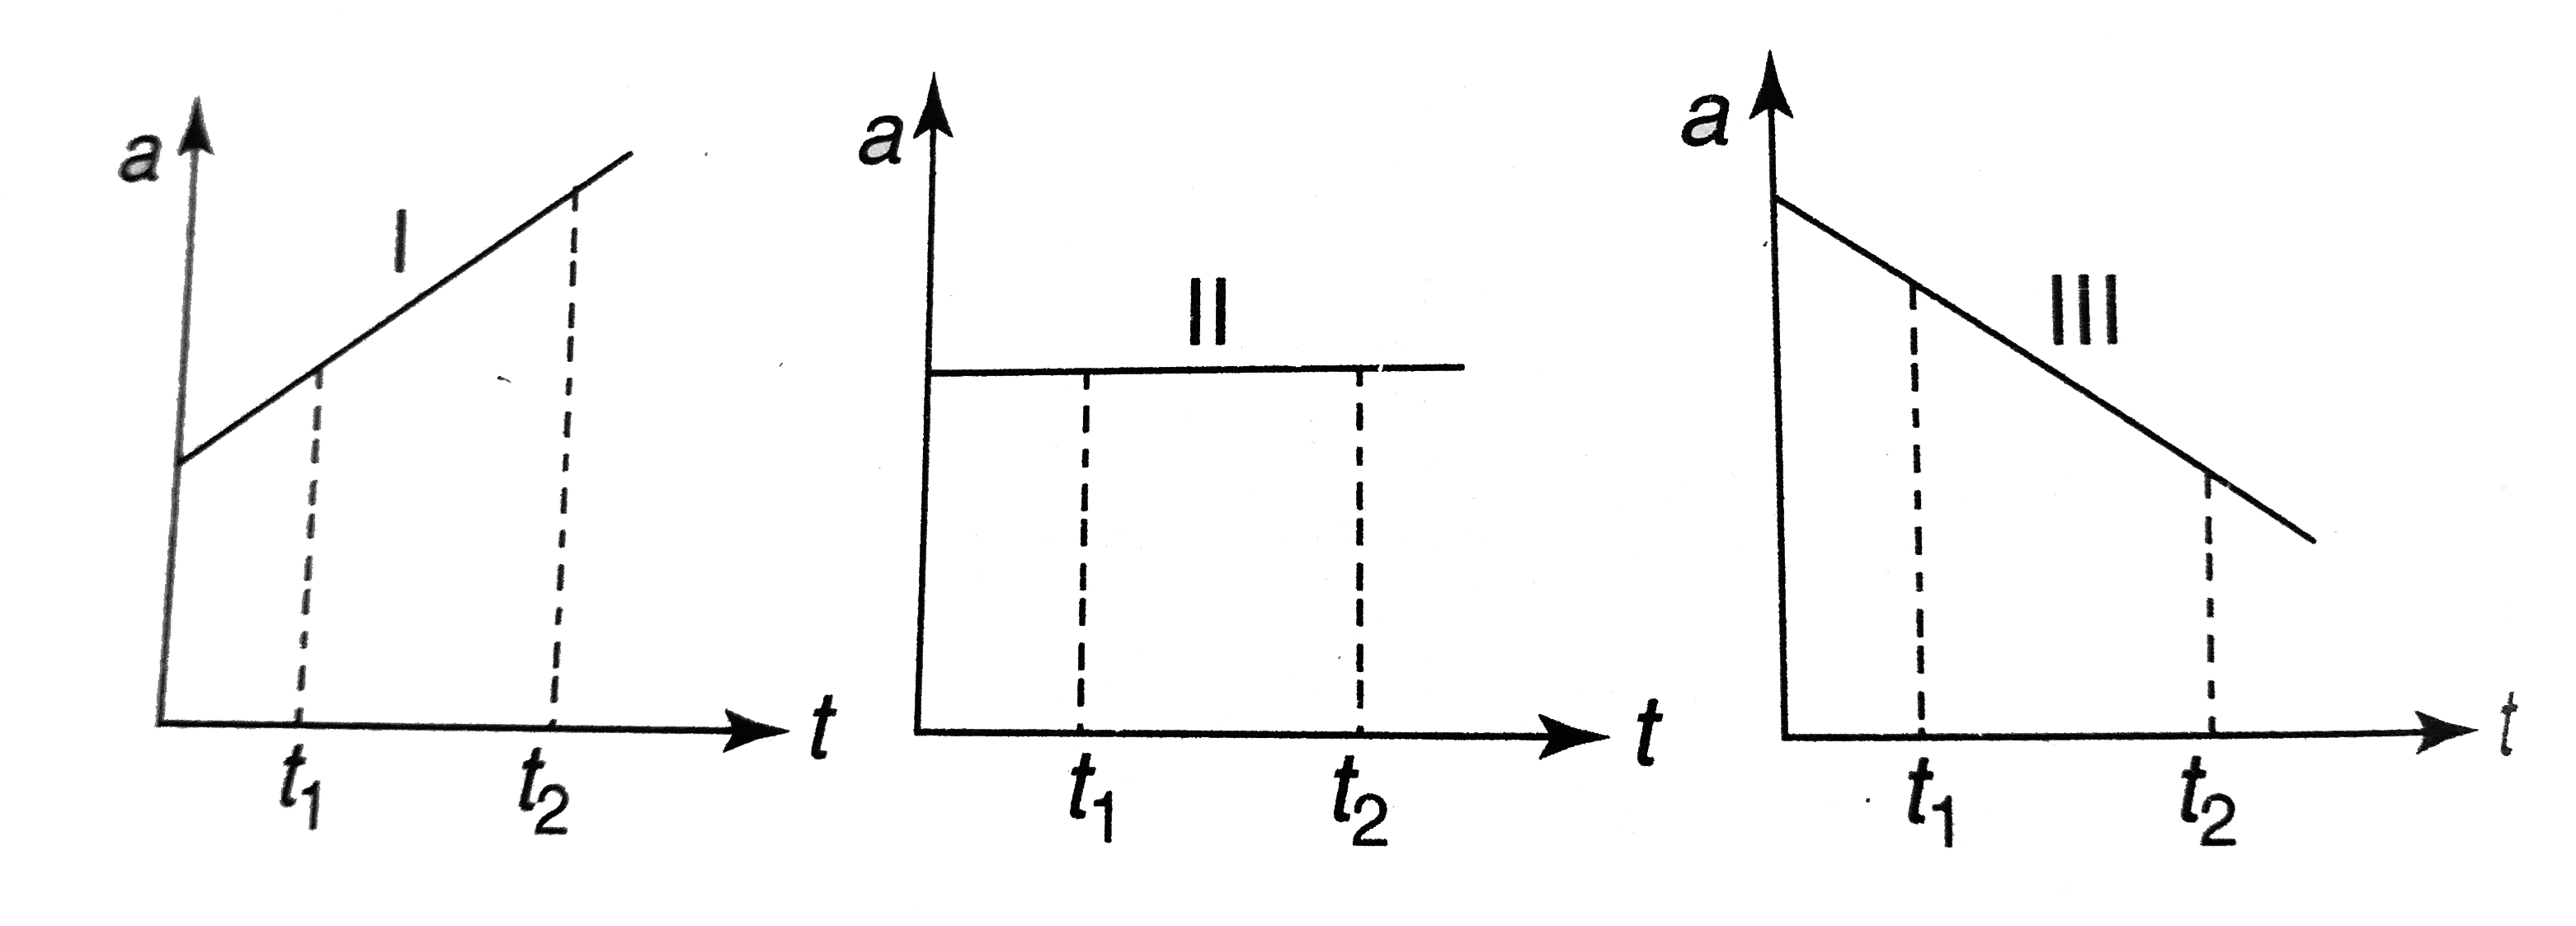
Each of the three graphs represents acceleration versus time for an object that already has a positive velocity at time . Which graphs show an object whose speed is increasing for the entire time interval between ?
graph , only
graphs , only
graphs , only
graphs .
The correct Answer is:D
Acceleration is positive in all three graphs, so velocity increases in all three.
Topper's Solved these Questions
- GENERAL KINEMATICS AND MOTION IN ONE DIMENSIONBOOK - A2ZCHAPTER - GENERAL KINEMATICS AND MOTION IN ONE DIMENSIONEXERCISE - Problem Based On Mixed Concepts
30 Videos
- GENERAL KINEMATICS AND MOTION IN ONE DIMENSIONBOOK - A2ZCHAPTER - GENERAL KINEMATICS AND MOTION IN ONE DIMENSIONEXERCISE - Assertion Reasoning
20 Videos
- GENERAL KINEMATICS AND MOTION IN ONE DIMENSIONBOOK - A2ZCHAPTER - GENERAL KINEMATICS AND MOTION IN ONE DIMENSIONEXERCISE - Relative Motion In One Dimension
20 Videos
- FLUID MECHANICSBOOK - A2ZCHAPTER - FLUID MECHANICSEXERCISE - Chapter Test
29 Videos
- GRAVITATIONBOOK - A2ZCHAPTER - GRAVITATIONEXERCISE - Chapter Test
29 Videos
Similar Questions
Knowledge Check
The velocity-time graph of an objects is as shown. The displacement during the interval 0 to t4 is
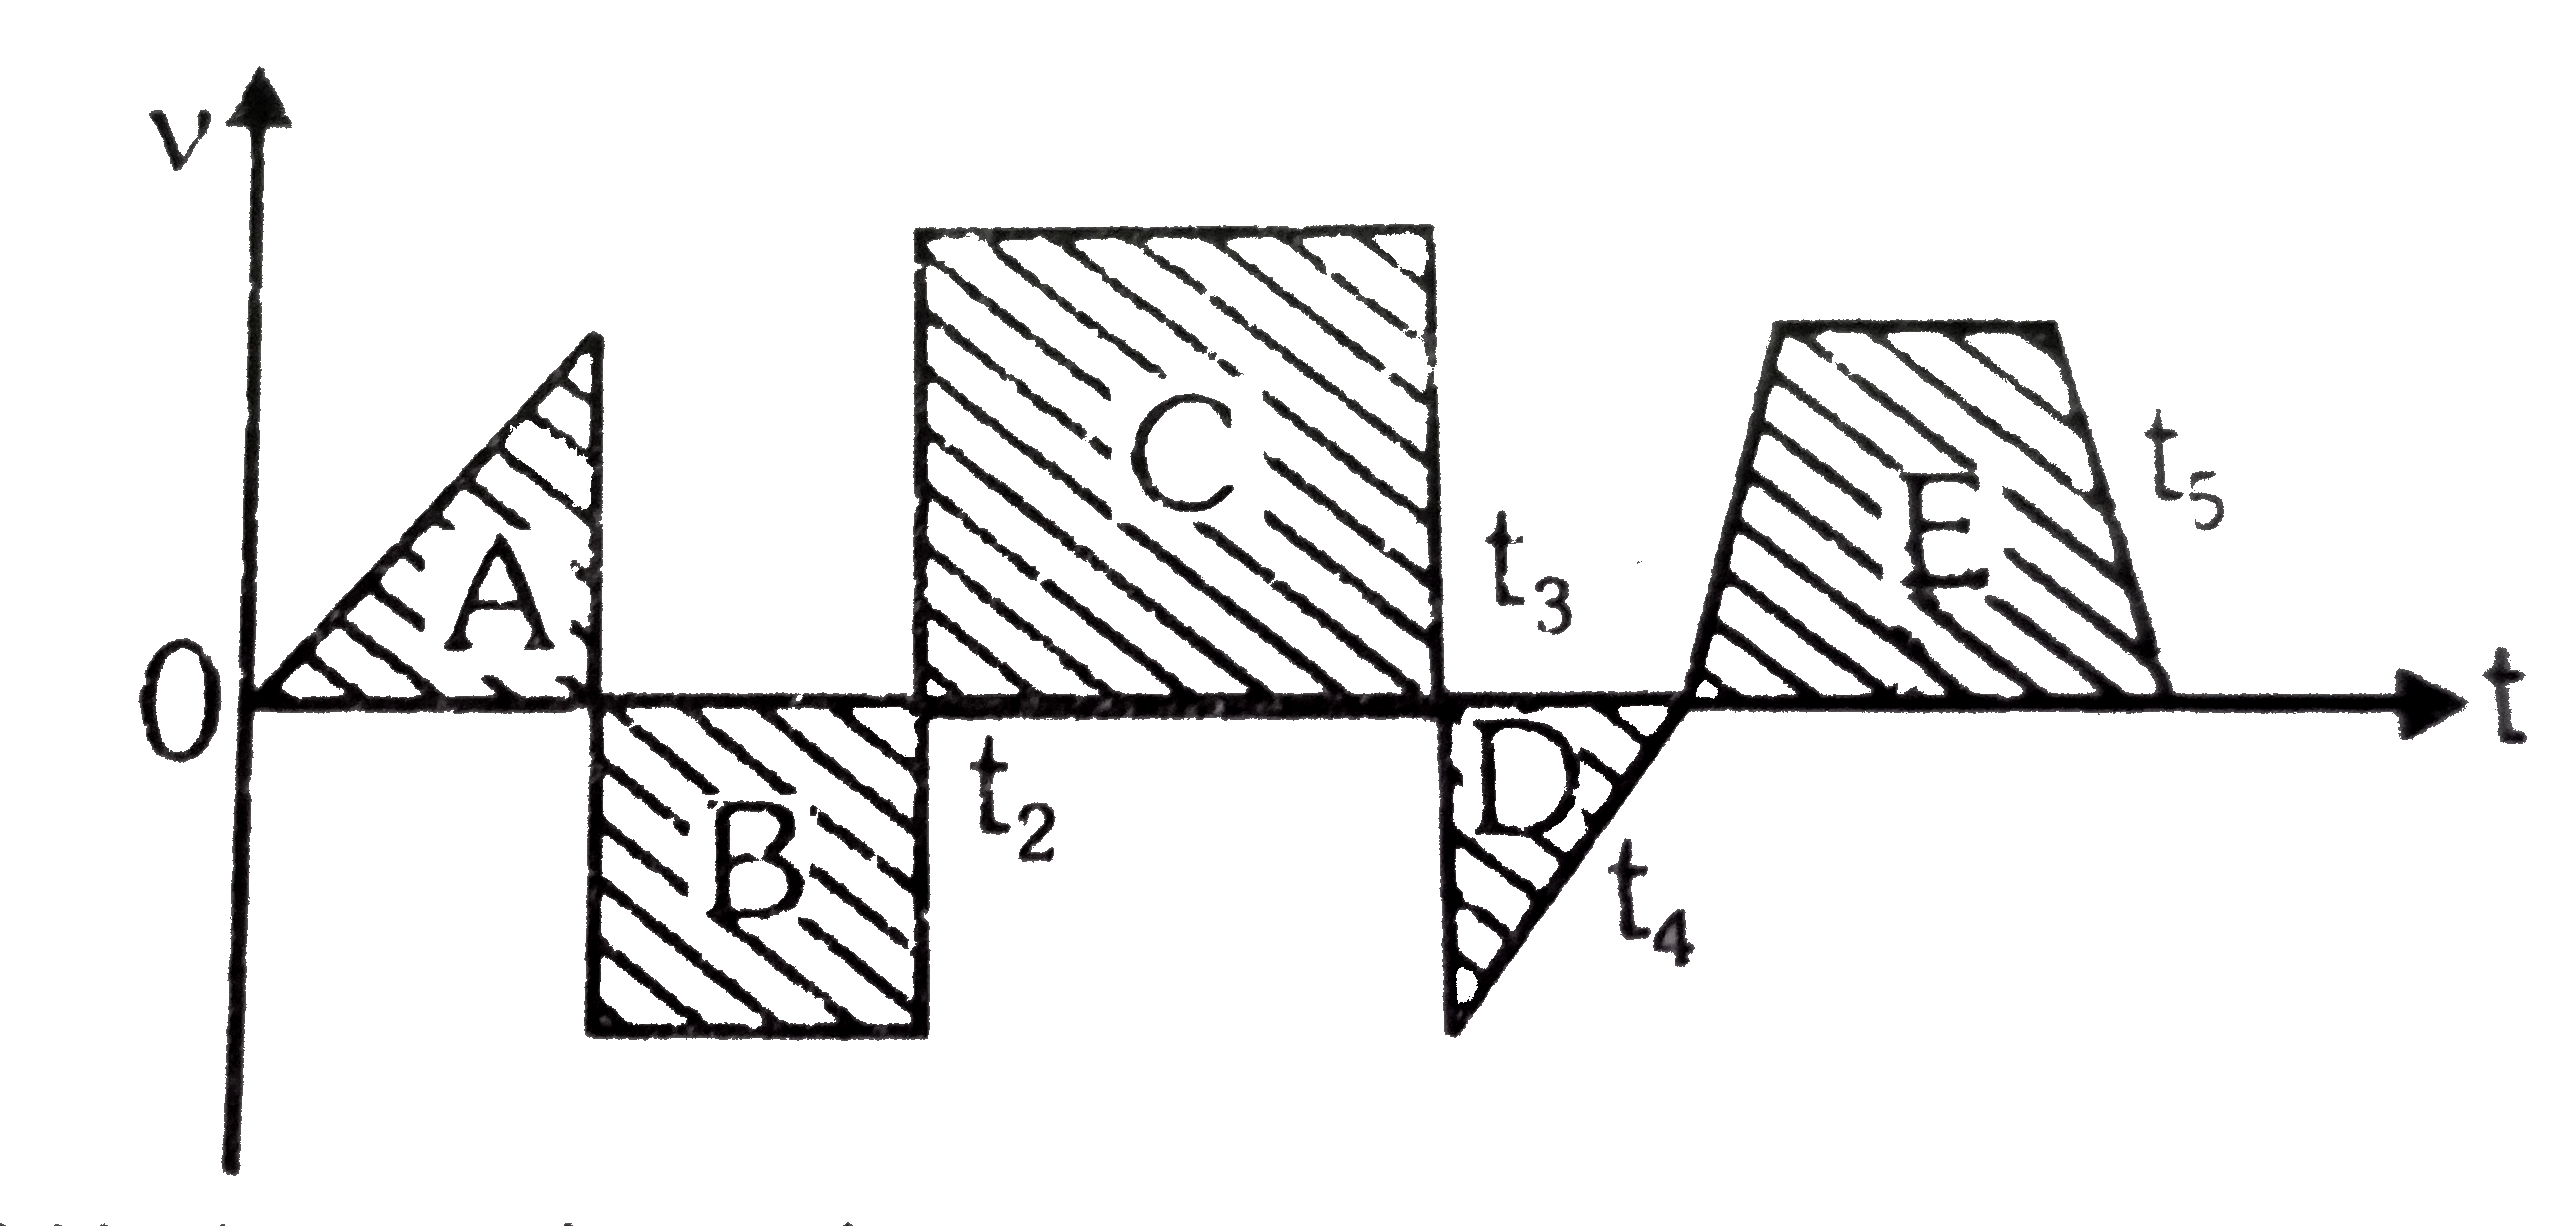 AArea A+AreaB+AreaC+AreaD+AreaEBAreaA+AreaC-AreaB-AreaDCArea+AreaB+AreaC+AreaDDAreaA+AreaC+AreaE-AreaB+AreaD
The acceleration versus time graph of a particle moving in a straight line is show in figure. The velocity-time graph of the particle would be
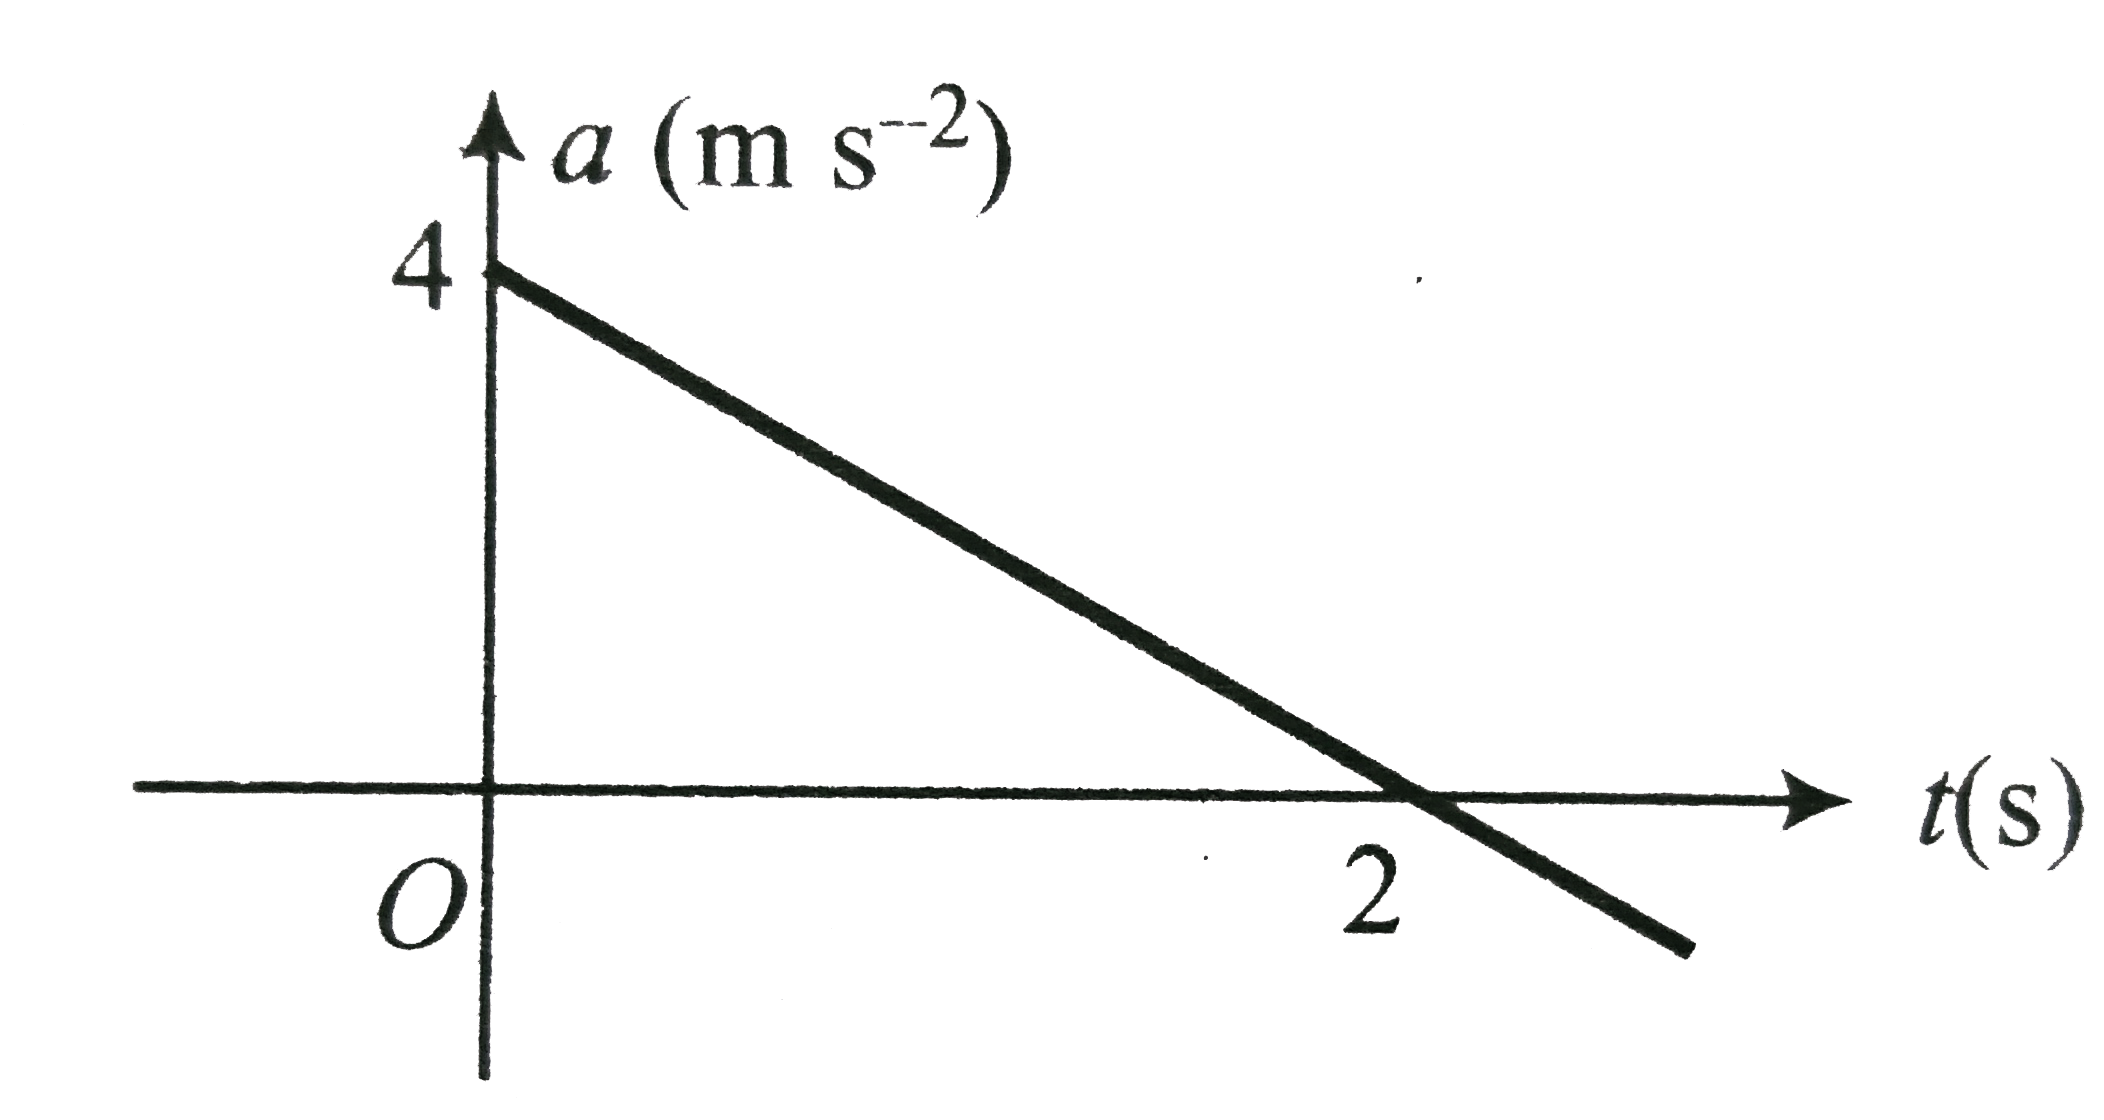 .AA straight lineBA parabolaCA circleDAn ellipse
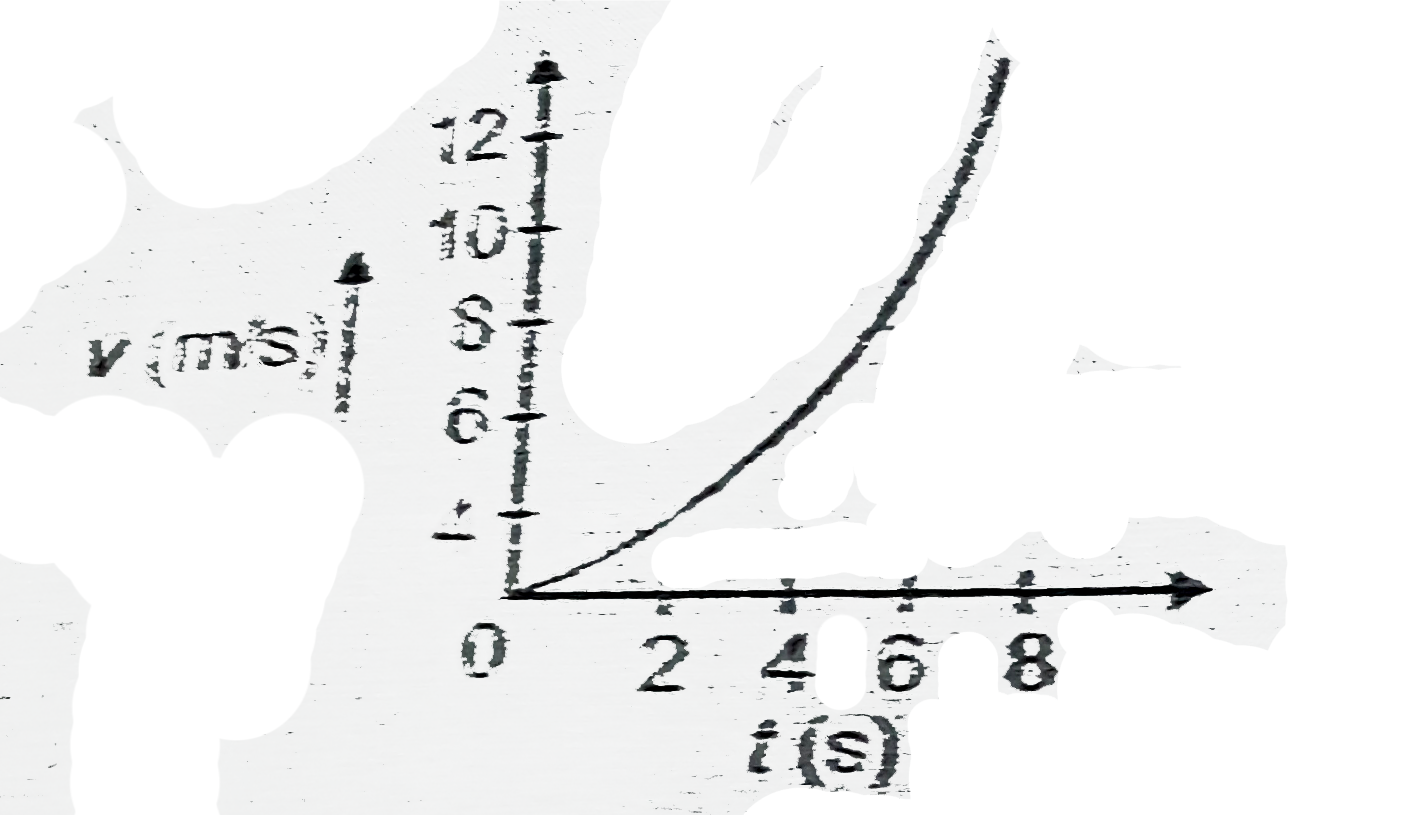
The velocity-time graph of an object is shown below. The acceleration of the object is
View SolutionPosition (x) versus time (t) graph of a particle is as shown. The velocity is zero at?
View SolutionDraw the velocity-time graph of an object moving with uniform positive acceleration.
View SolutionThe relation between the acceleration and time for an object is given below. Calculate the velocity with which the object is moving at t = 1 s.
a=3t−4t2
View SolutionDraw the velocity-time graph for an object in uniform motion. Show that the area under the velocity-time graph gives the displacement of the object in the given time interval.
View SolutionWhich of the following x-t graphs shows an object moving with negative acceleration ?

View Solution

