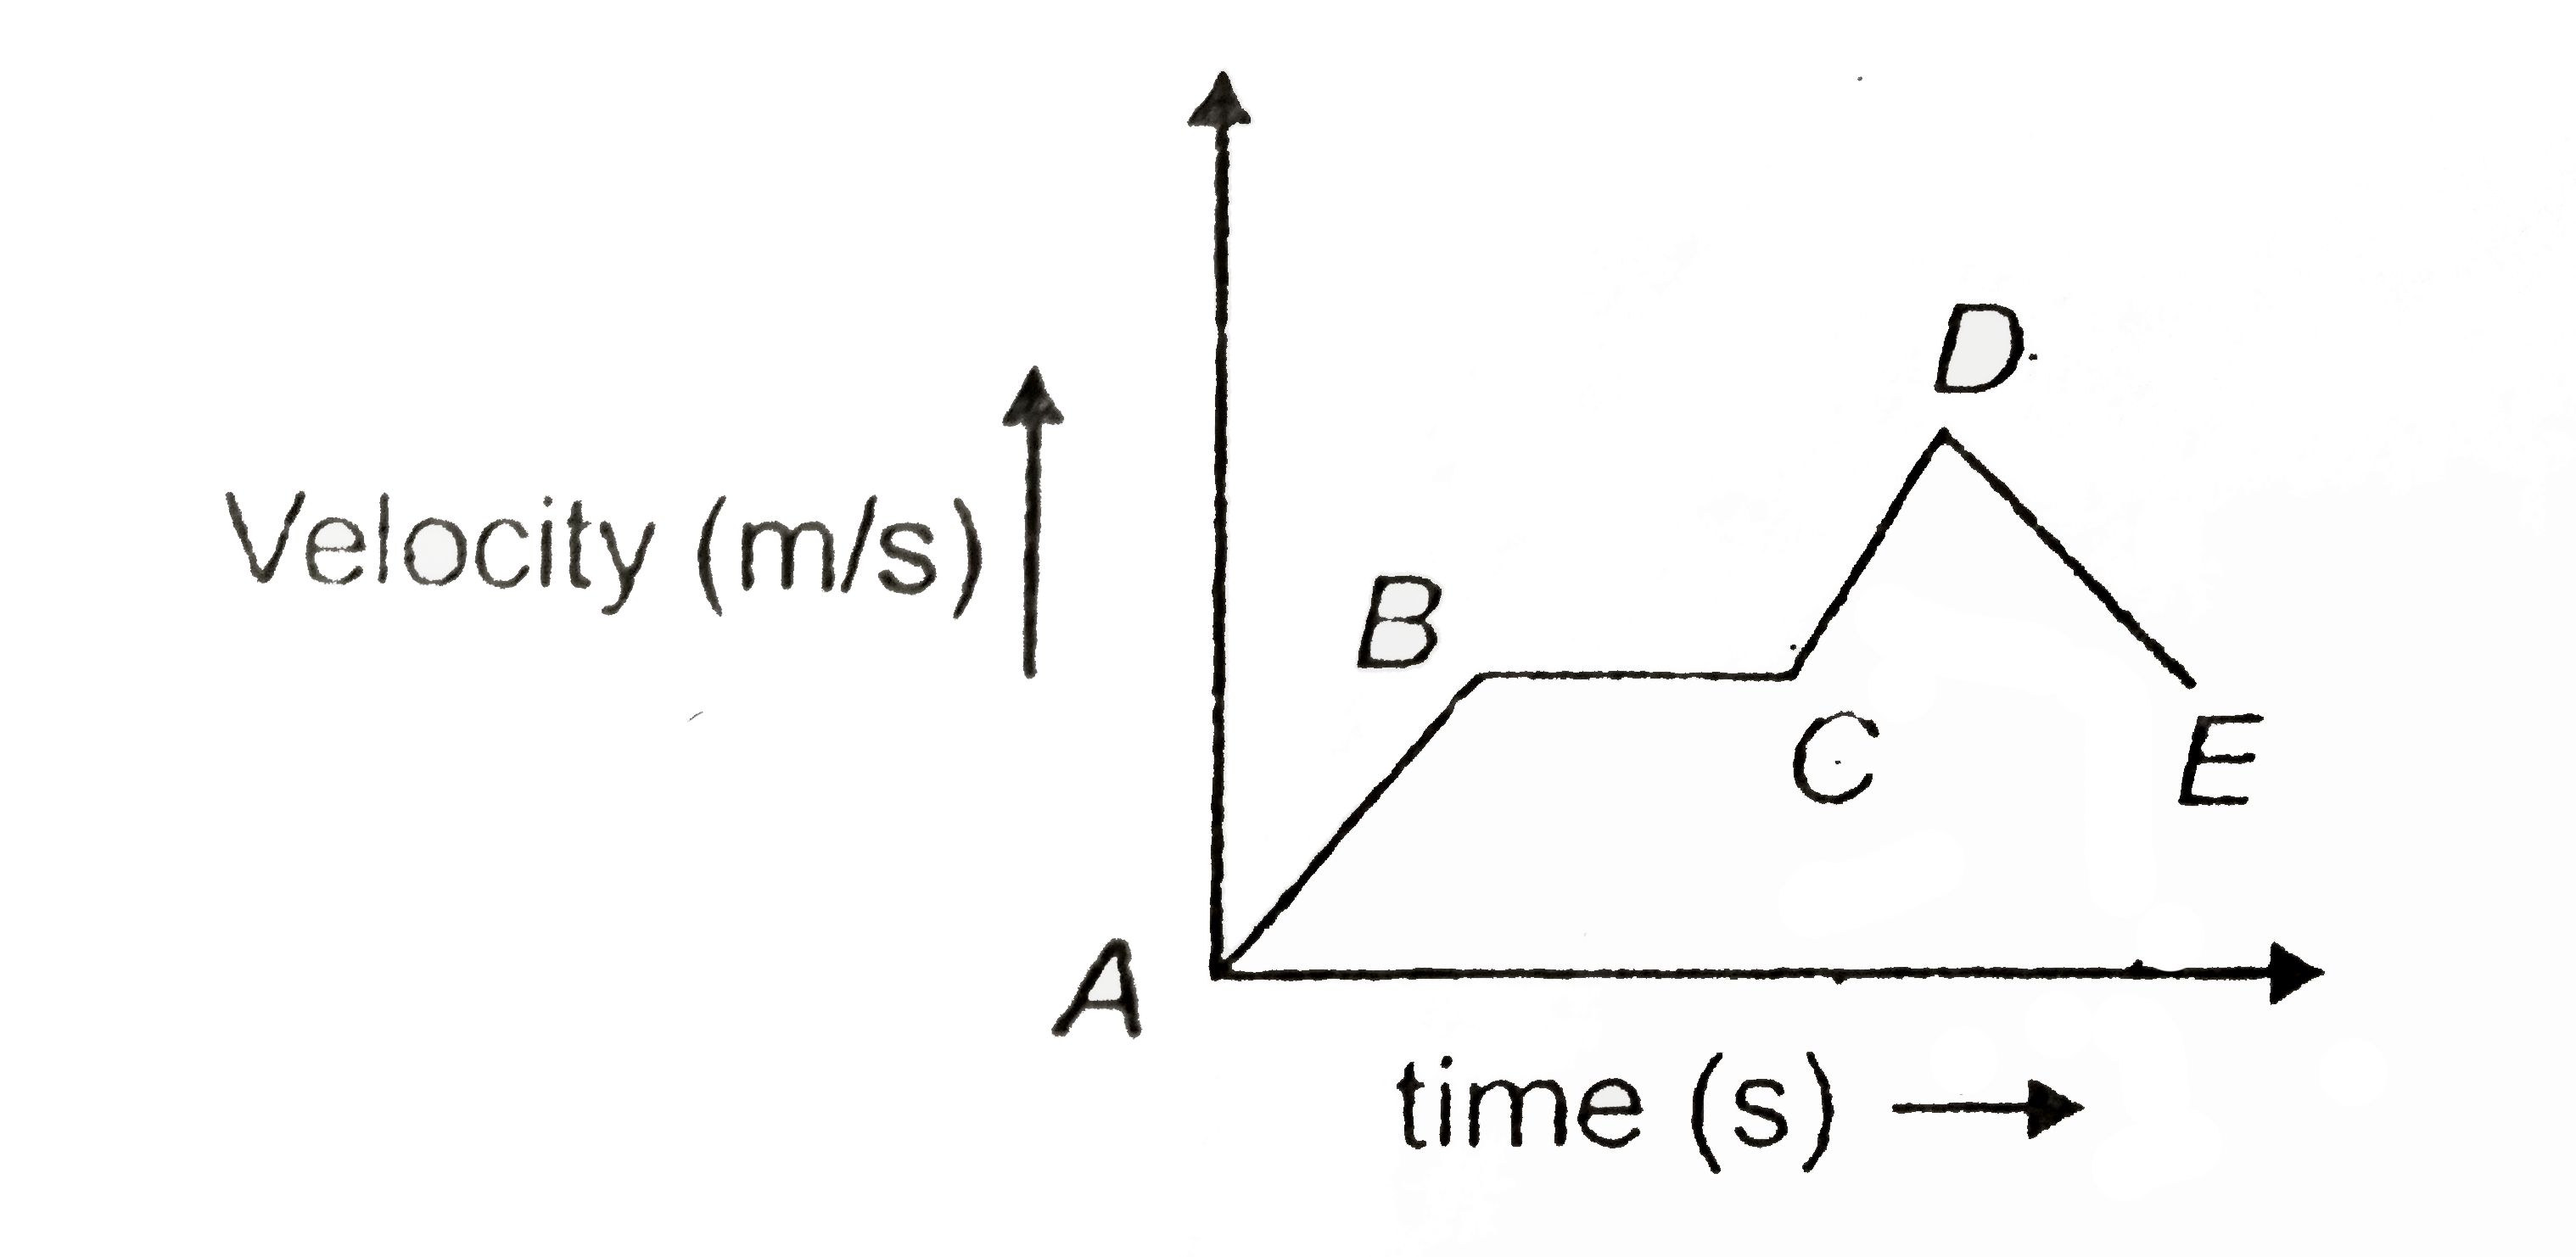
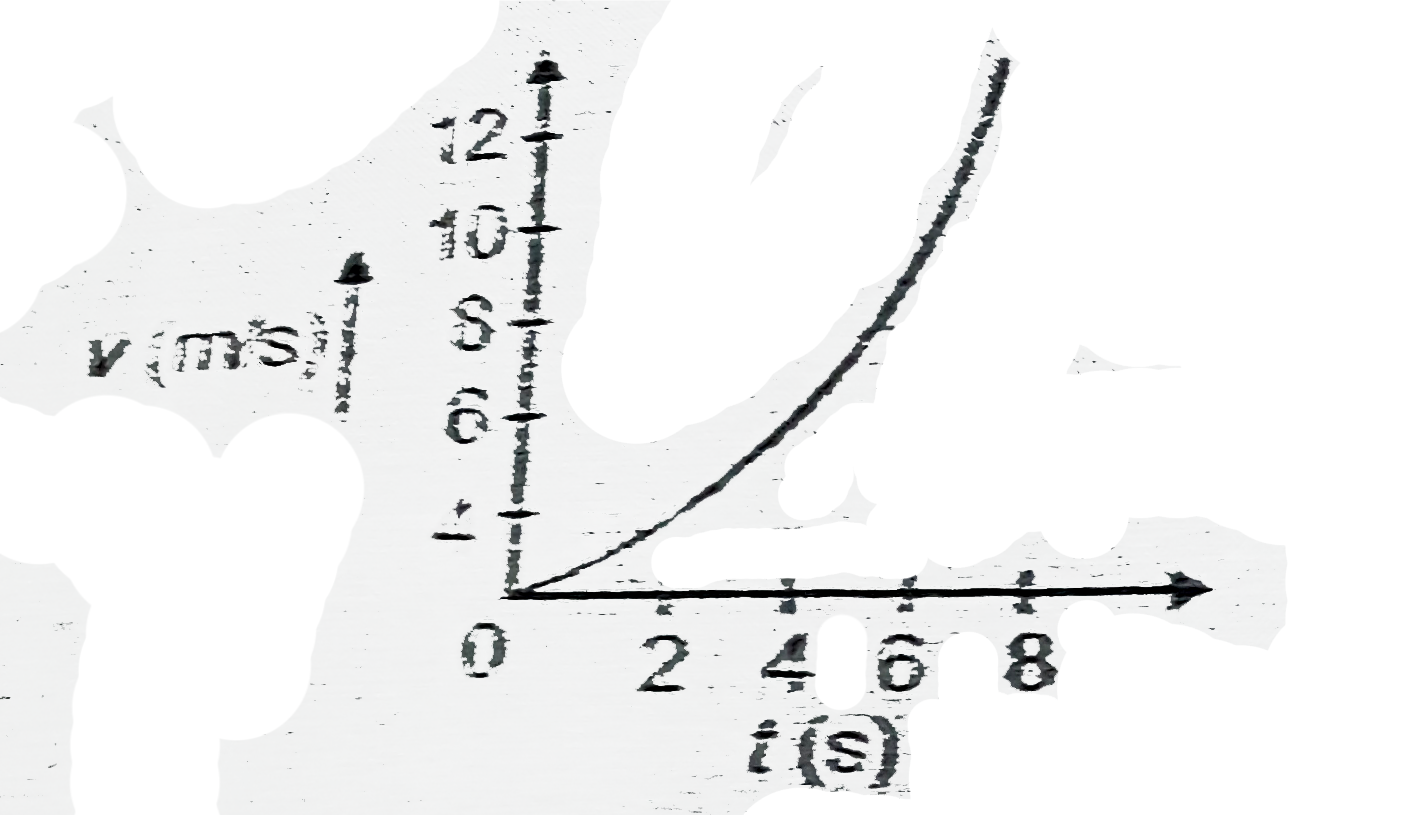
The velocity-time graph of an object is shown below. The acceleration of the object is
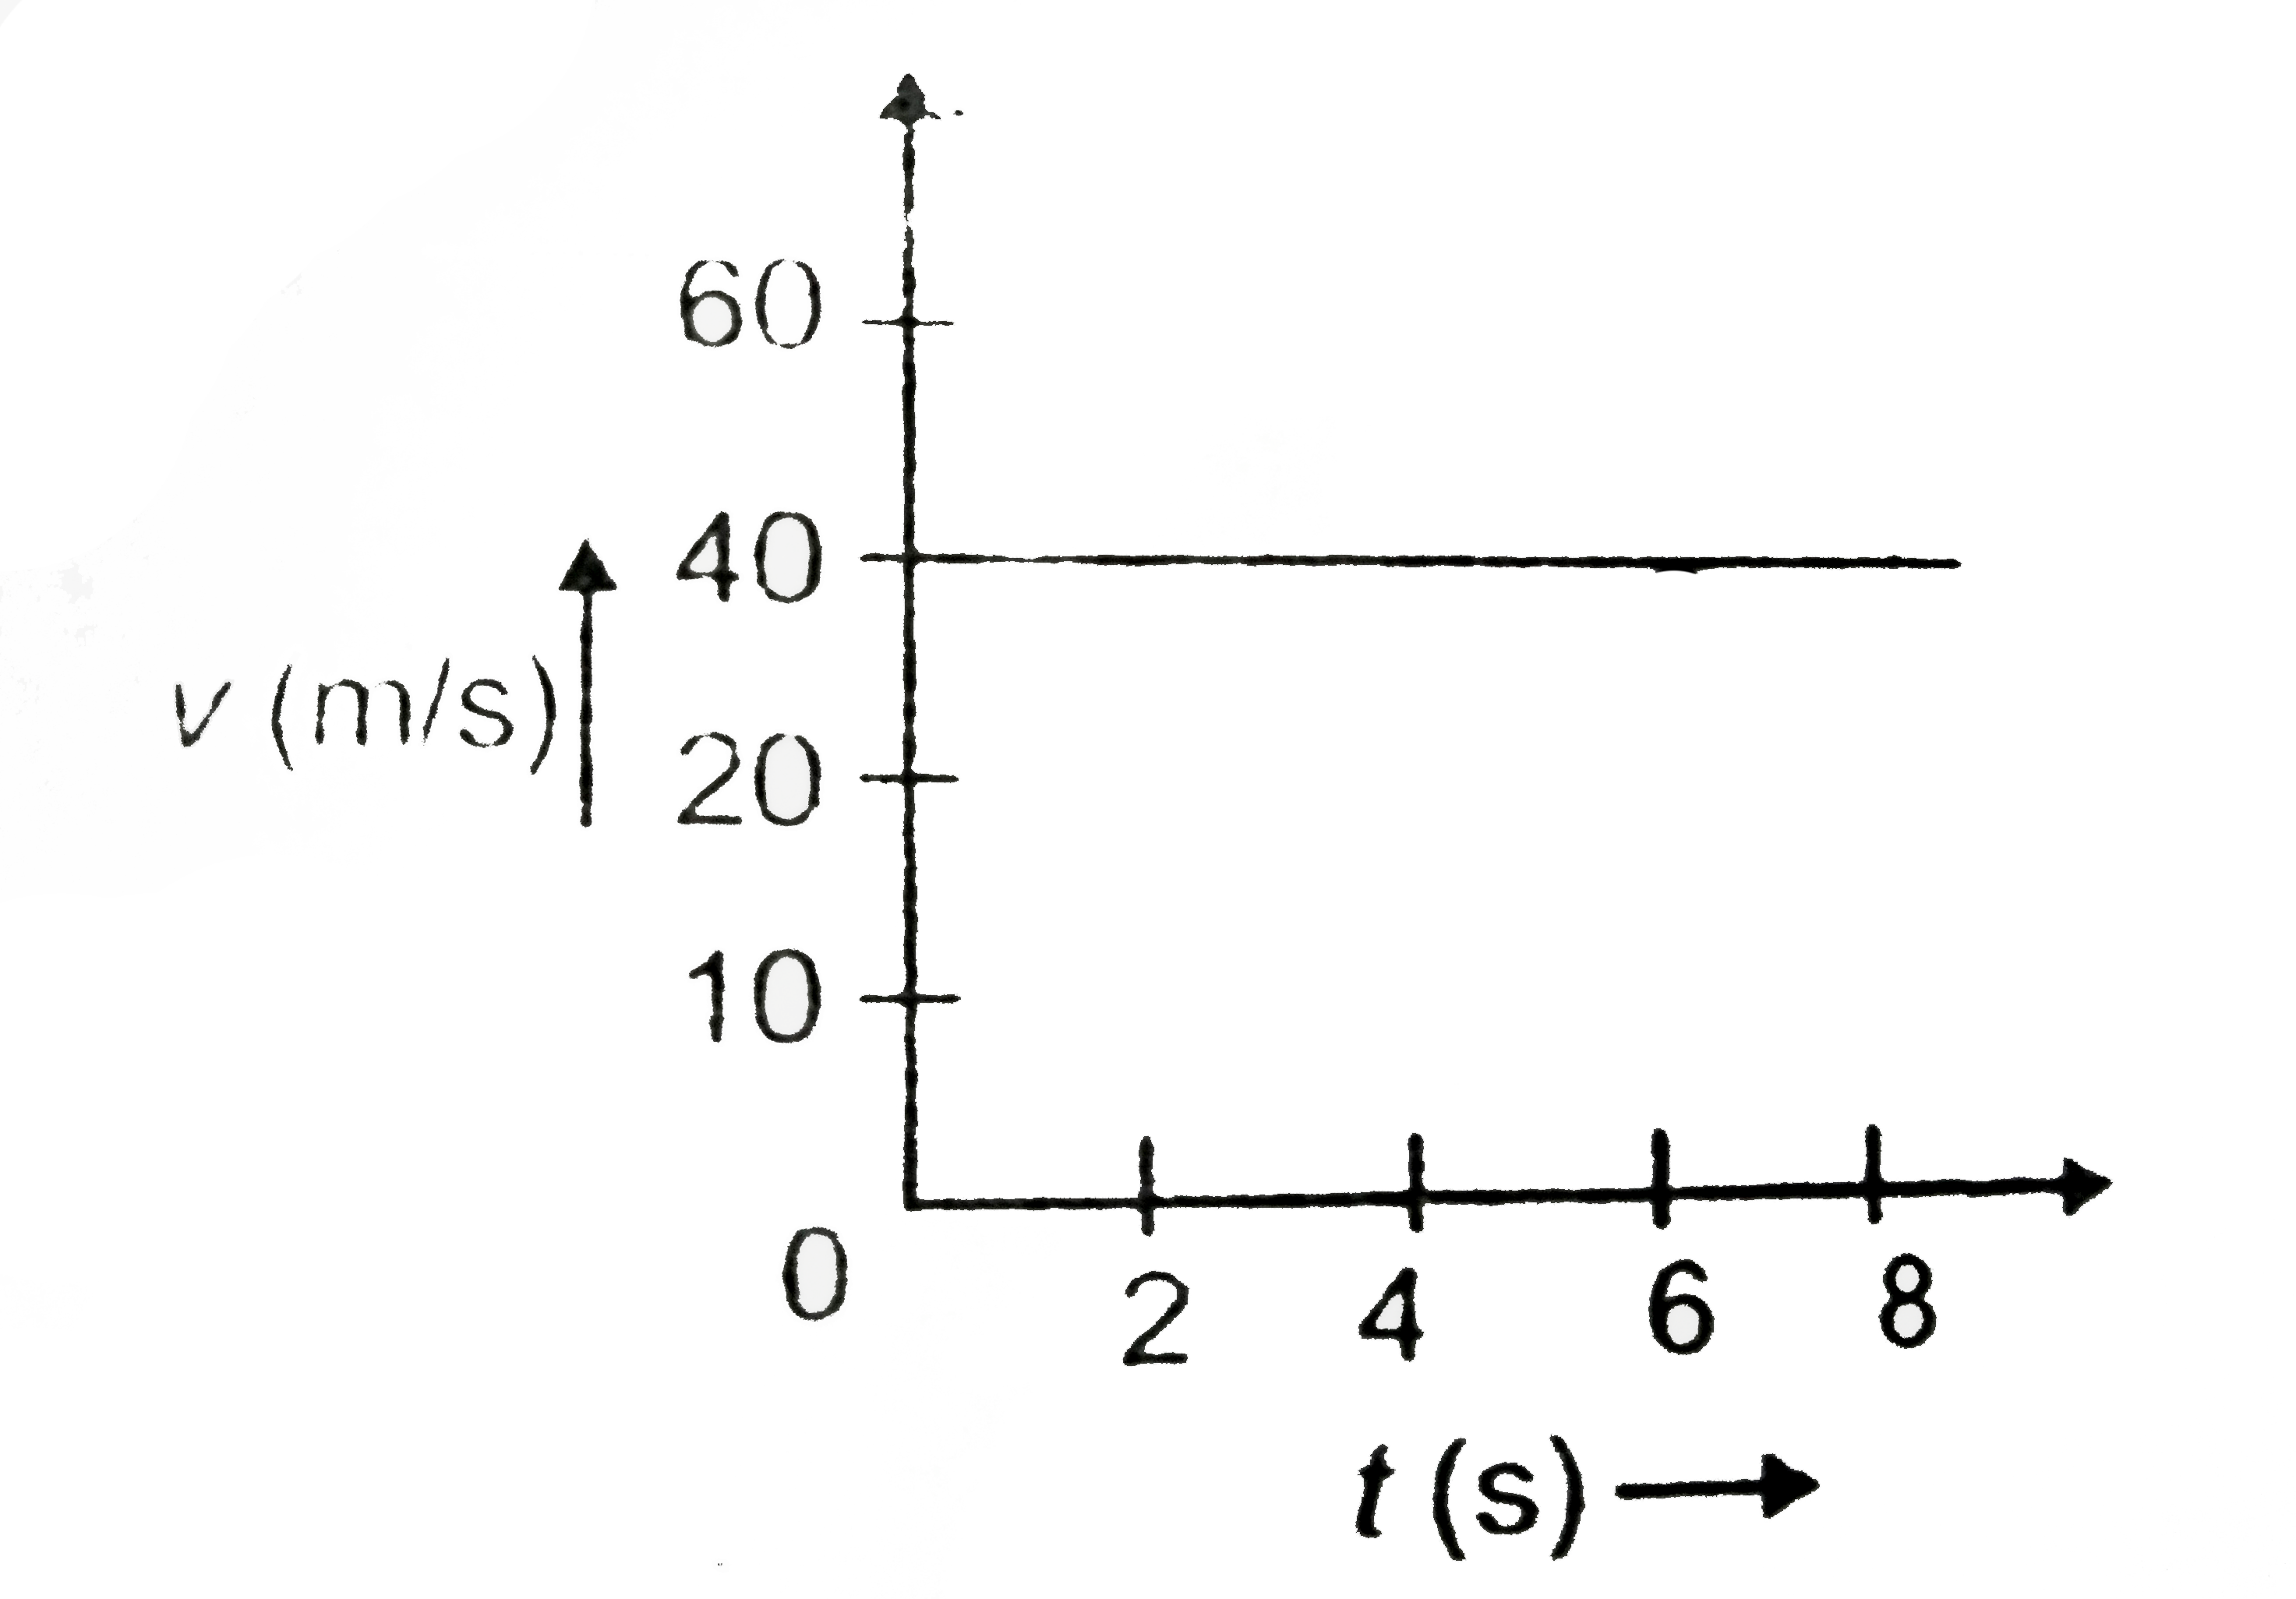
40m/s2
20m/s2
Zero
8m/s2
The correct Answer is:C
Step by step video & image solution for The velocity-time graph of an object is shown below. The acceleration of the object is by Physics experts to help you in doubts & scoring excellent marks in Class 12 exams.
Updated on:21/07/2023Topper's Solved these Questions
- MOTION IN STRAIGHT LINEBOOK - AAKASH INSTITUTECHAPTER - MOTION IN STRAIGHT LINEEXERCISE - Assignment (SECTION - B)
19 Videos
- MOTION IN STRAIGHT LINEBOOK - AAKASH INSTITUTECHAPTER - MOTION IN STRAIGHT LINEEXERCISE - Assignment (SECTION - C)
7 Videos
- MOTION IN STRAIGHT LINEBOOK - AAKASH INSTITUTECHAPTER - MOTION IN STRAIGHT LINEEXERCISE - Try Yourself
40 Videos
- MOTION IN A STRAIGHT LINEBOOK - AAKASH INSTITUTECHAPTER - MOTION IN A STRAIGHT LINEEXERCISE - ASSIGNMENT (SECTION - D)
15 Videos
- MOVING CHARGE AND MAGNESIUMBOOK - AAKASH INSTITUTECHAPTER - MOVING CHARGE AND MAGNESIUMEXERCISE - SECTION D
16 Videos
Similar Questions
Knowledge Check
The velocity-time graph of an objects is as shown. The displacement during the interval 0 to t4 is
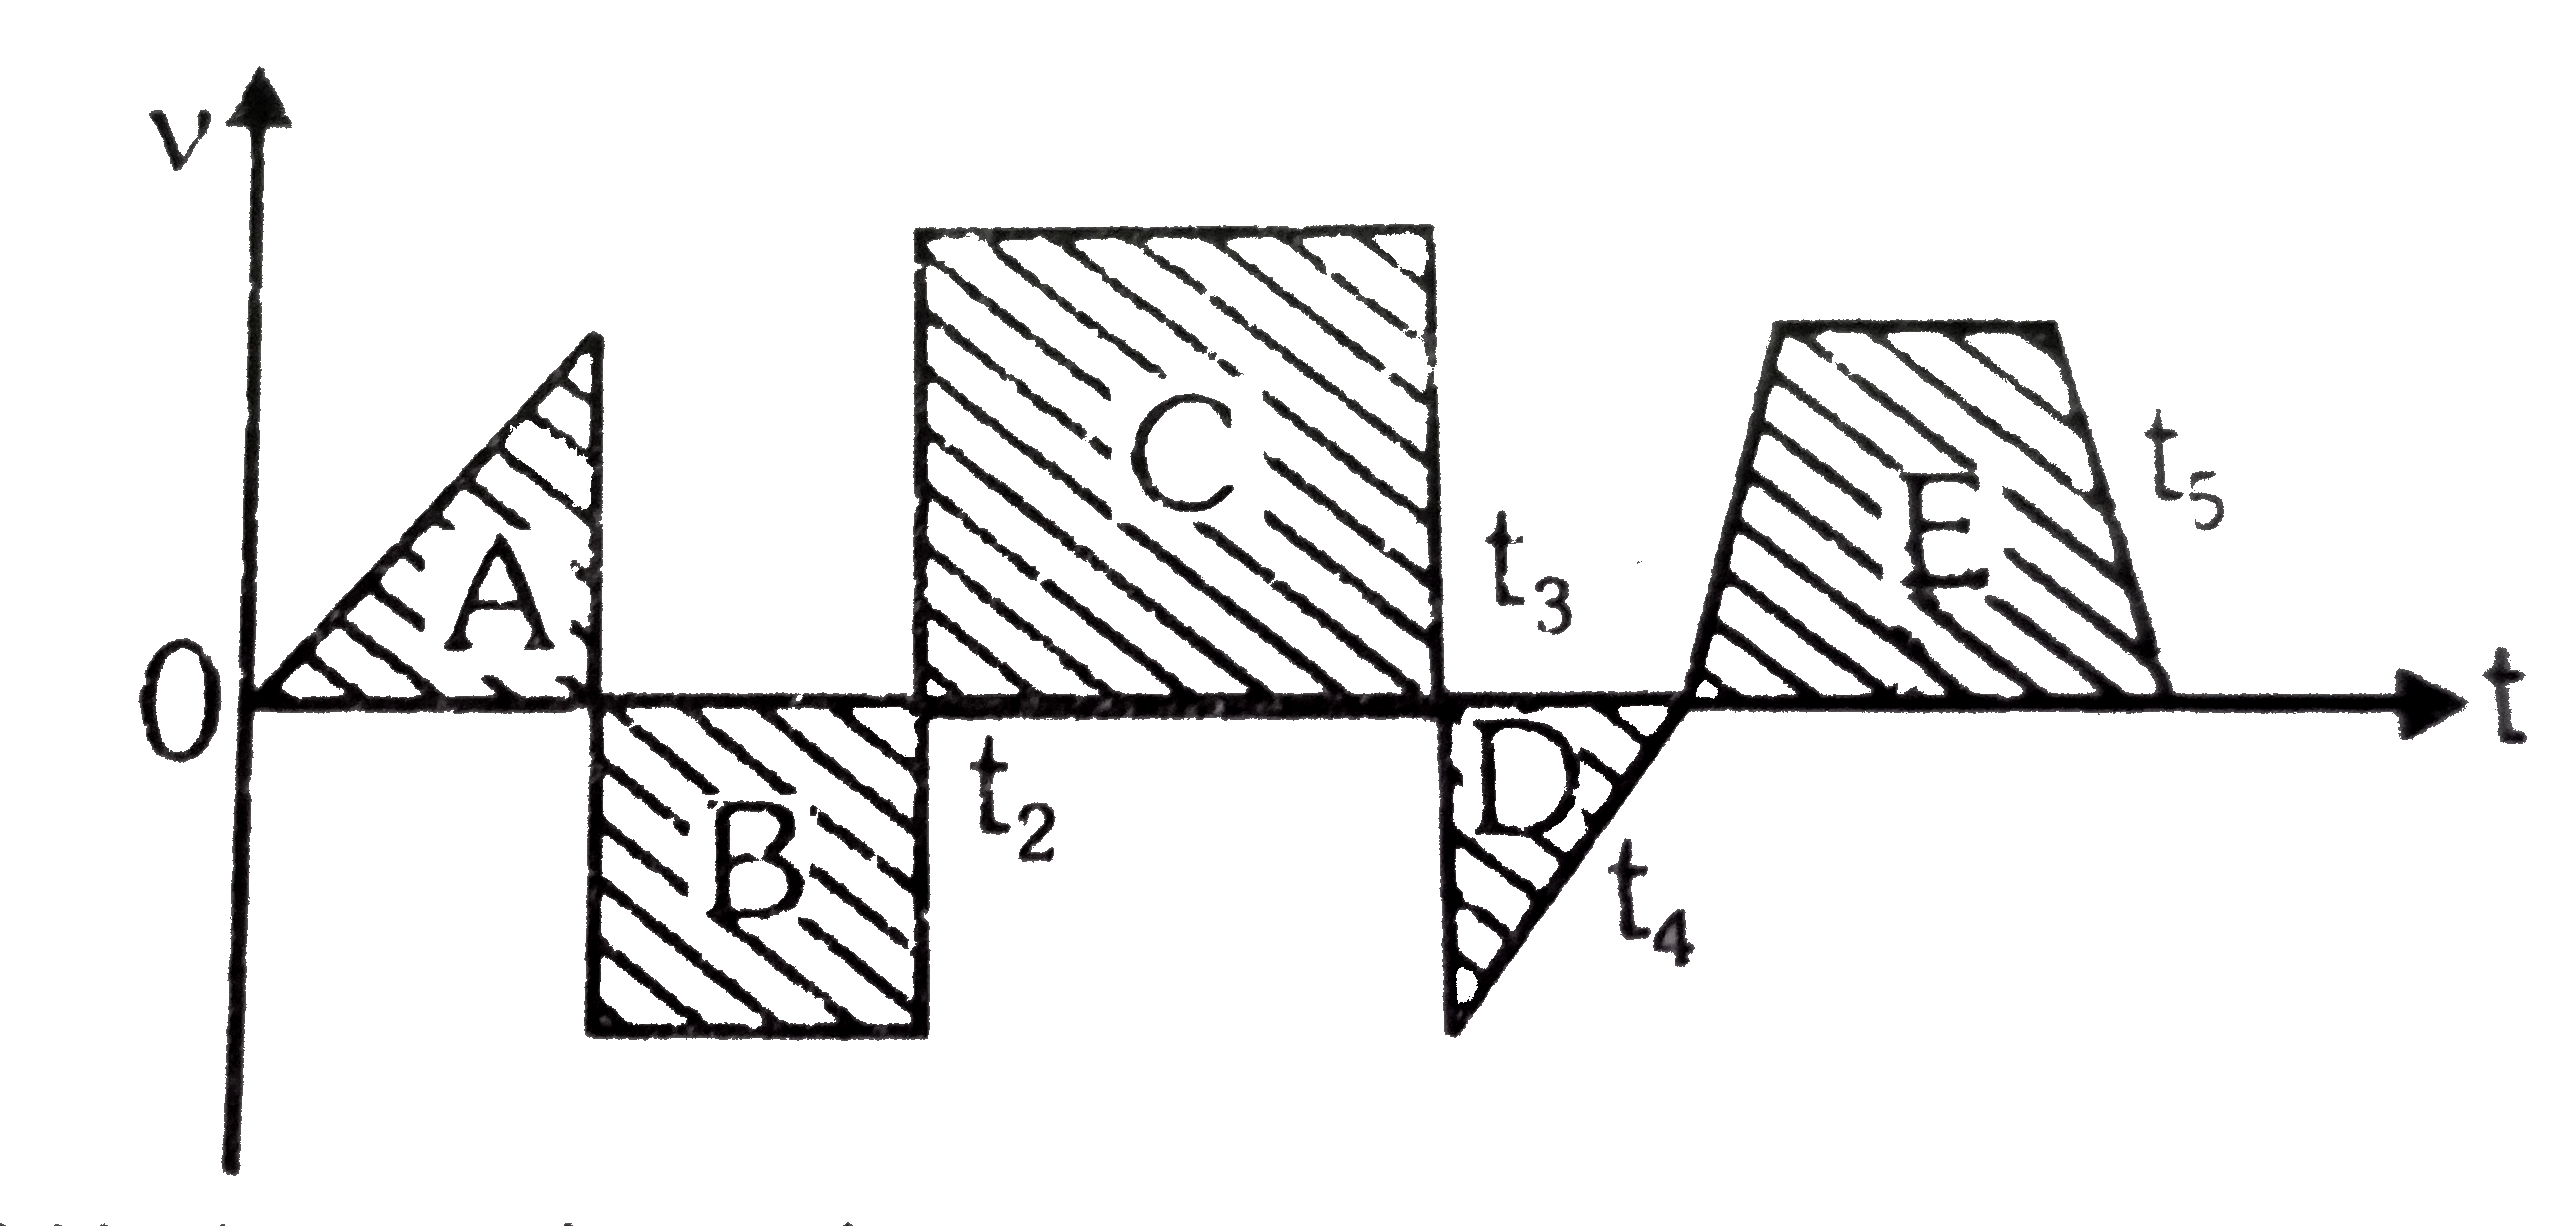 AArea A+AreaB+AreaC+AreaD+AreaEBAreaA+AreaC-AreaB-AreaDCArea+AreaB+AreaC+AreaDDAreaA+AreaC+AreaE-AreaB+AreaD
Distance versus time graph of an object is as shown in the figure. The average speed of the object is _____ ms−1
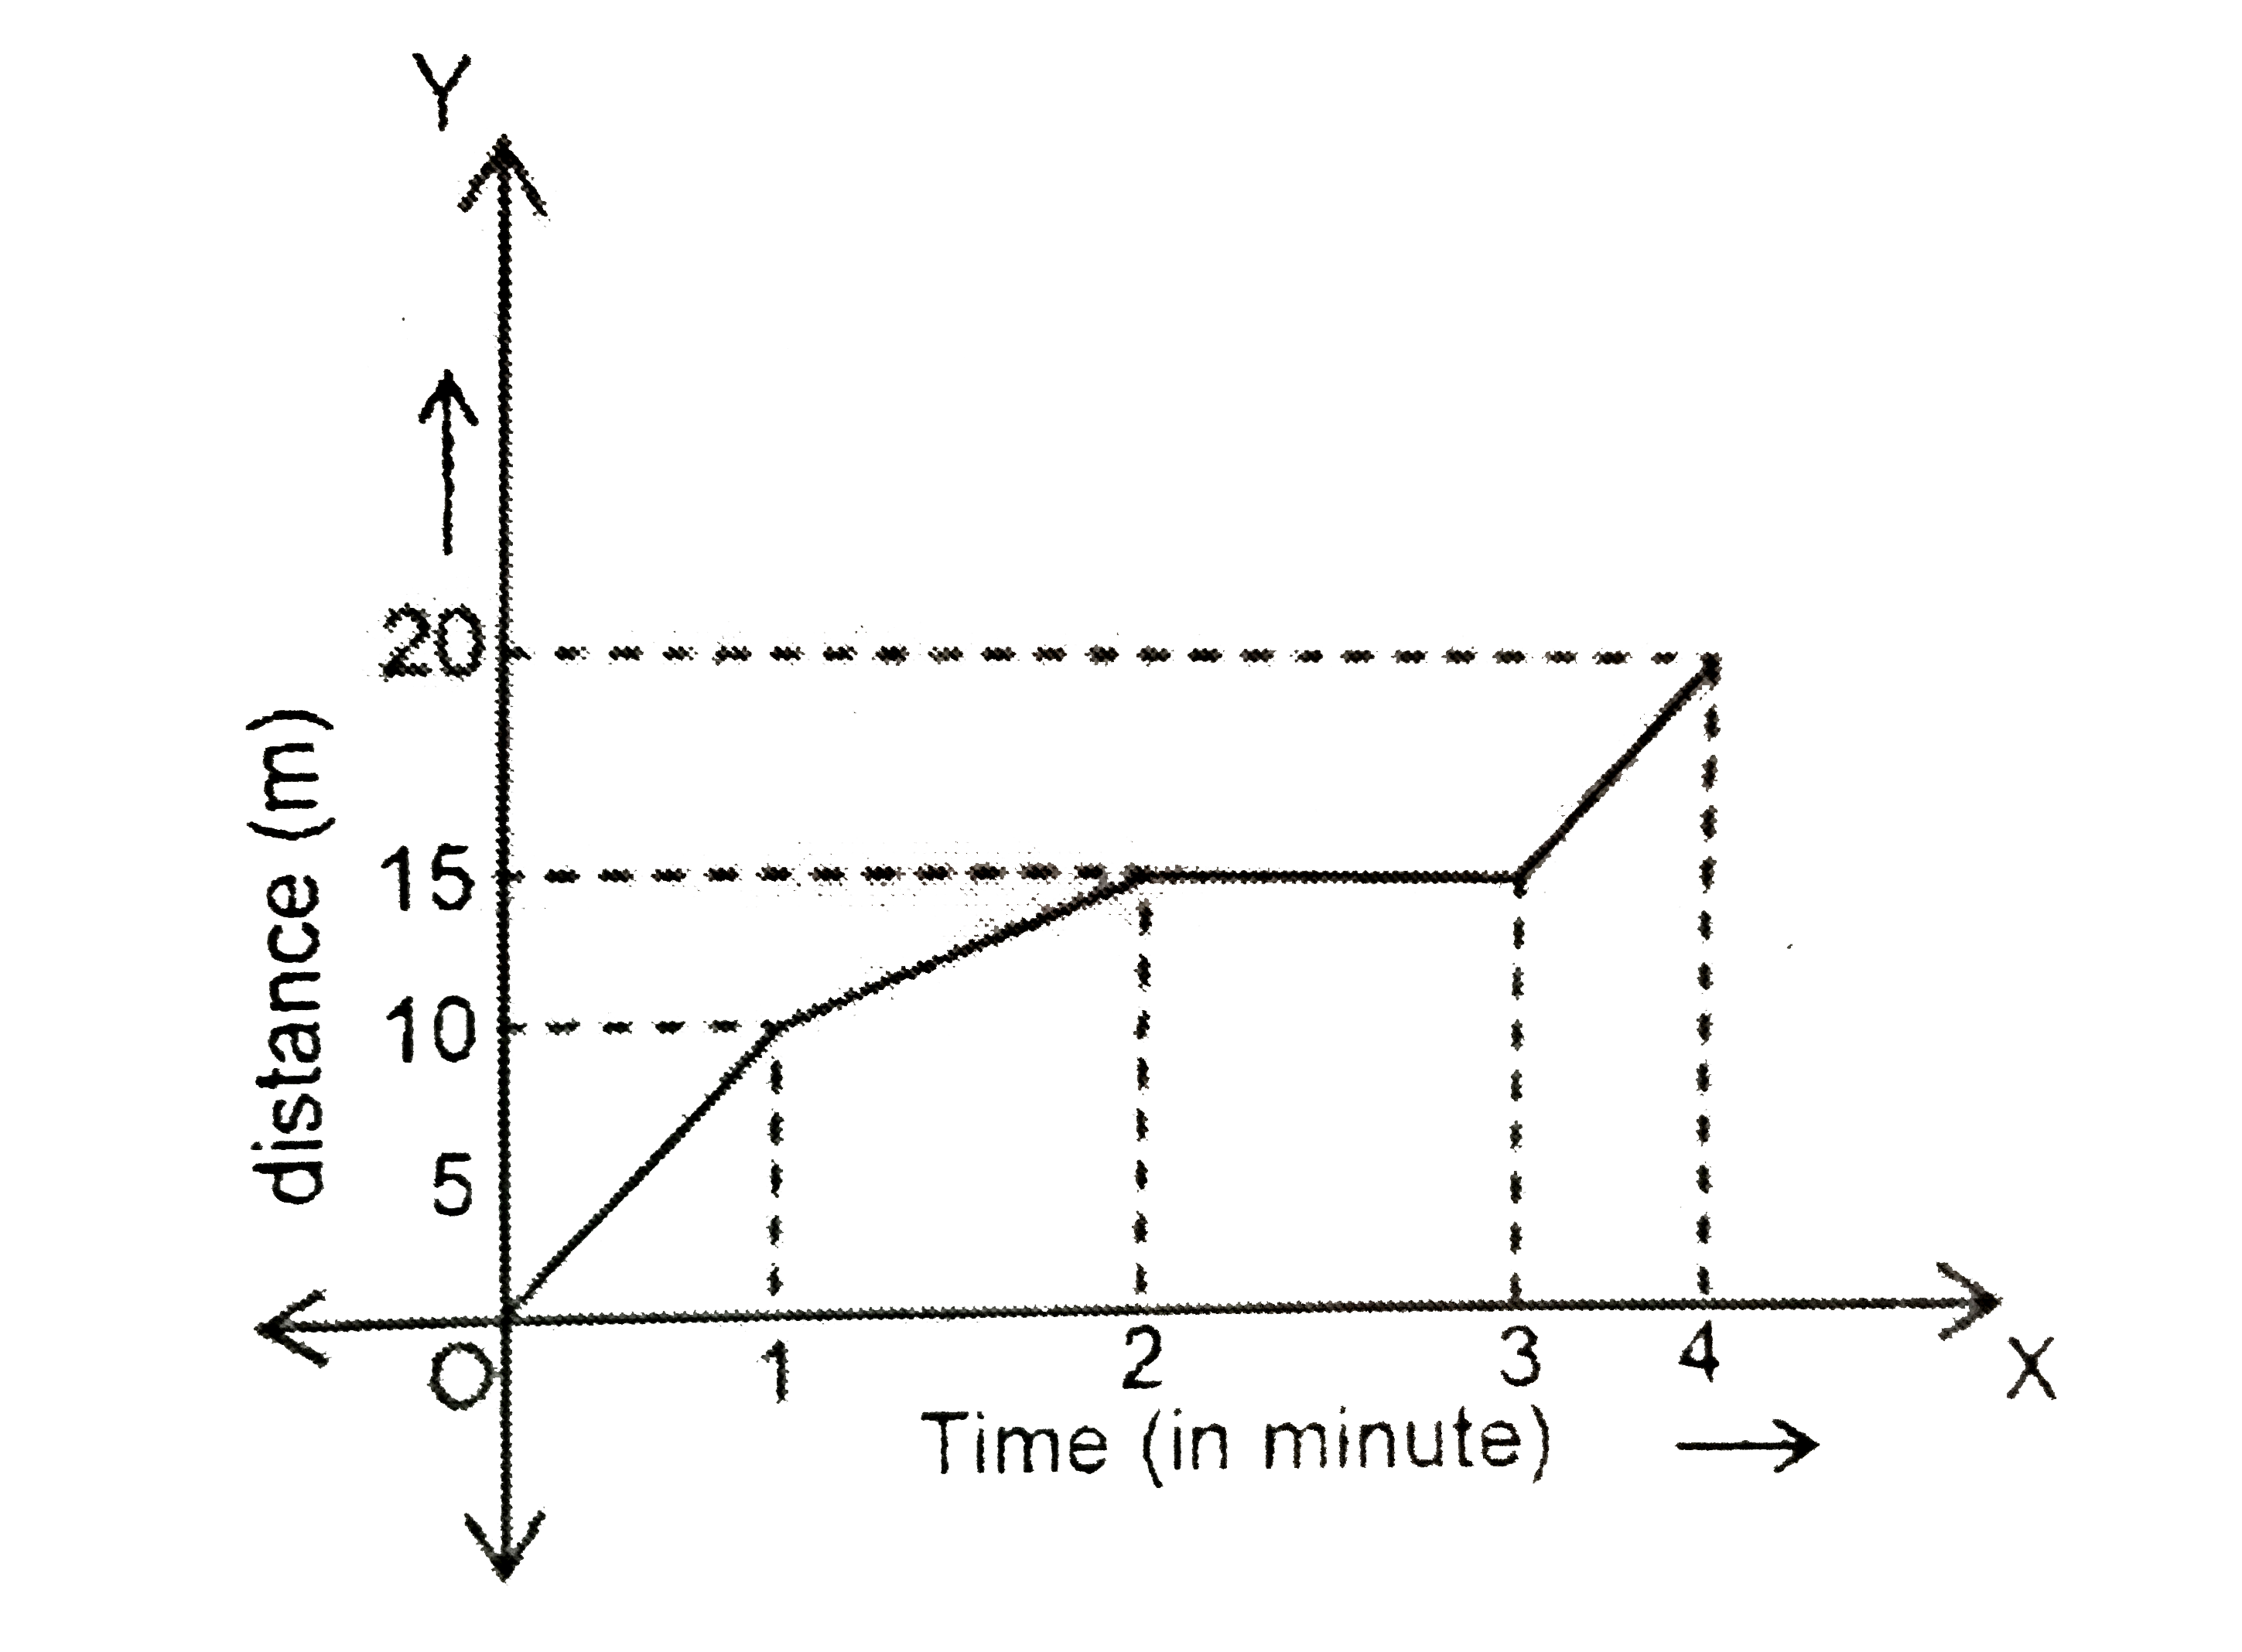 A0.08B0.5C1D2
Distance versus time graph of an object is as shown in the figure. The average speed of the object is _____ ms−1
 A0.08B0.5C1D2
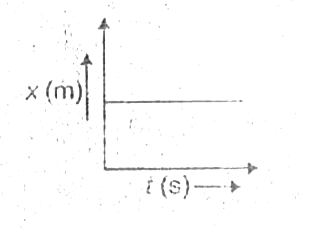
The position-time graph of an object is given below. What is the velocity of the object?
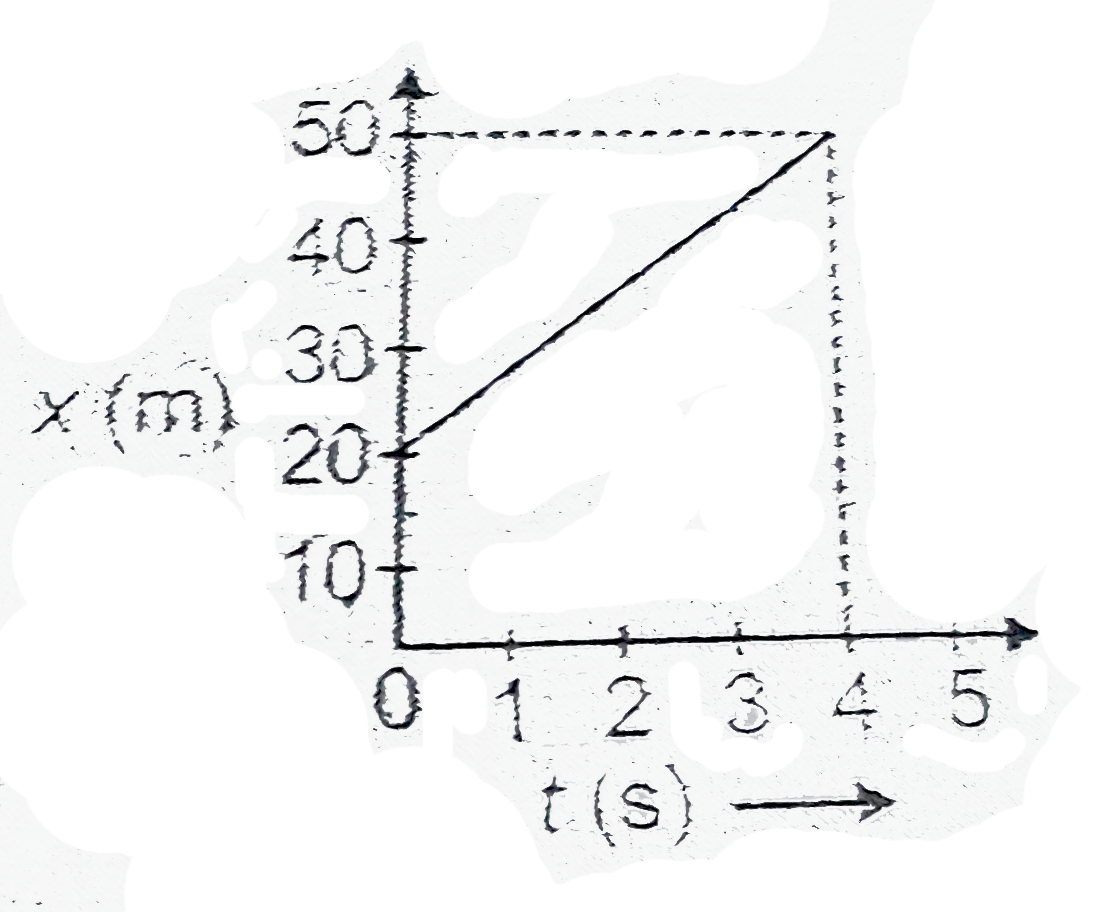
View SolutionThe position-time graph of an object is given below. What is the velocity of the object?
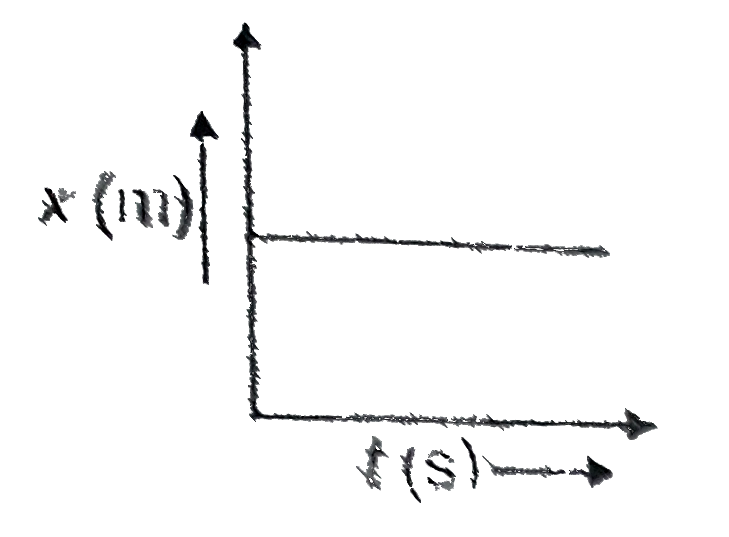
View SolutionThe position - time graph of an object is given below. What is the velocity of the object?
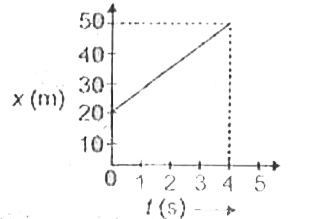
View SolutionThe position - time graph of an object is given below. What is the velocity of the object?
View SolutionGraphs are very useful to represent a physical situation. Various quantities can be easily represented on graphs and other quantites can be determined from the graph. For example the slope of velocity-time graph represents instantaneous acceleration. For a motion with constant acceleration slope of velocity-time graph is constant. If acceleration is changing with time, slope with change and thus velocity-time graph will be a non-linear curve. Further the area of velocity-time graph gives displacement.
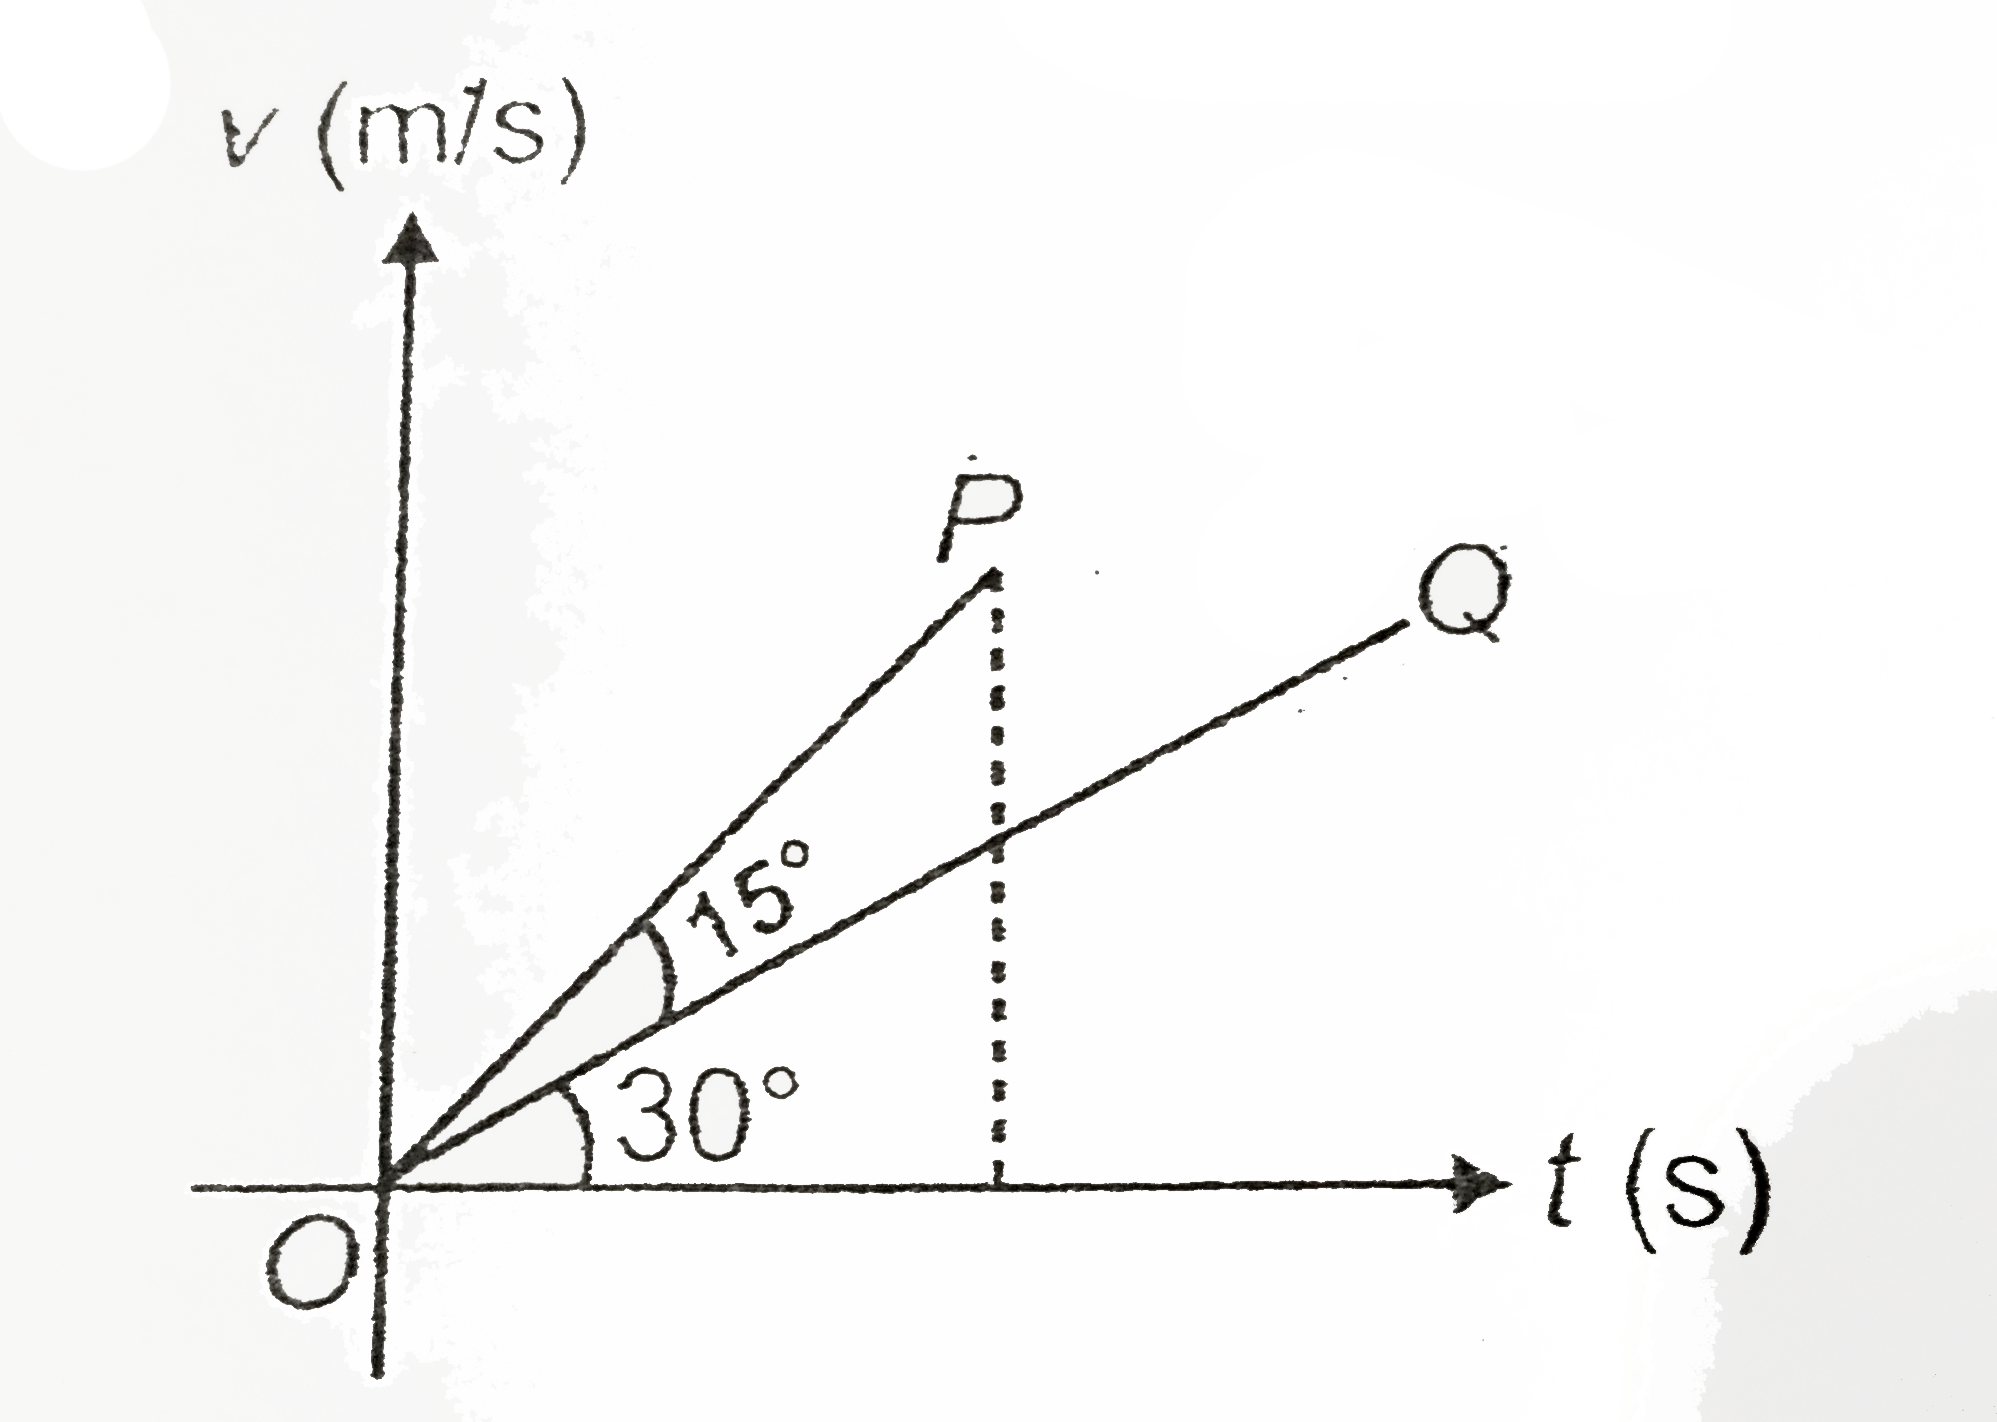
The velocity-time graph for two objects P and Q are shown. The ratio of their respective acceleration is
View Solution

