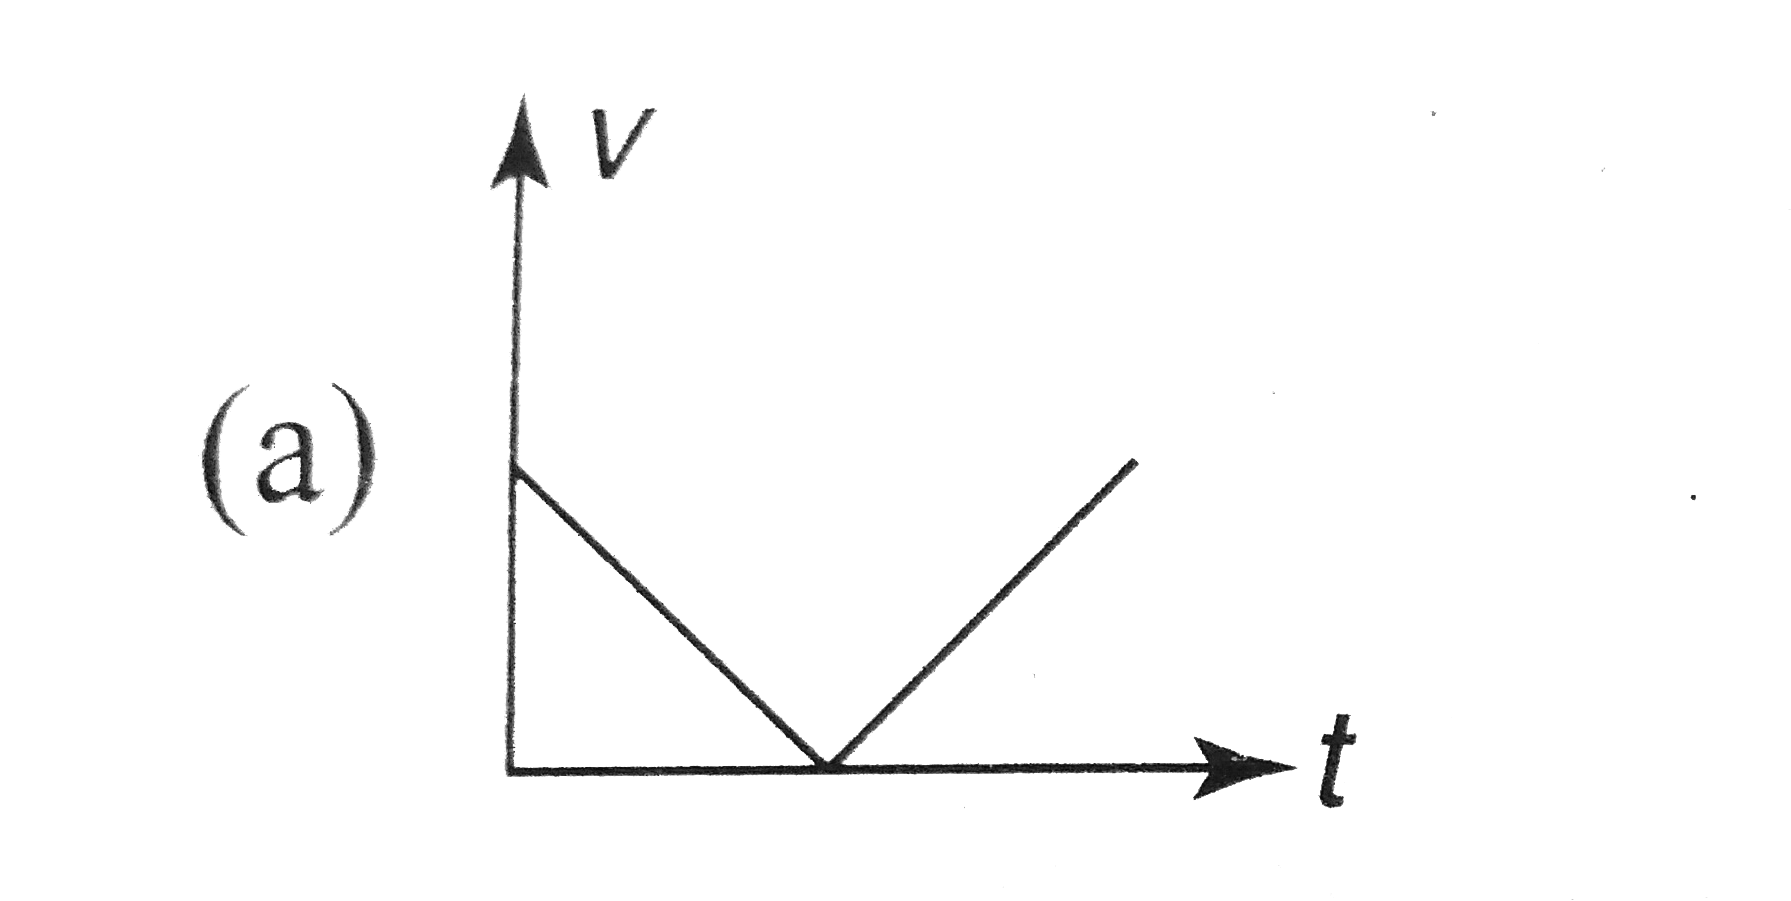
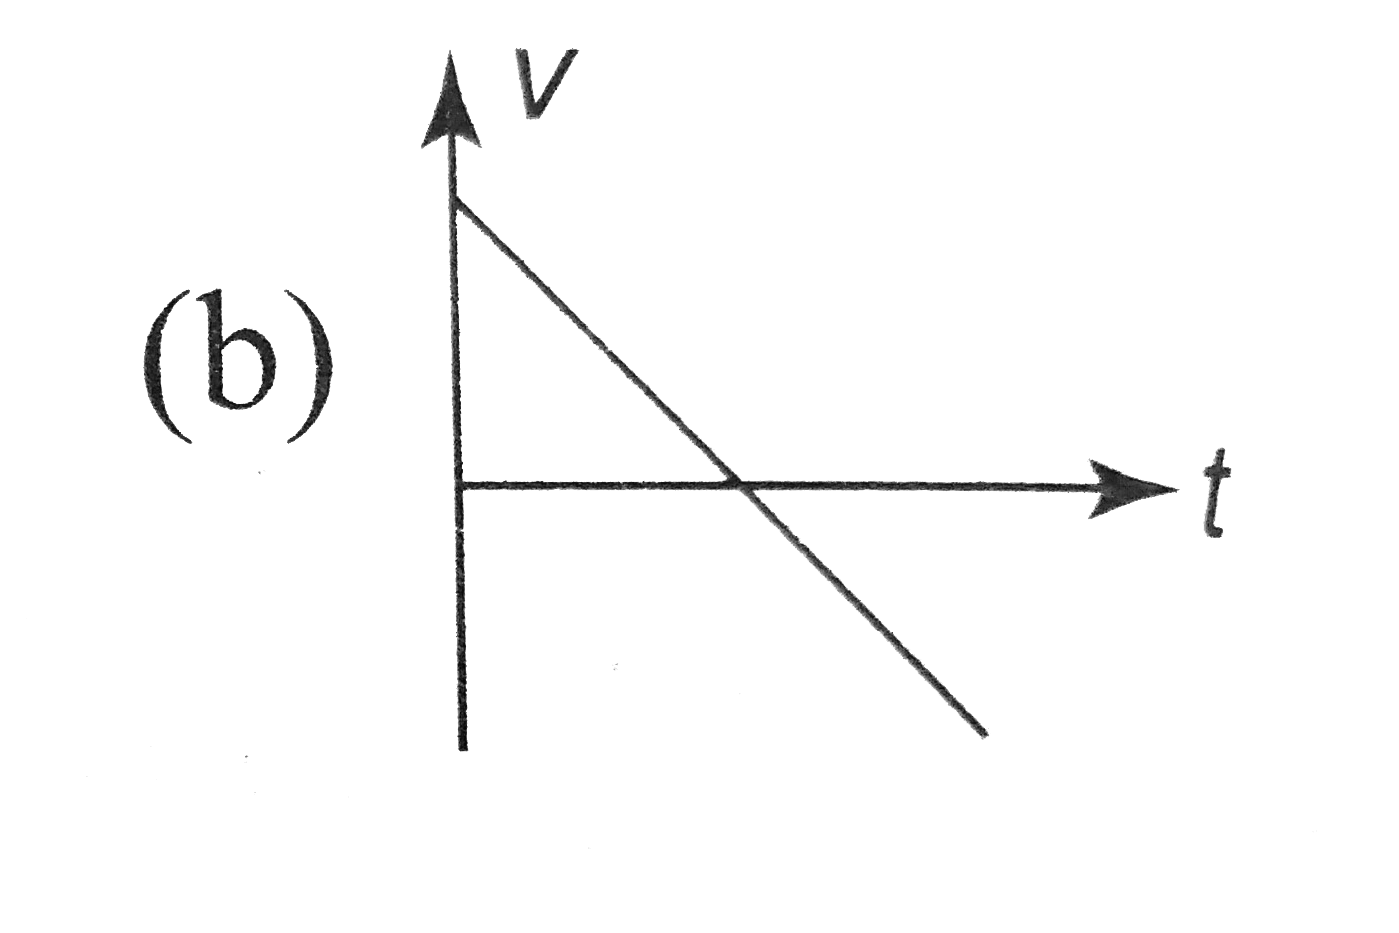
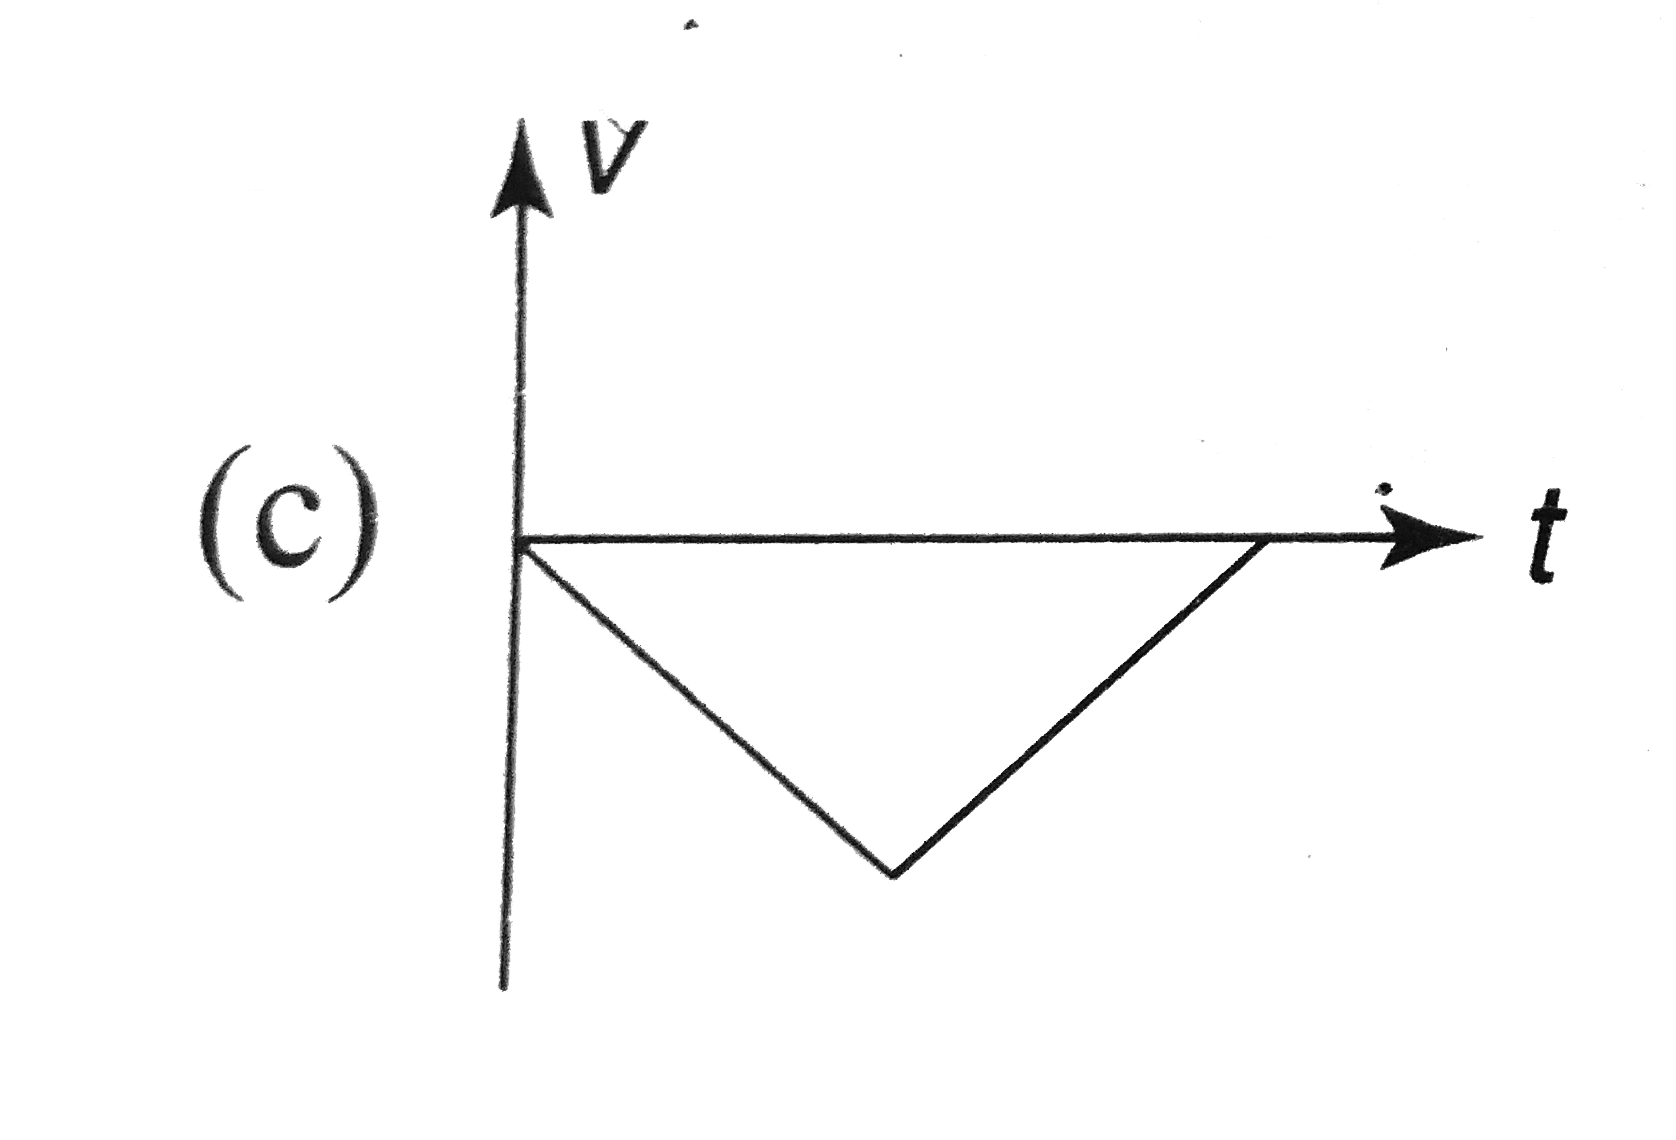
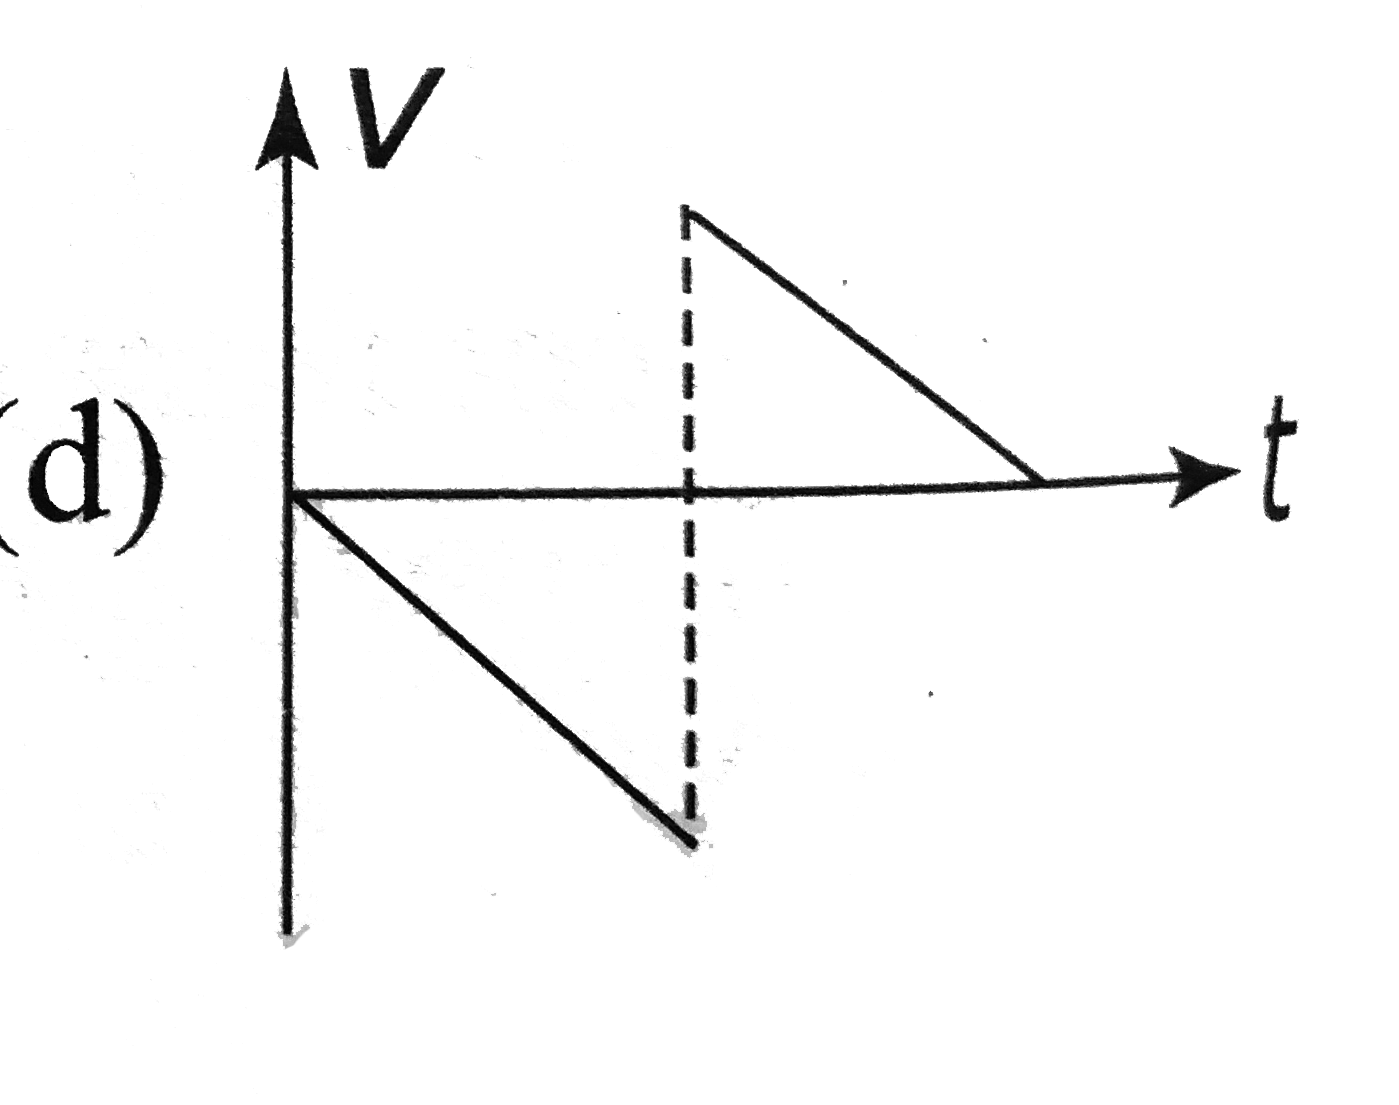
A ball is dropped from some height. After rebound from the floor it ascends to the same height. Draw the velocity-time graph for the given motion.
 .
.
 .
.
 .
.
The correct Answer is:D
To draw the velocity-time graph for a ball dropped from a height and rebounding to the same height, we can follow these steps:
1. Define the Motion:
- The ball is dropped from a height h with an initial velocity u=0.
- The motion consists of two parts: falling down to the ground and then rebounding back up to the same height.
2. Analyze the Falling Motion:
- As the ball falls, it accelerates due to gravity. The acceleration a=g (approximately 9.81m/s2).
- The velocity of the ball just before it hits the ground can be calculated using the equation:
v=u+at=0+(−gt)=−gt
- Here, the negative sign indicates the downward direction.
3. Graph the Falling Motion:
- At t=0, the velocity v=0.
- As time increases, the velocity becomes more negative, indicating that the ball is falling faster.
- The graph will be a straight line with a negative slope, starting from the origin (0,0) and moving downwards.
4. Analyze the Rebound Motion:
- Upon hitting the ground, the ball rebounds with the same speed it had just before hitting the ground, but in the opposite direction (upward).
- Thus, the velocity at the moment of rebound is v=−vimpact (which is positive in the upward direction).
5. Graph the Rebound Motion:
- After reaching the ground, the velocity will start from the negative value (just before impact) and increase towards zero as it rises.
- The graph will then continue to rise above the time axis, reaching a maximum height where the velocity becomes zero again.
6. Final Graph:
- The complete velocity-time graph will consist of:
- A straight line segment sloping downwards from the origin to a negative velocity value (falling).
- A straight line segment sloping upwards from that negative velocity value back to zero (rebounding).
Velocity-Time Graph:
- The graph starts at (0,0), slopes downwards to a negative value at the time of impact, and then slopes upwards back to (t, 0) at the maximum height after rebound.
- The ball is dropped from a height h with an initial velocity u=0.
- The motion consists of two parts: falling down to the ground and then rebounding back up to the same height.
- As the ball falls, it accelerates due to gravity. The acceleration a=g (approximately 9.81m/s2).
- The velocity of the ball just before it hits the ground can be calculated using the equation:
v=u+at=0+(−gt)=−gt
- Here, the negative sign indicates the downward direction.
- At t=0, the velocity v=0.
- As time increases, the velocity becomes more negative, indicating that the ball is falling faster.
- The graph will be a straight line with a negative slope, starting from the origin (0,0) and moving downwards.
- Upon hitting the ground, the ball rebounds with the same speed it had just before hitting the ground, but in the opposite direction (upward).
- Thus, the velocity at the moment of rebound is v=−vimpact (which is positive in the upward direction).
- After reaching the ground, the velocity will start from the negative value (just before impact) and increase towards zero as it rises.
- The graph will then continue to rise above the time axis, reaching a maximum height where the velocity becomes zero again.
- The complete velocity-time graph will consist of:
- A straight line segment sloping downwards from the origin to a negative velocity value (falling).
- A straight line segment sloping upwards from that negative velocity value back to zero (rebounding).
- The graph starts at (0,0), slopes downwards to a negative value at the time of impact, and then slopes upwards back to (t, 0) at the maximum height after rebound.
Topper's Solved these Questions
- GENERAL KINEMATICS AND MOTION IN ONE DIMENSIONBOOK - A2ZCHAPTER - GENERAL KINEMATICS AND MOTION IN ONE DIMENSIONEXERCISE - AIIMS Questions
20 Videos
- FLUID MECHANICSBOOK - A2ZCHAPTER - FLUID MECHANICSEXERCISE - Chapter Test
29 Videos
- GRAVITATIONBOOK - A2ZCHAPTER - GRAVITATIONEXERCISE - Chapter Test
29 Videos
Similar Questions
a. A ball is thrown vertically upwards. Aftre some time it trturns to the throuer. Draw the velocity-time graph and speed-time graph.
b. A ball is dropped from some height. After rebounding from the floor, it ascends to the same height. Draw the velocity-time graph and speed-time graph.
View SolutionA body is dropped vertically from a certain height. Draw velocity time graph of the body.
View Solution
Knowledge Check
A body falling from a height of 10m rebounds from the hard floor . It
A0.89B0.56C0.23D0.18A ball is dropped from certain height on a glass floor so that it rebounds elastically to the same height. If the process continues, the velocity -time graph for such a motion would be -
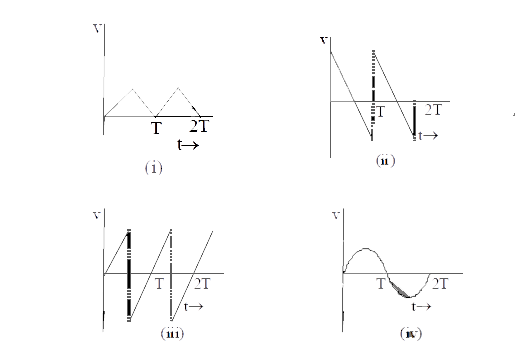 AIBiiCiiiDiv
A body is dropped from a height equal to radius of the earth. The velocity acquired by it before touching the ground is
Adirectly proportional to the time of fall.Bdirectly proportional to the square of the time o fall.Cdirectly proportional to mass of the body.DBoth (a) and (c)
A ball is dropped from a heigth H. It rebounds from the ground a number of times. If coefficient is e, to what height does it go after nth rebounding ?
View SolutionA plastice ball is dropped from a height of 1m and rebounds several times from the floor. IF1.3 s elaspes from from the moment it is dropped to the second impact with the floor, what is the coefficient of restitution?
View SolutionA plastic ball is dropped from a height of one meter and rebounds several times from the floor. If 1.3 seconds elapse from the moment it is dropped to the second impact with the floor, what is the coefficient of restitution.
View SolutionA ball is dropped from a height of 80 m on a floor. At each collision, the ball loses half of its speed. Plot the speed-time graph and velocity-time graph of its motion till two collisions With the floor. [Take g=10m/s2]
View SolutionA Tennis ball is released from a height h and after freely falling on a wooden floor it rebounds and reaches height h2. The velocity versus height of the ball during its motion may be represented graphically by :
(graph are drawn schematically and on not to scale )
View Solution
