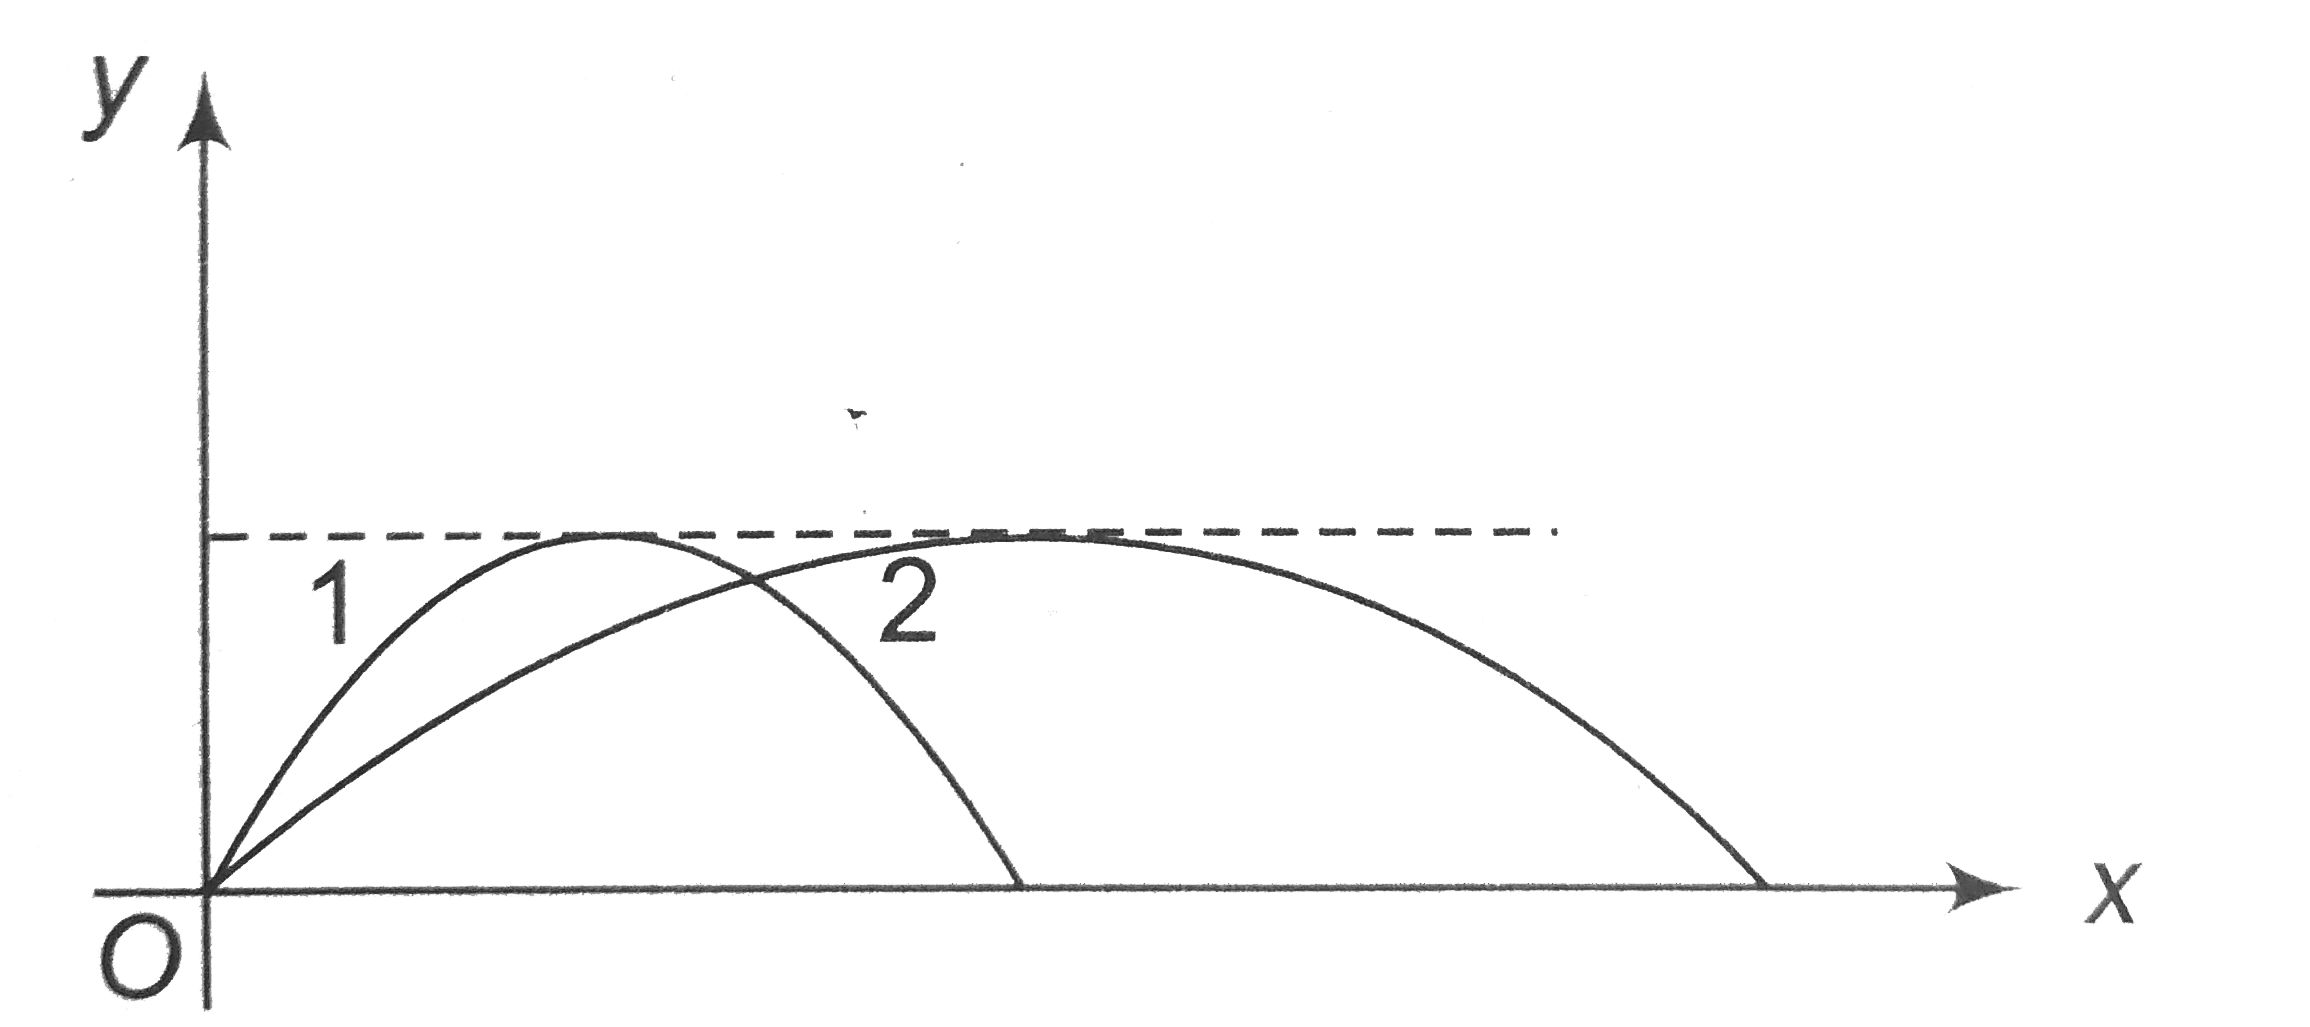
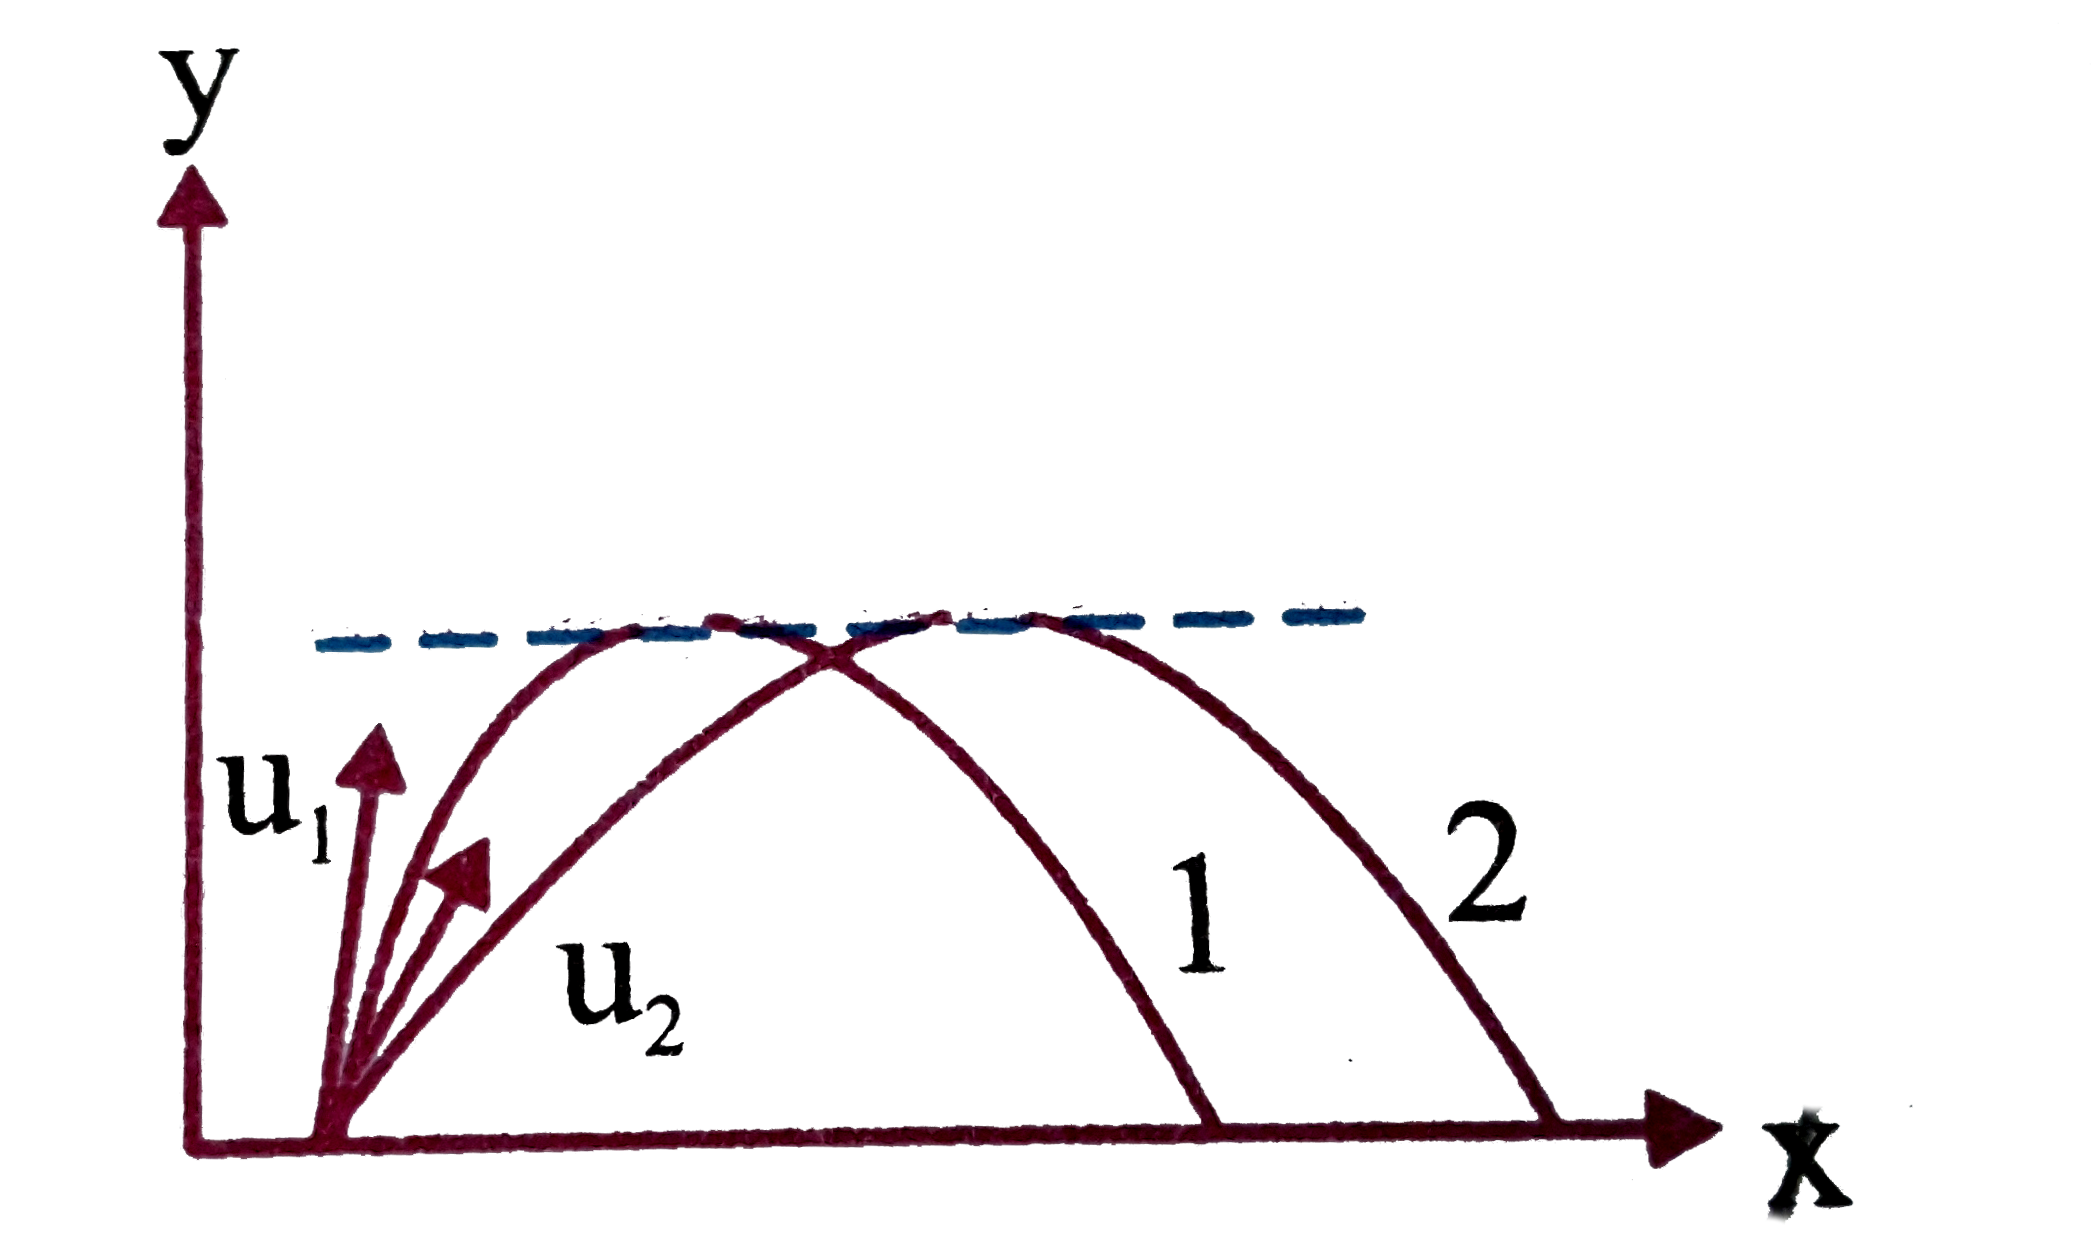
In the locus diagrams of two projectiles 1 and 2 as shown in the fig.
T1>T2 and v01<v02
T1=T2 and v01<v02
T1=T2 and v01>v02
T1<T2 and v01<v02
The correct Answer is:B
Both projectile have same height.
∴H1=H2
(u1sinθ1)22g=(u2sinθ2)22g
u1sinθ1=u2sinθ2
2u1sinθ1g=2u2sinθ2g⇒T1=T2
Now u1u2=sinθ2sinθ1sinθ1>θ2
sinθ1sinθ2>1⇒u1u2<1
Topper's Solved these Questions
- MOTION IN TWO DIMENSIONBOOK - A2ZCHAPTER - MOTION IN TWO DIMENSIONEXERCISE - Assertion Reasoning
11 Videos
- MOTION IN TWO DIMENSIONBOOK - A2ZCHAPTER - MOTION IN TWO DIMENSIONEXERCISE - NEET Questions
16 Videos
- MOTION IN TWO DIMENSIONBOOK - A2ZCHAPTER - MOTION IN TWO DIMENSIONEXERCISE - Kinematics Of Circular Motion
26 Videos
- MOCK TESTBOOK - A2ZCHAPTER - MOCK TESTEXERCISE - Motion With Constant Acceleration
15 Videos
- NEWTONS LAWS OF MOTIONBOOK - A2ZCHAPTER - NEWTONS LAWS OF MOTIONEXERCISE - Chapter Test
30 Videos
Similar Questions
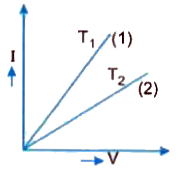
I-V graph for a given metallic wire at two temperatures T1 and T2 is as shown in Fig. Which of the two temperatures is lower and why?
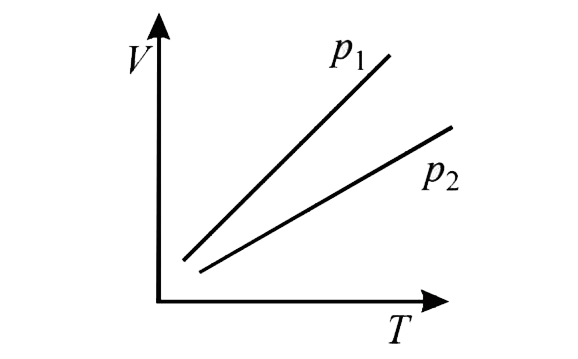
View SolutionThe volume V versus temperature T graphs for a cetain amount of a perfect gas at two pressure p1andp2 are as shown in Fig. It follows from the graphs that p1 is greater than p2.
View Solution
Knowledge Check
There are two coils A and B as shown in Fig.
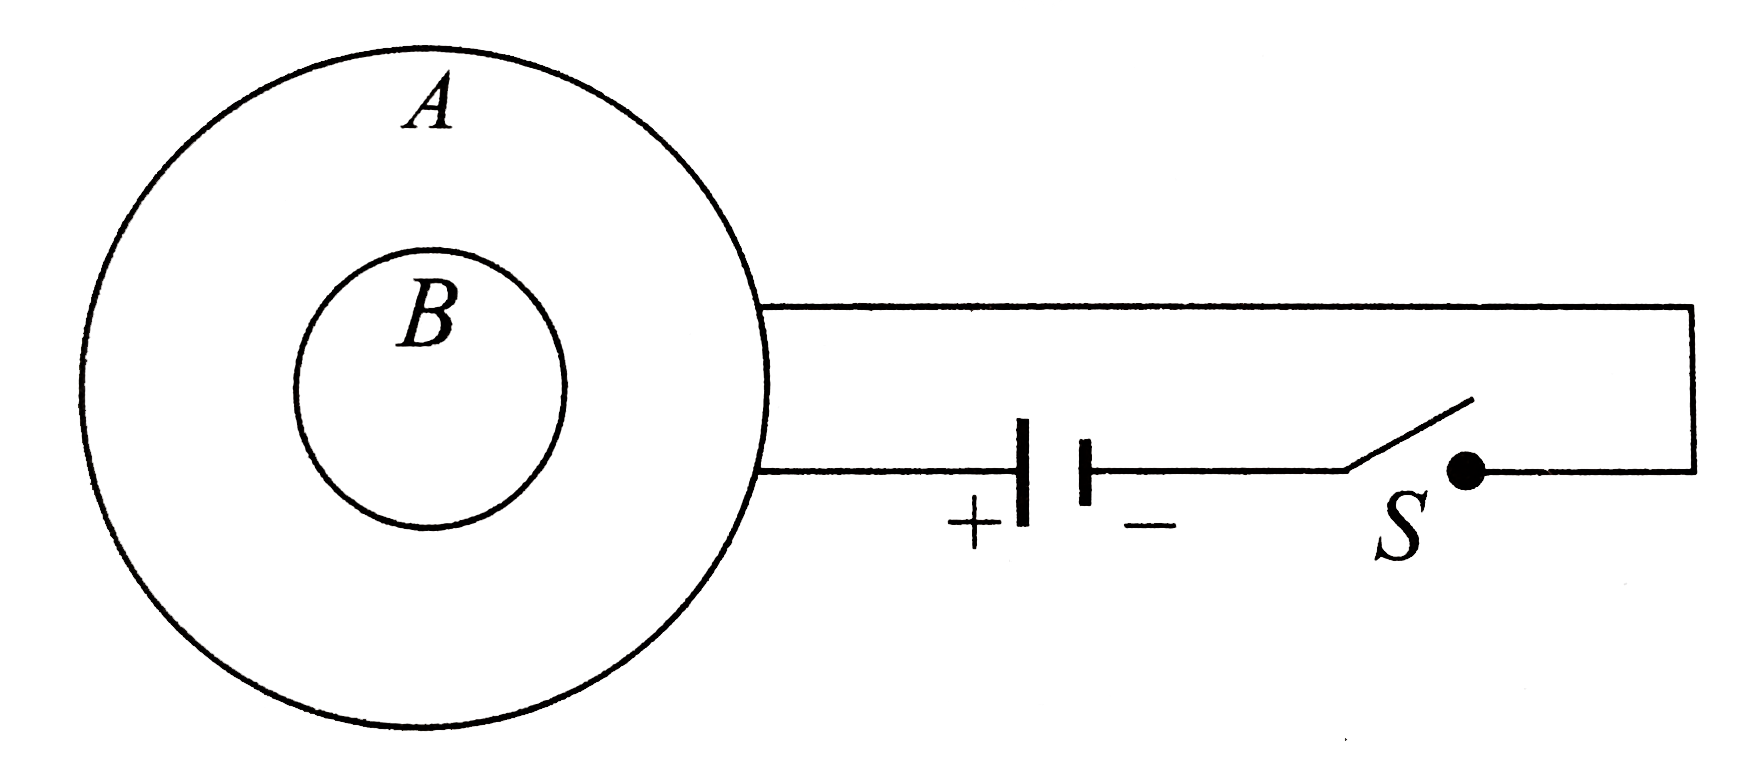 AWhen switch S is closed, the direction of the momentary current induced in coil B will be in anticlockwise directionBWhen switch S is closed, the direction of the momentary current induced in coil B will be in clockwise direction.CWhen switch S is opened, the direction of the momentary induced current in coil B will be in clockwise directionDWhen switch S is opened, the direction of the momentary induced current in coil B will be in anticlockwise direction.
Trajectories of two projectiles are shown in the figure. Let T1 and T2 be the time period and u1 & u2 speeds of projection. Then
 AT2>T1BT1=T2Cu1>u2Du1<u2
The indicator diagram for two processes 1 and 2 carrying on an ideal gas is shown in Fig. If m1 and m2 be the slopes (dP/dV) for process 1 and process 2, respectively, then
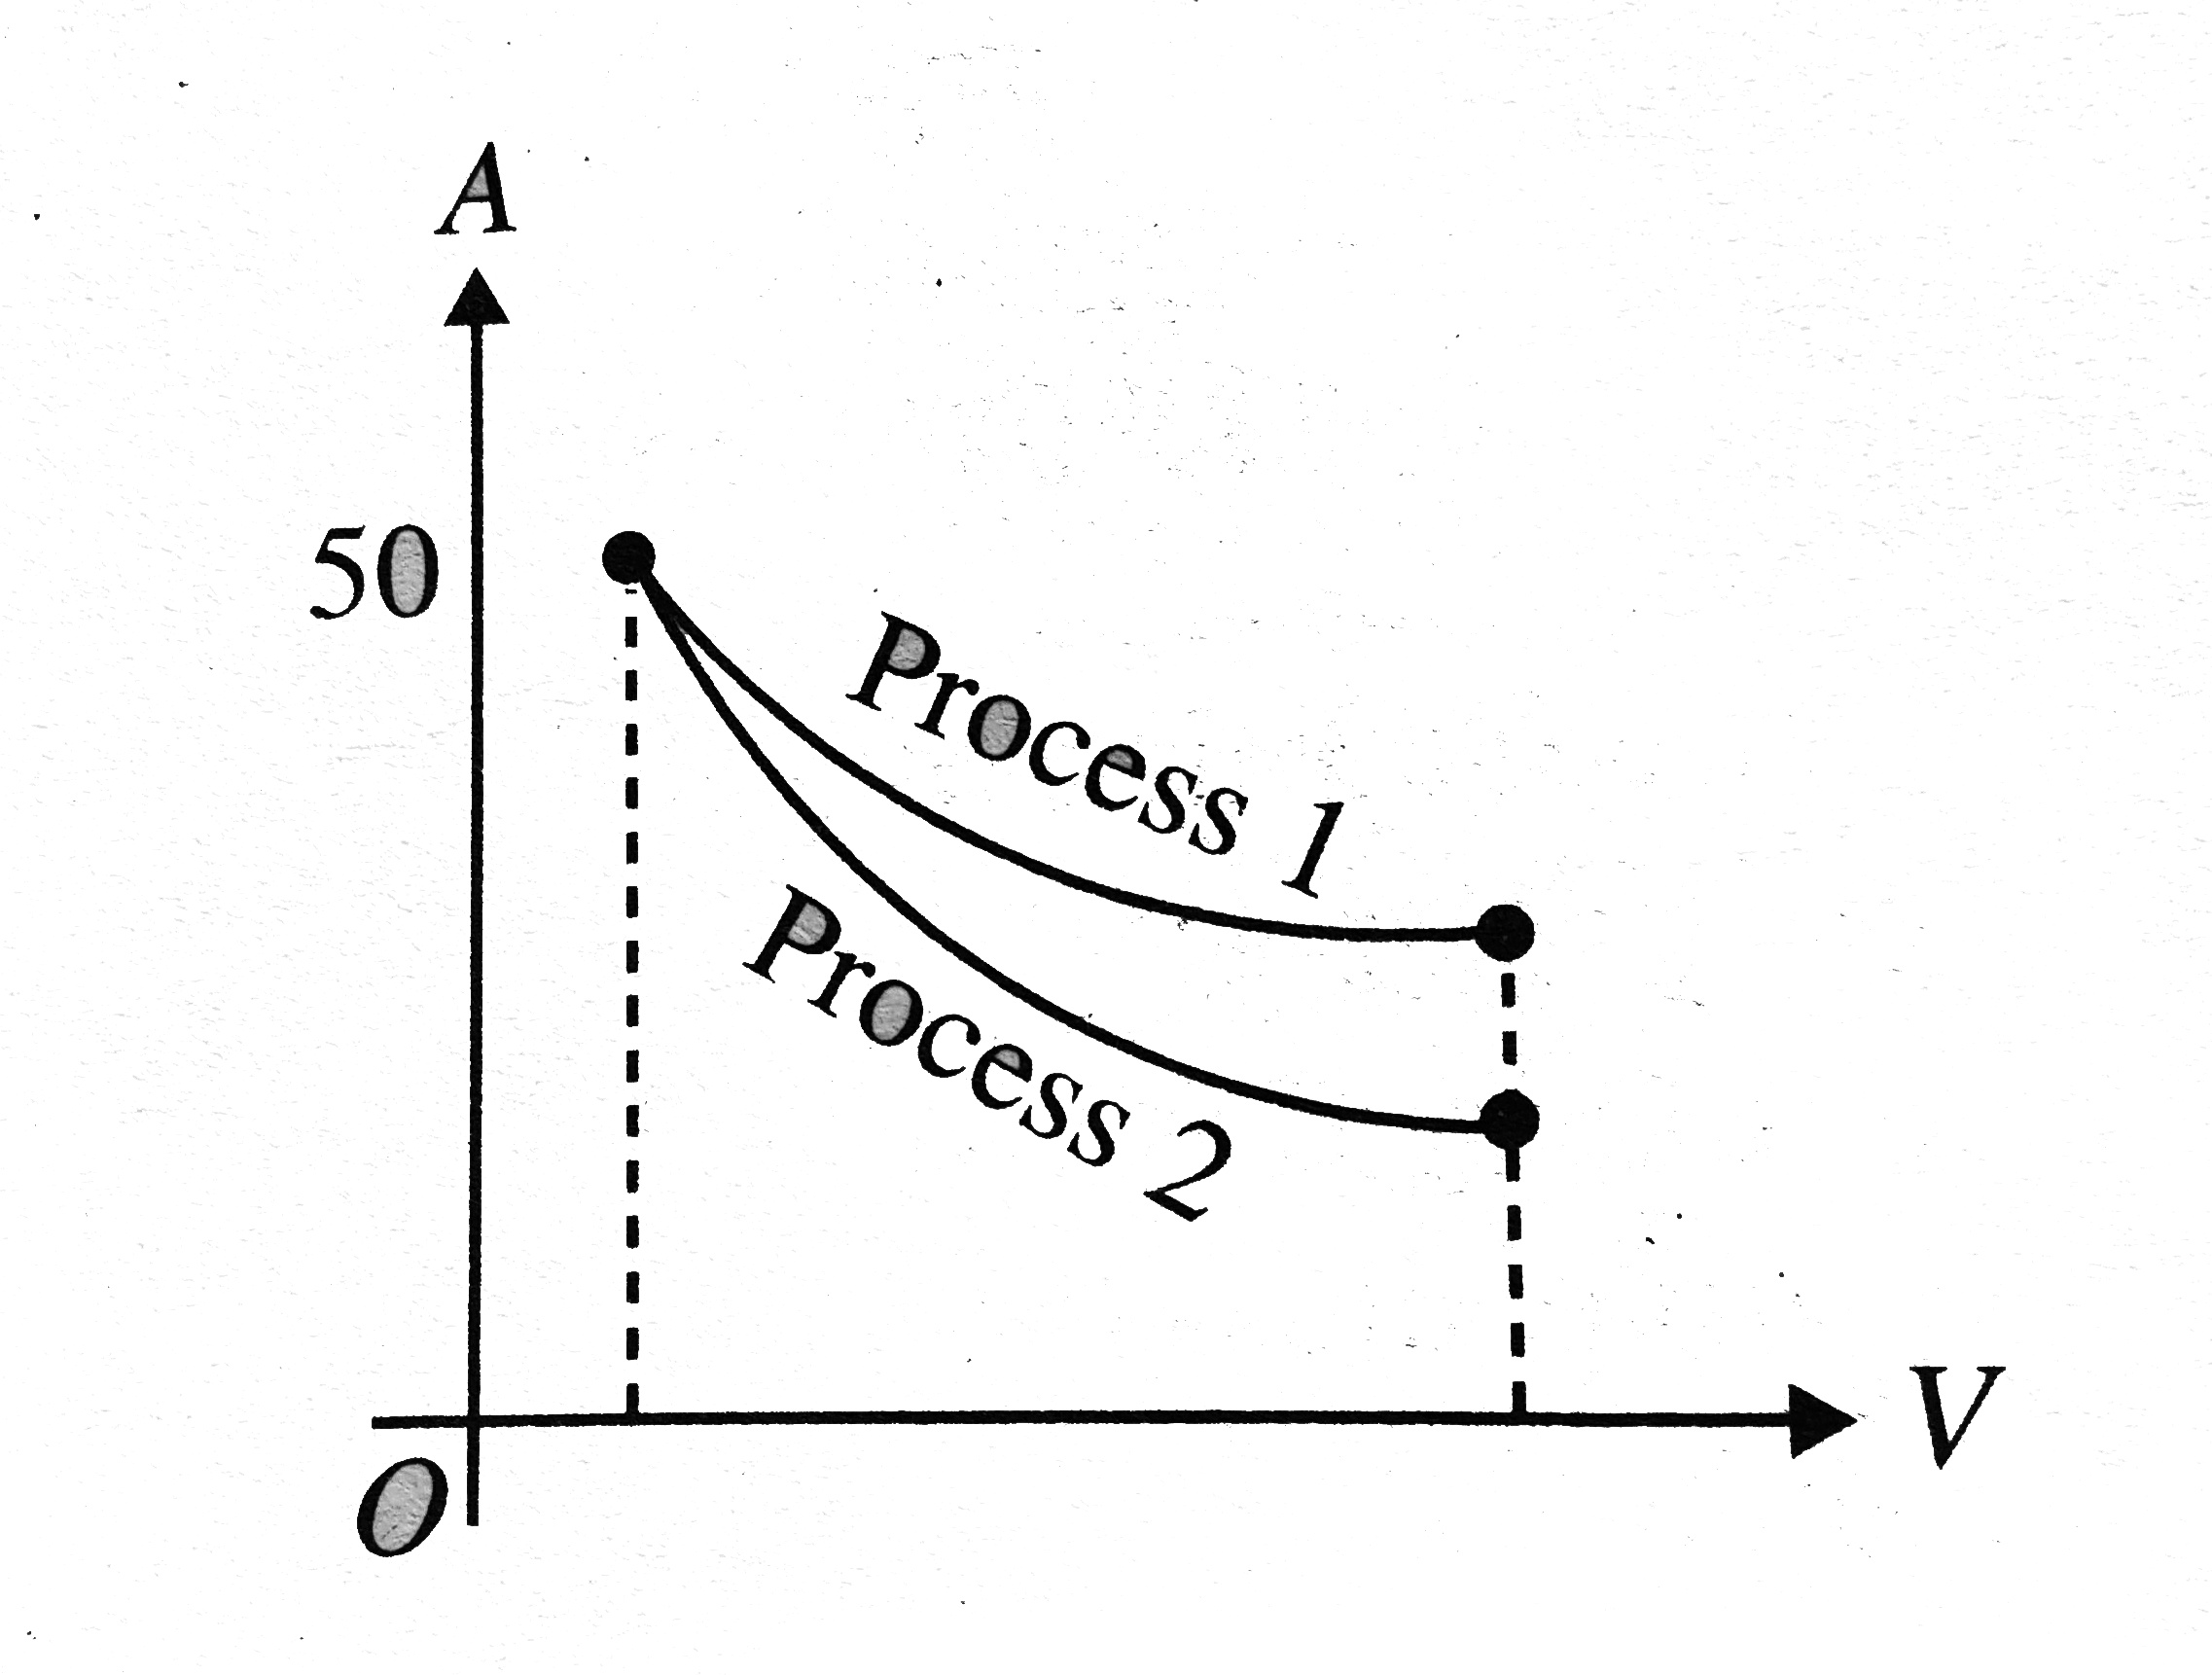 Am1=m2Bm1>m2Cm1<m2Dm2CV=m1CP
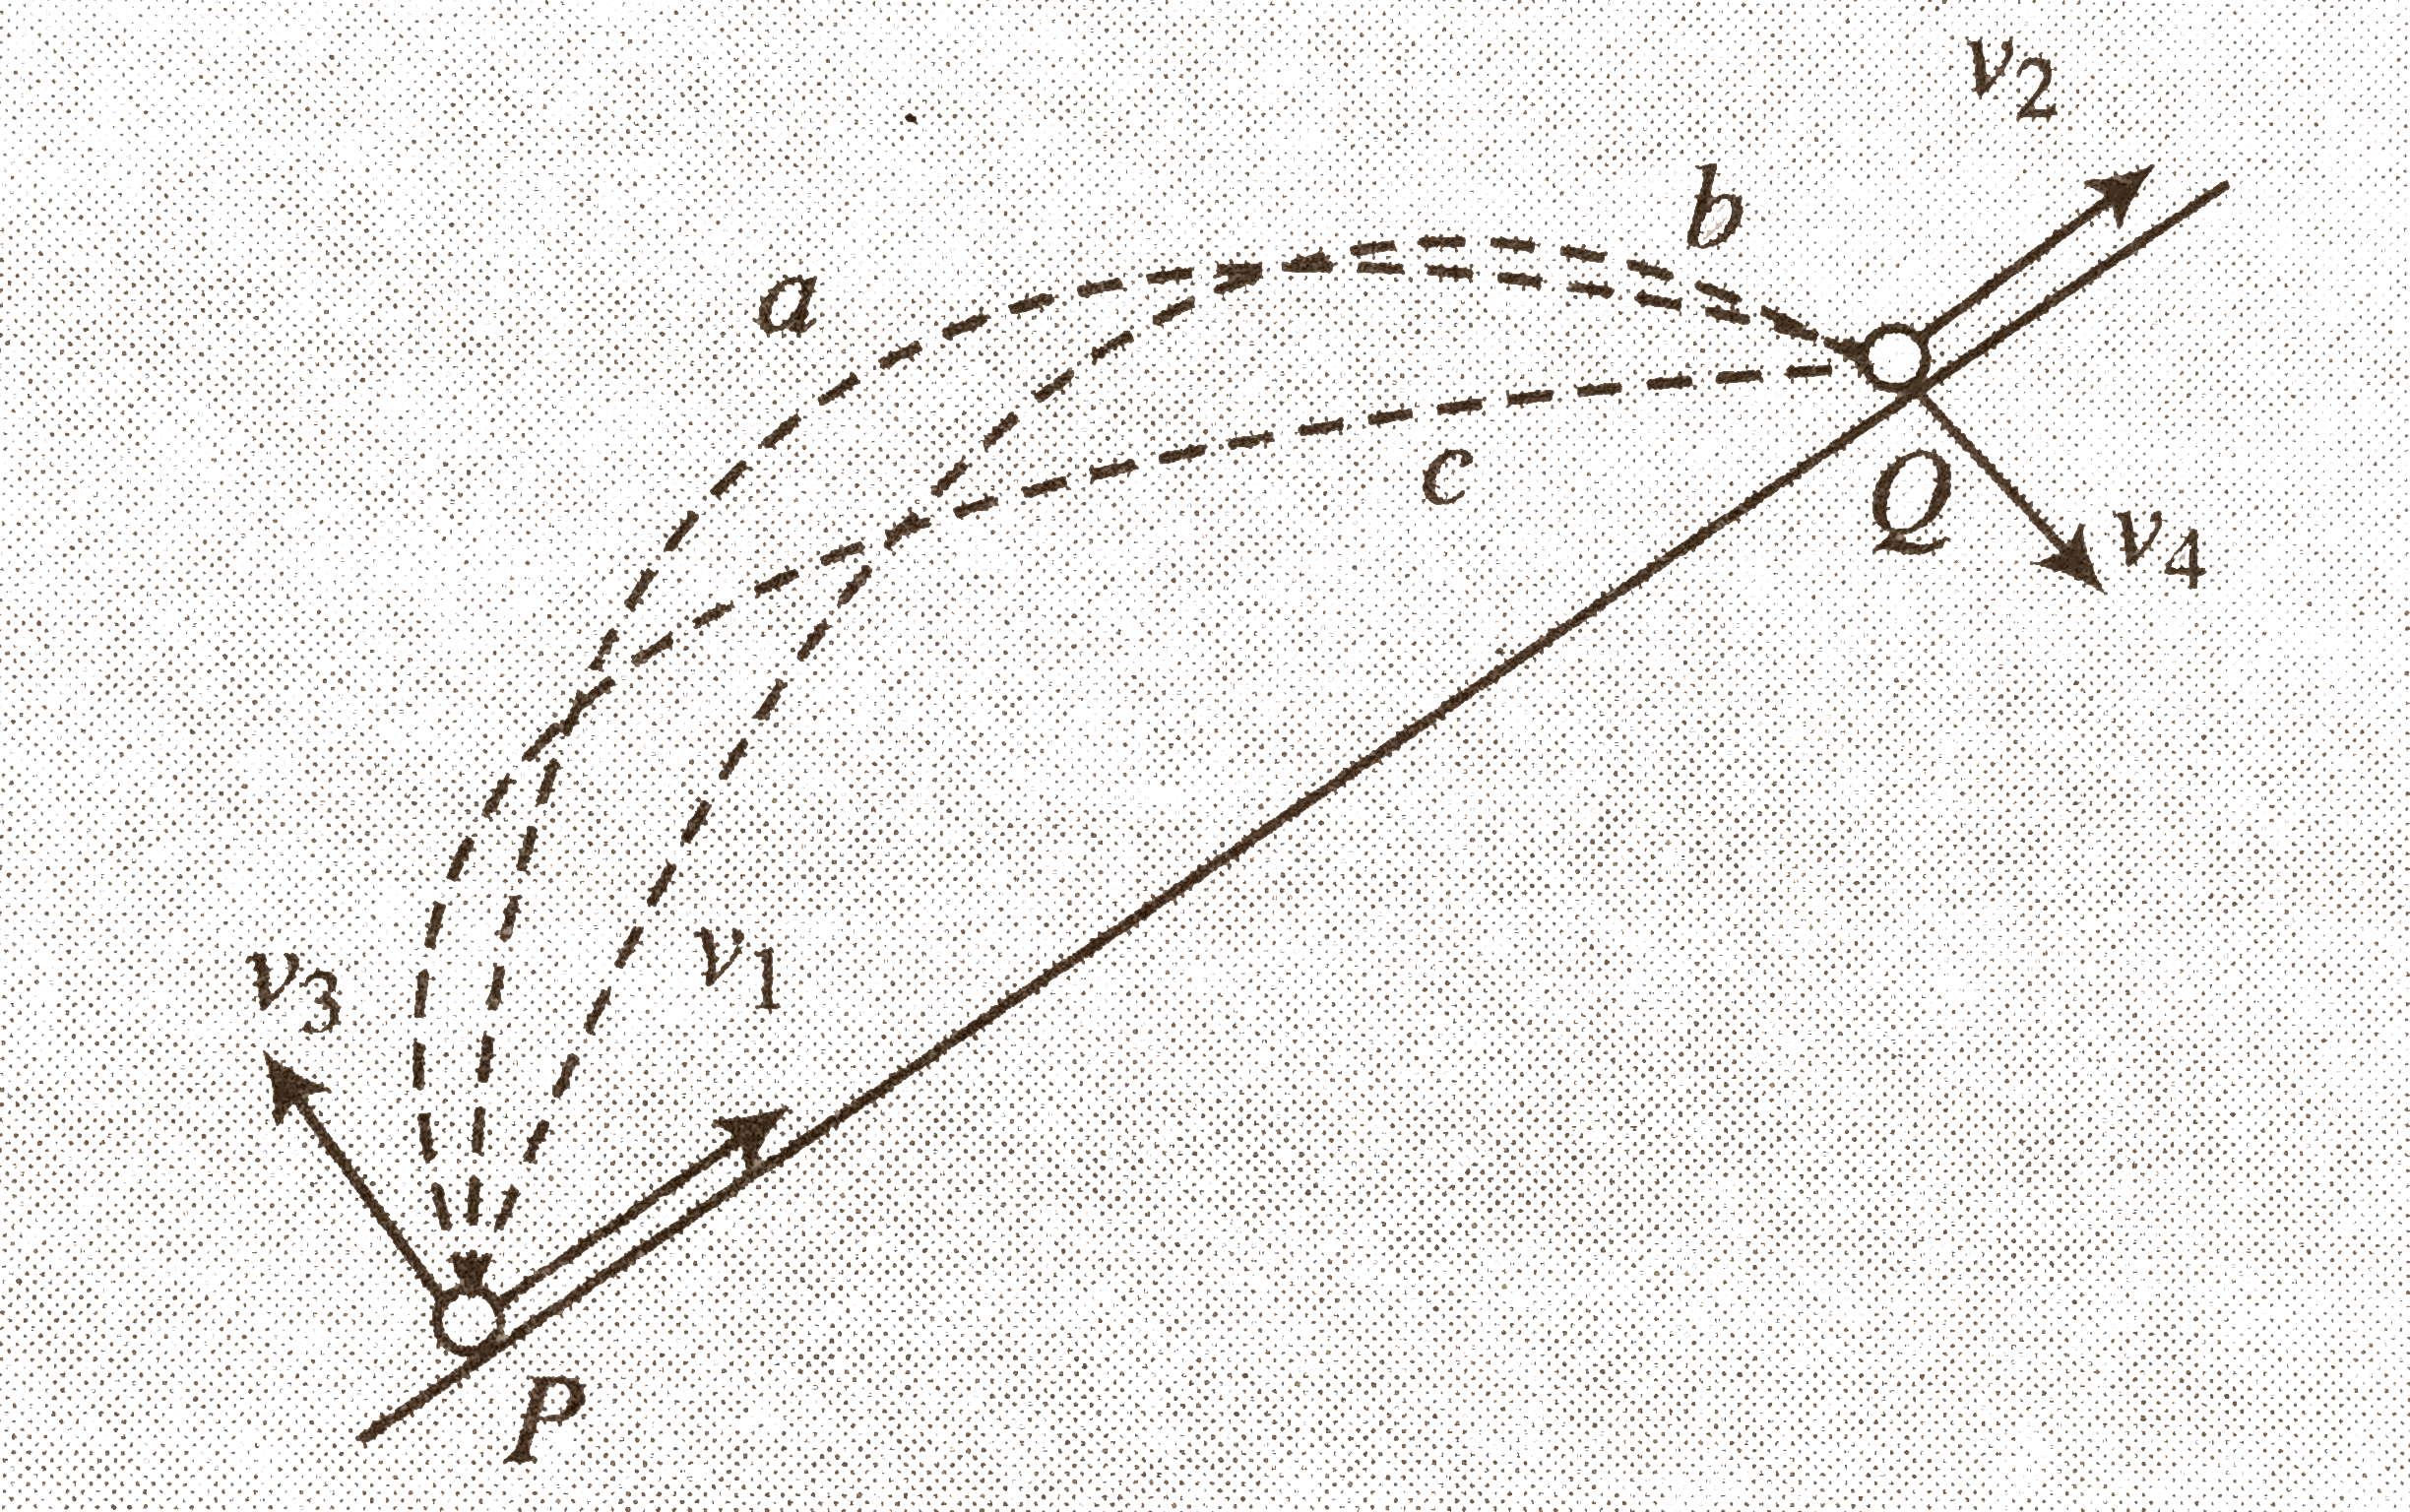
There are three paths a,bandc of a projectile projected from point P as shown in (Fig. 5.62). Prove that v1>v2andv3=v4. Which path is correct ?
 .
.
View SolutionIn the given diagram shown, for a projectile, what is the angle of projection? (A) tan−1(1) (B) tan−1(83) (C) tan−1(43) (D) tan−1(53)
View SolutionTrajectories of two projectiles are shown in figure.Let T1 and T2 be the time periods and u1 and u2 their speeds of projection.Then
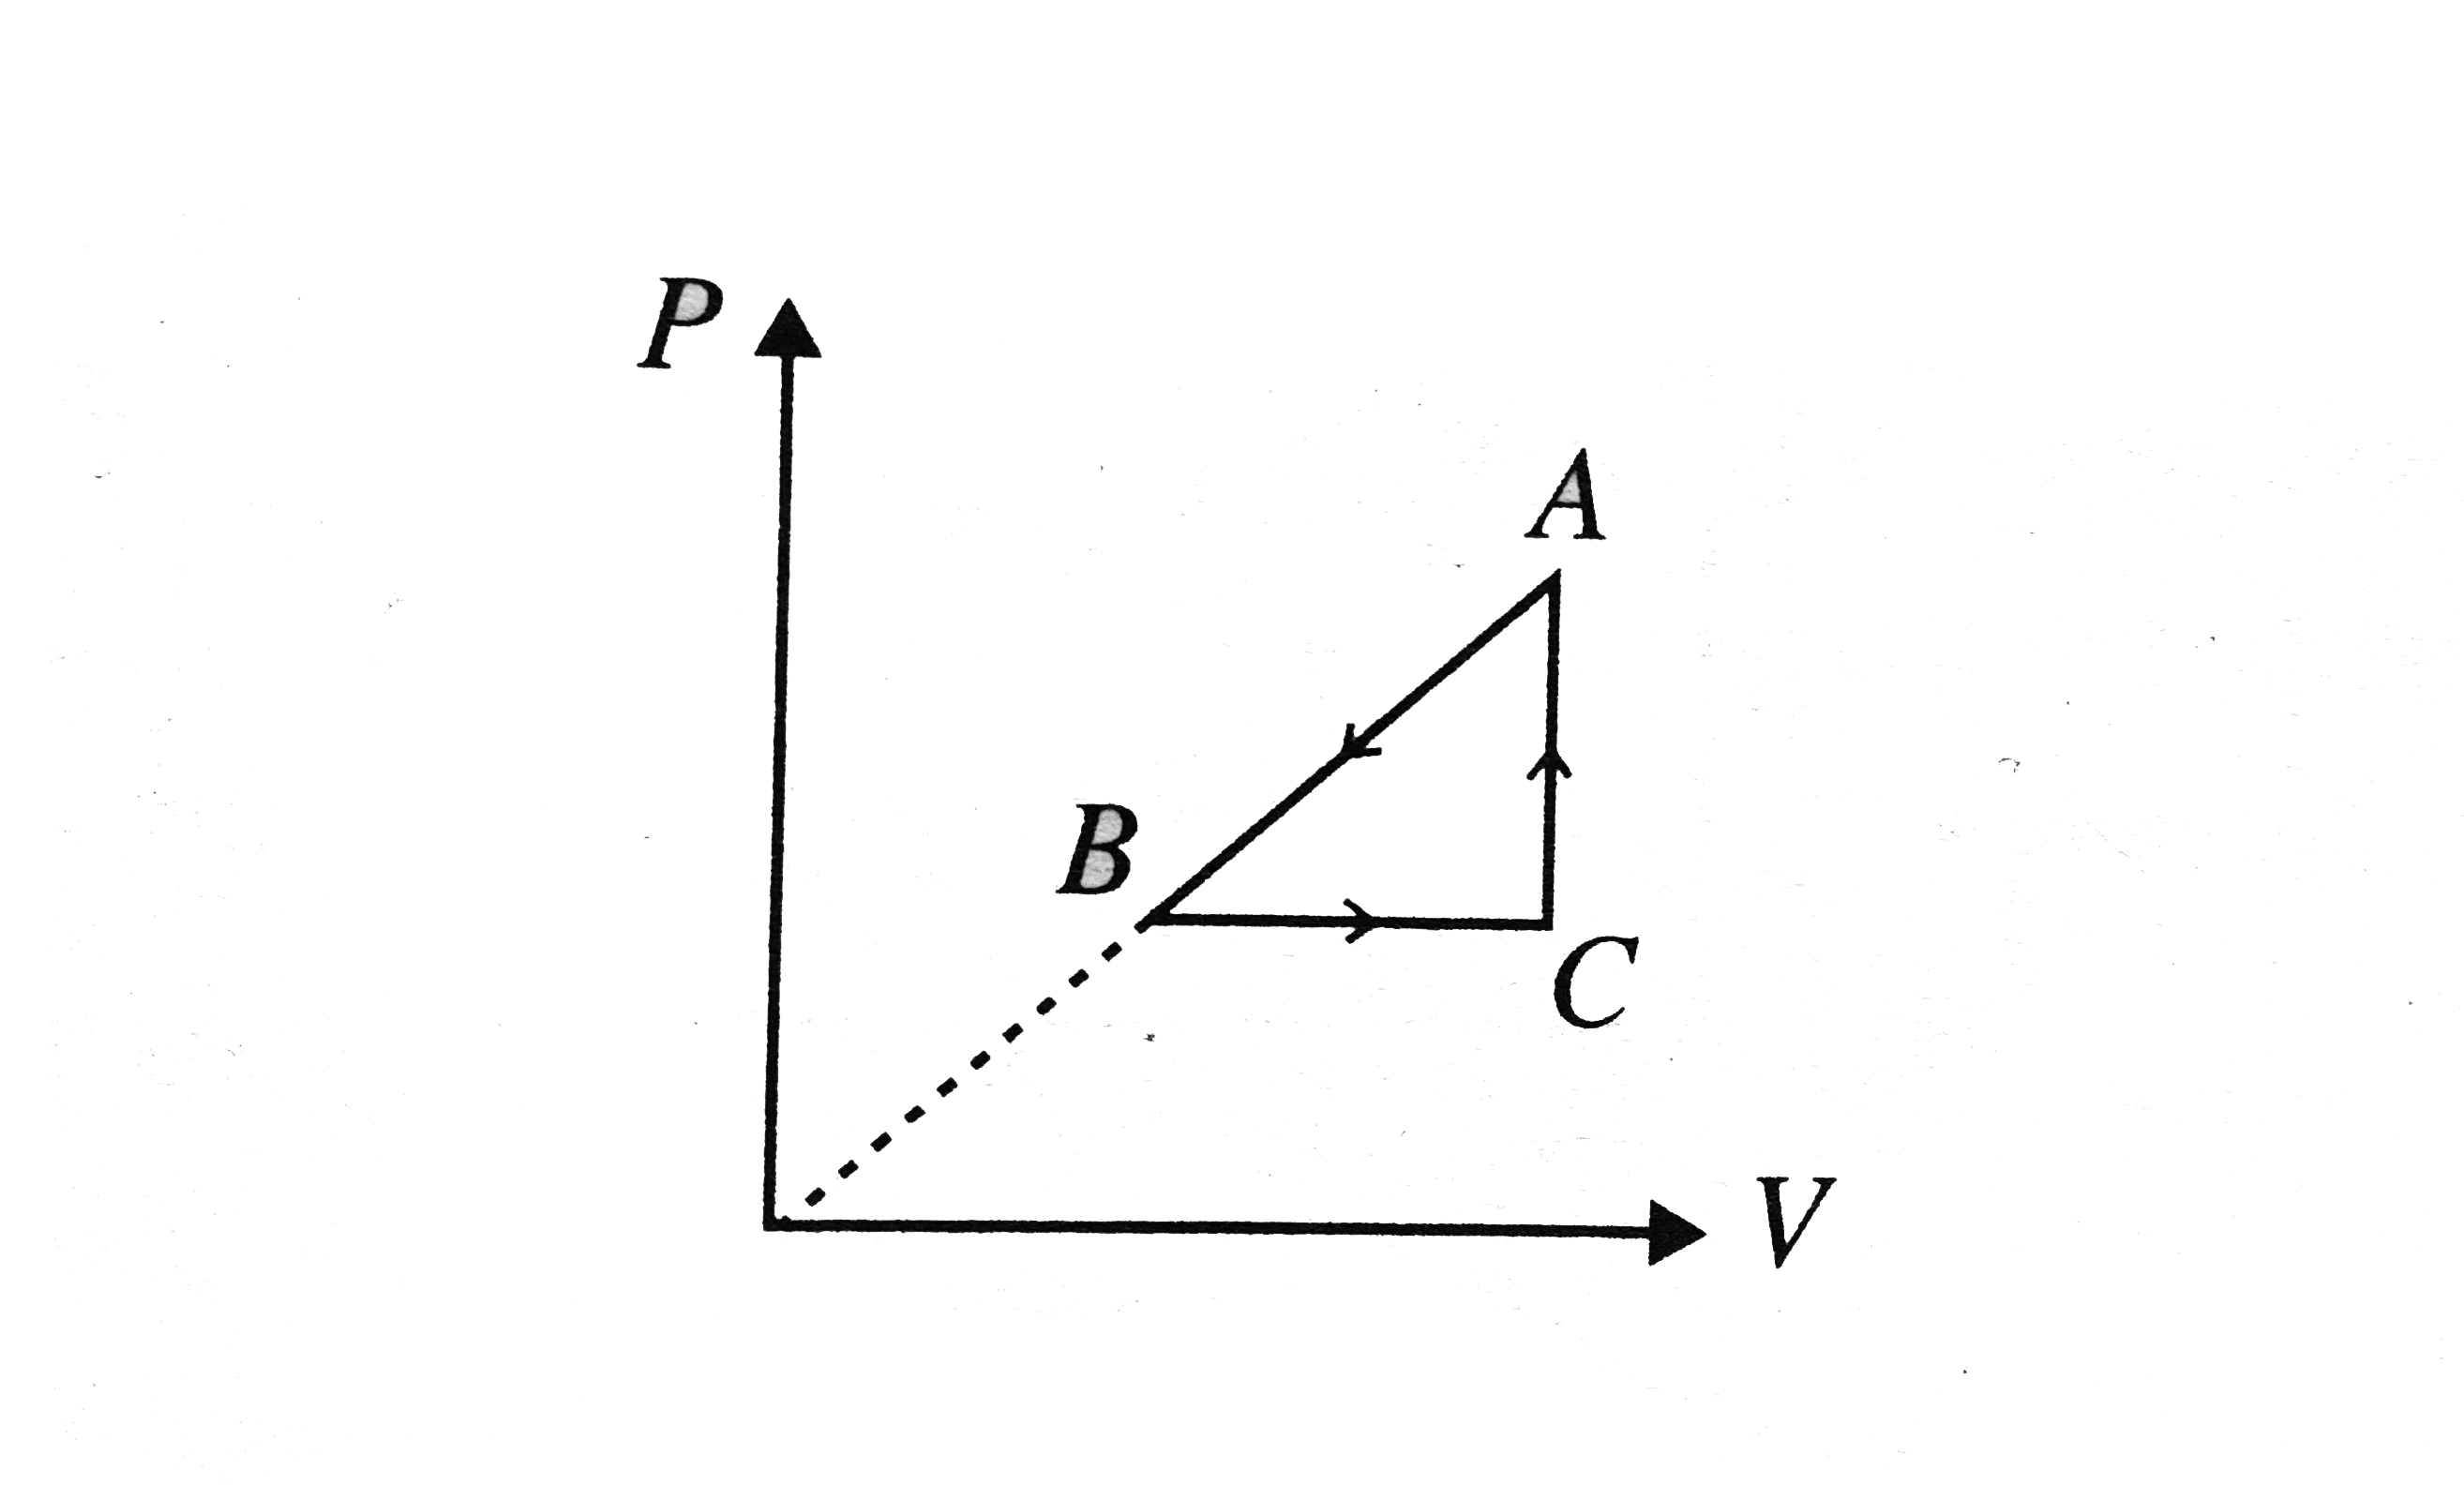
View SolutionP−V diagram of a cyclic process ABCA is as shown in Fig. Choose the correct alternative
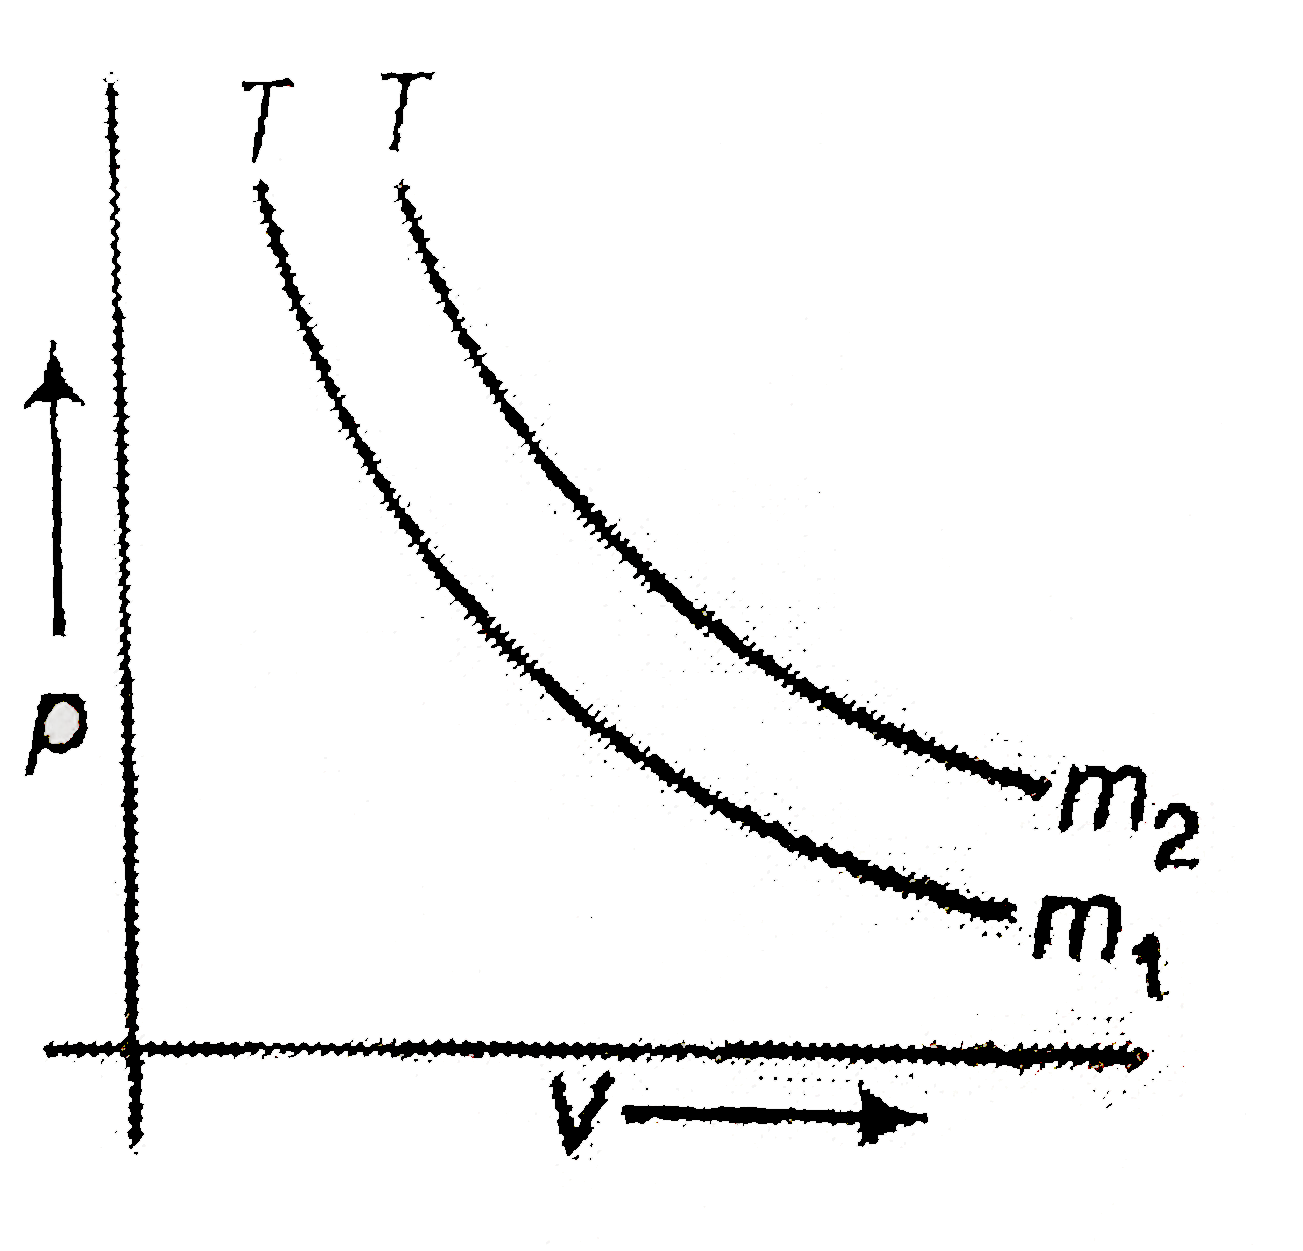
View SolutionThe figure shown, the p-V diagram of two different masses m1andm2 drawn at constant temperature T, then ltbr>
View Solution