The figure shown, the p-V diagram of two different masses m1andm2 drawn at constant temperature T, then ltbr> 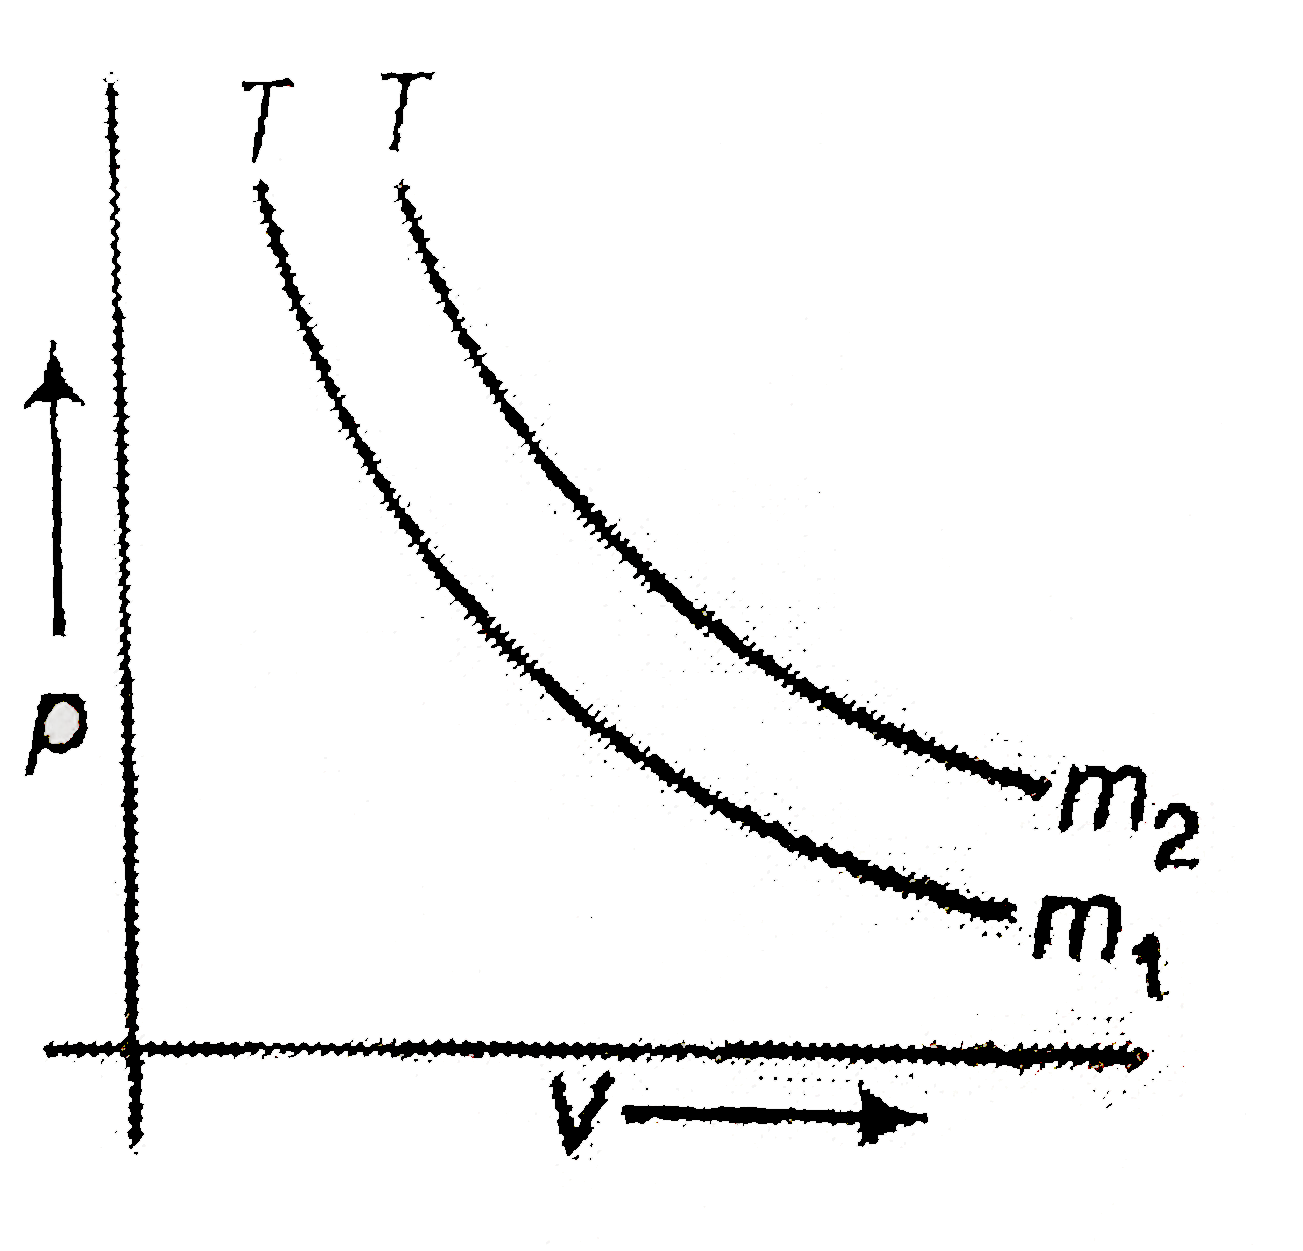
m1>m2
m2>m1
m1=m2
insufficient data
The correct Answer is:B
We know that,
pV=nRT=mMRT
m=(pV)MRT
m∝pv
p2V2>P1V1
From the curve, m2>m1
Topper's Solved these Questions
Similar Questions
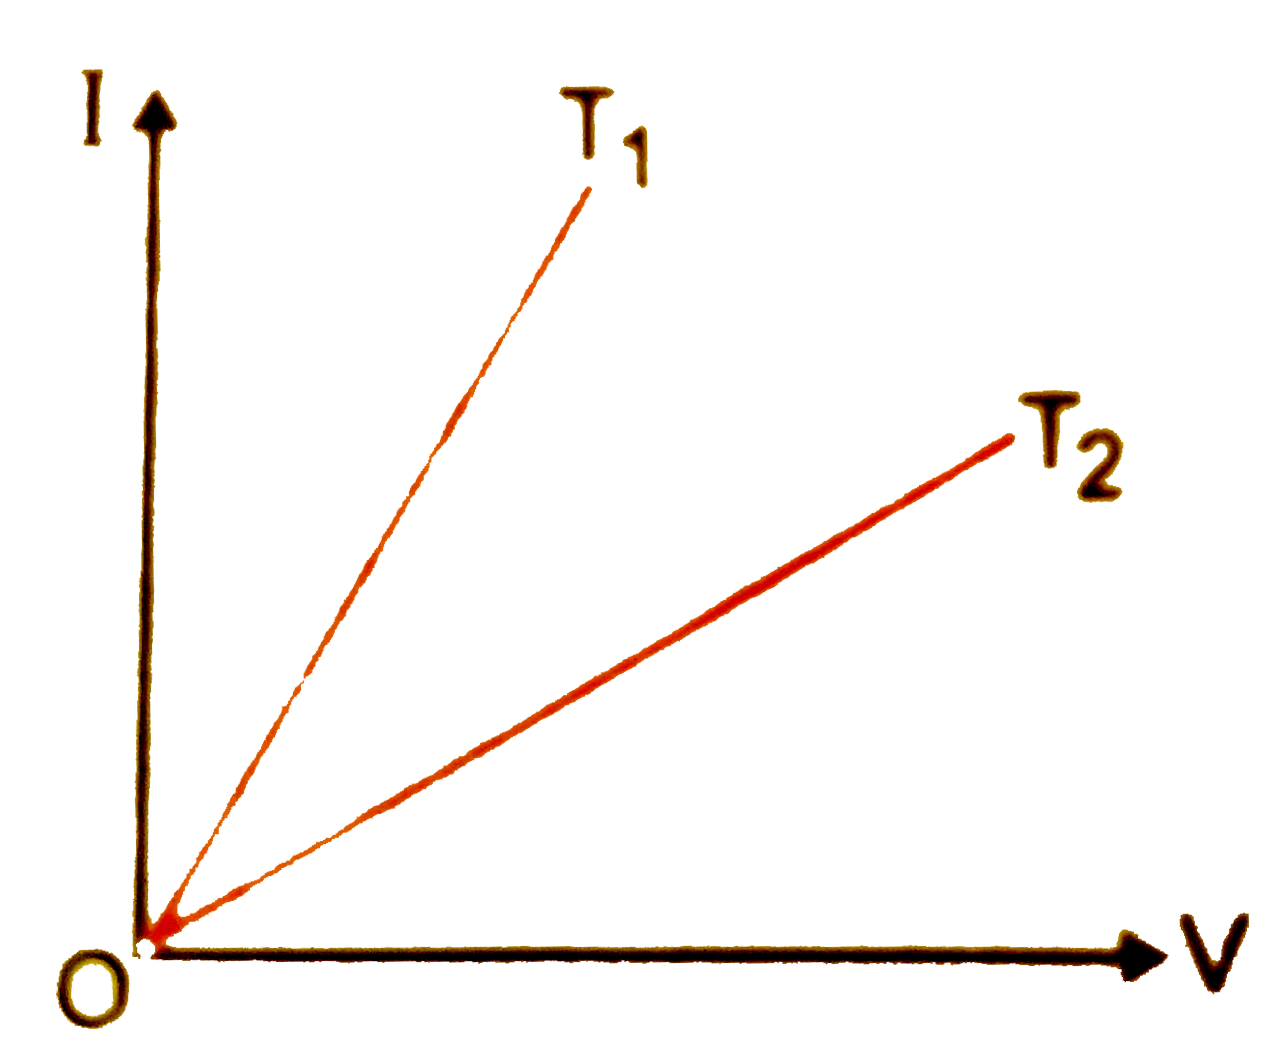
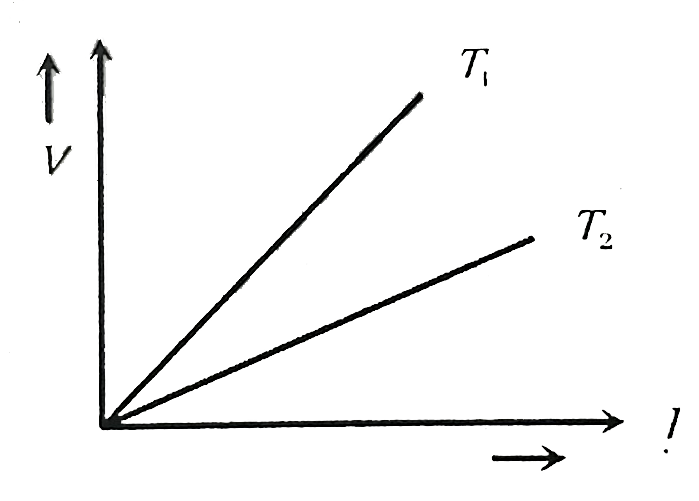
V- I graph for a metallic wire at two different temperature T1 and T2 is shown in figure. Which of the two temperature is higher and why?
 View Solution
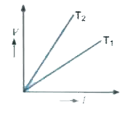
The voltage-current (V-I) graph of a metallic conductor at two different temperature T1 and T2 is shown in figure. At which temperature is the resistance higher?
 View Solution
Knowledge Check
- Question 1 - Select One
The isothermal diagram of a gas at three different temperatures T1,T2and_(3), is show in the given figure .Then
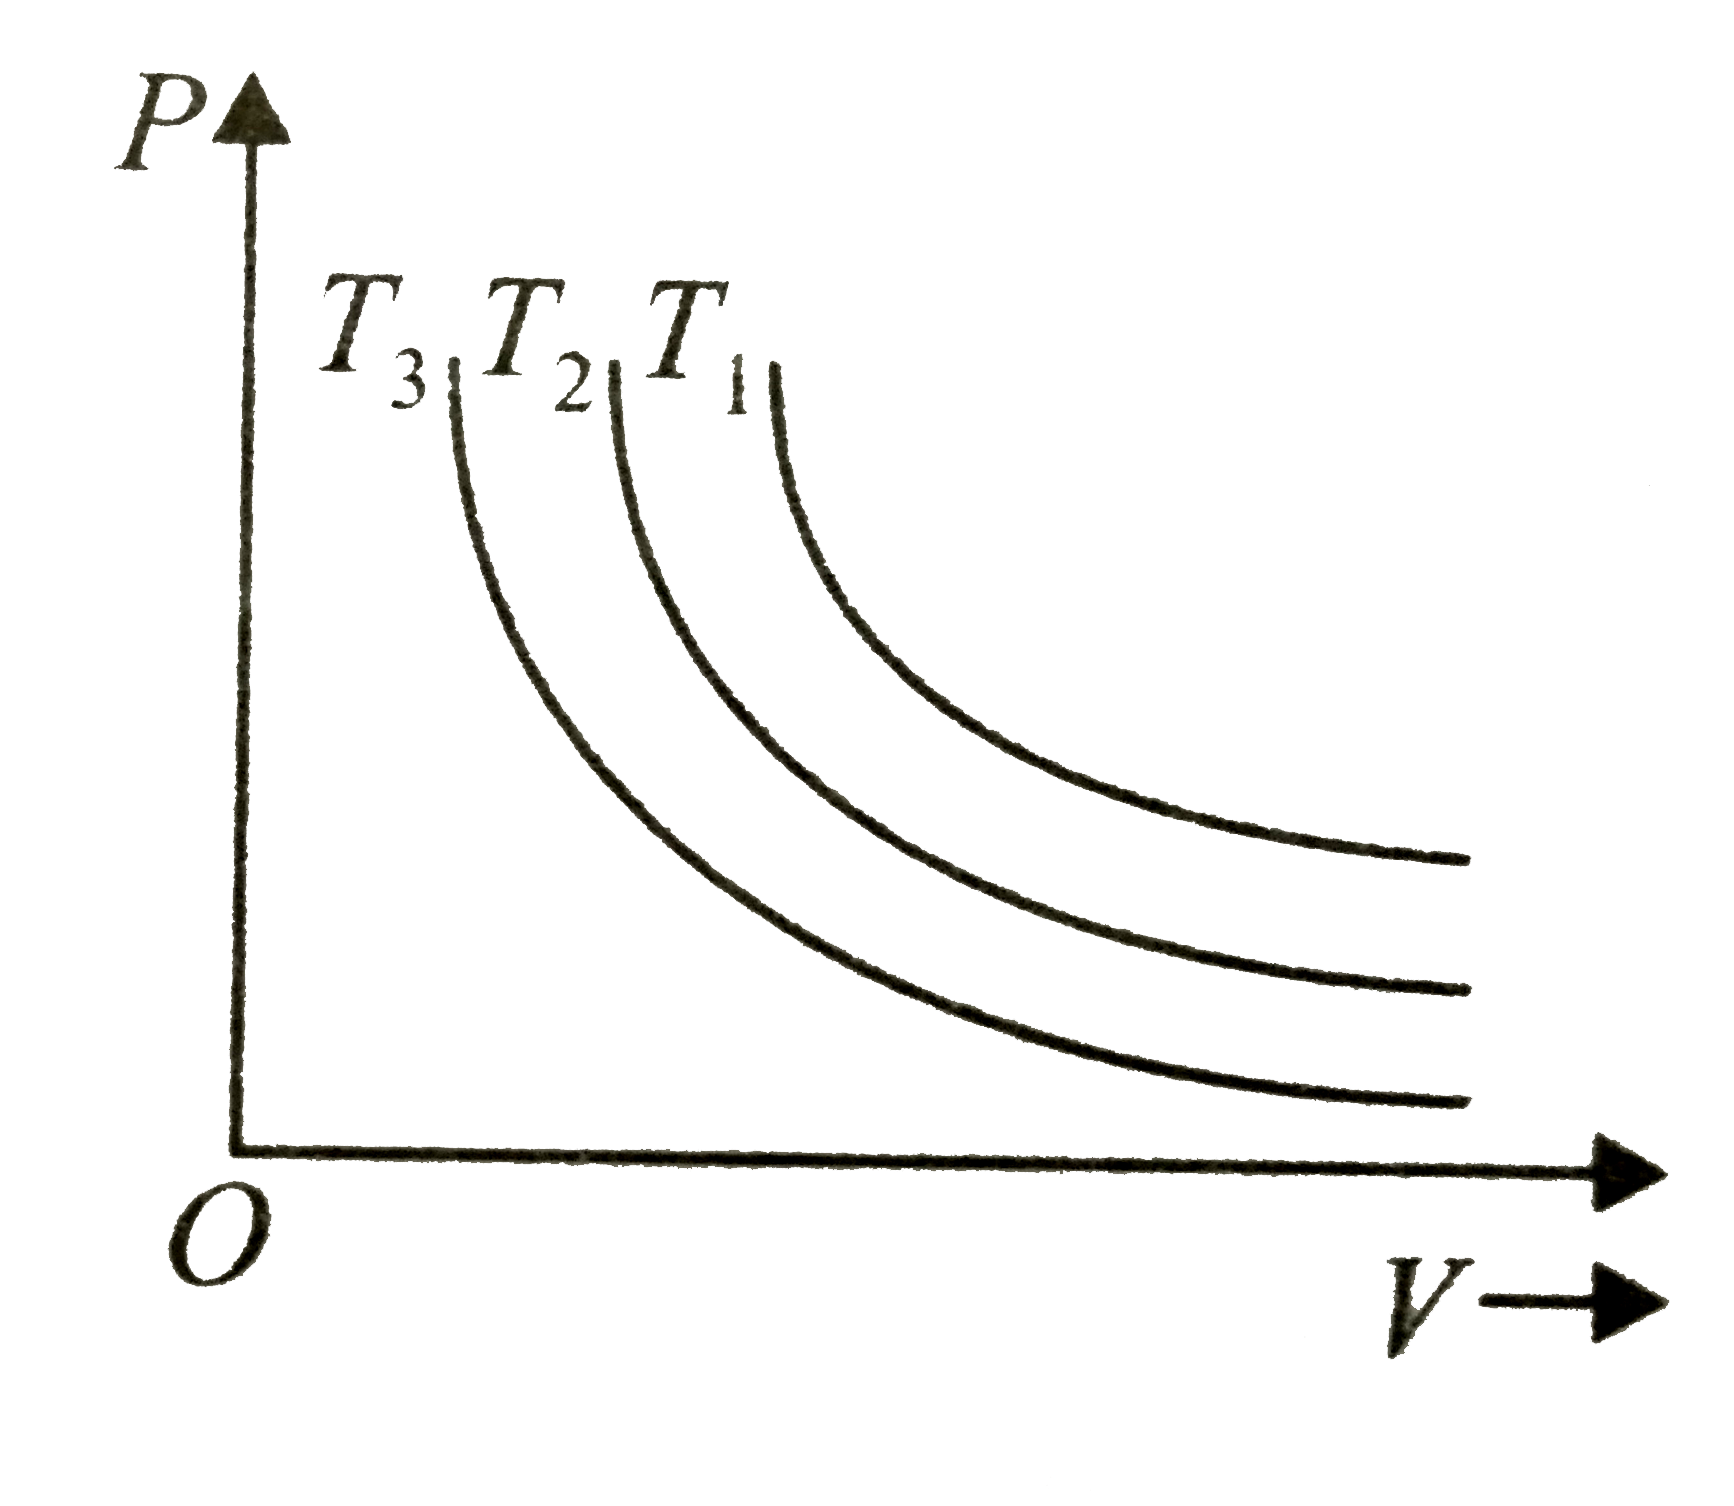 AT1<T2<T3BT1<T2>T3CT1>T2>T3DT1>T2<T3
 - Question 2 - Select One
The voltage V and current I graph for a conductor at two different temperatures T1 and T2 are shown in the figure. The relation between T1 and T2 is
 AT1>T2BT1≈T2CT1=T2DT1<T2
 - Question 3 - Select One
Figure shows the pressure P versus volume V graphs for a certains mass of a gas at two constant temperature T1andT2. Which of the following interface is correct?
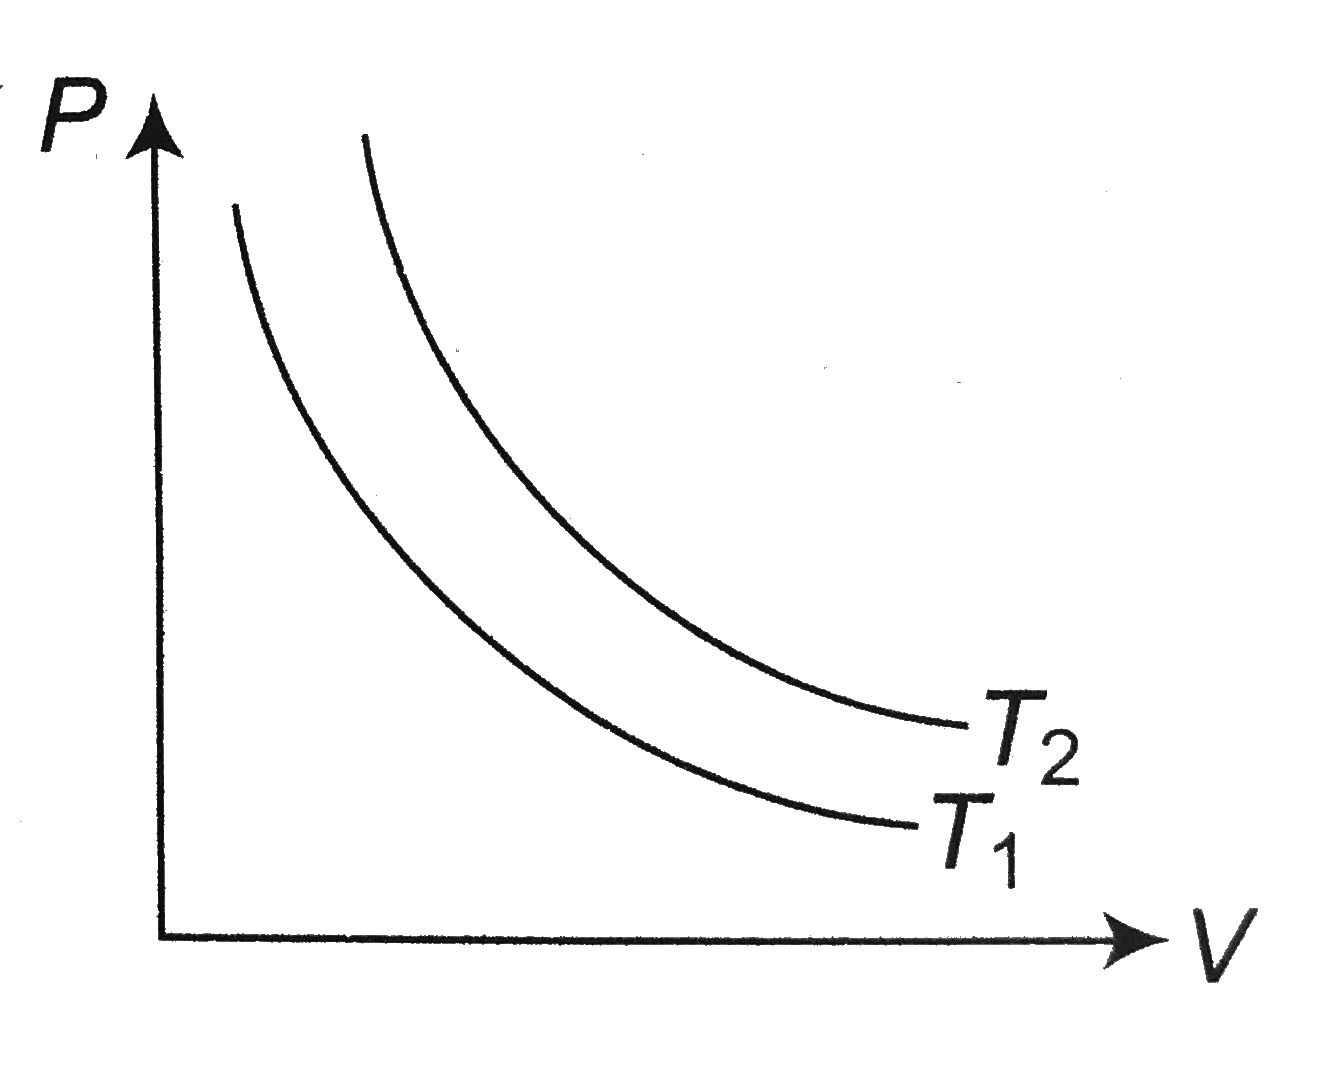 AT1=T2BT1>T2CT1<T2Dno inference can be drawn due to insufficient information
I-V graph for a metallie wire at two different tempearture, T1andT2 is as shown in the figure. Which of the two temperatures is lower and why ?
 View Solution
The current - voltage graphs for a given metallic wire at two different temperatures T1andT2 are shown in the figure.
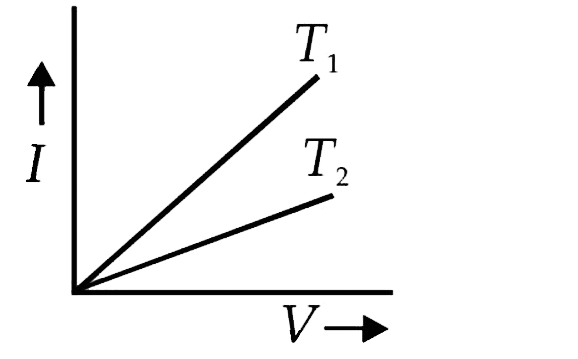
The temperature T2 is greater than T1.View SolutionThe voltage V and current I v graphs for a conductor at two different temperatures T1andT2 are shown in the figure. The relation between T1andT2 is
 View Solution
Equal volumes of two different gases 1 and 2 with respective molecular masses M1 and M2 are the same temperature (T) and pressure (P), if M1>M2, then which of the following is true regarding the number of molecules (N) ?
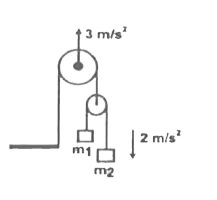
View SolutionIn the figure shown, the acceleration of block of mass m2 is 2m/s2. The acceleration of m1 :
 View Solution

