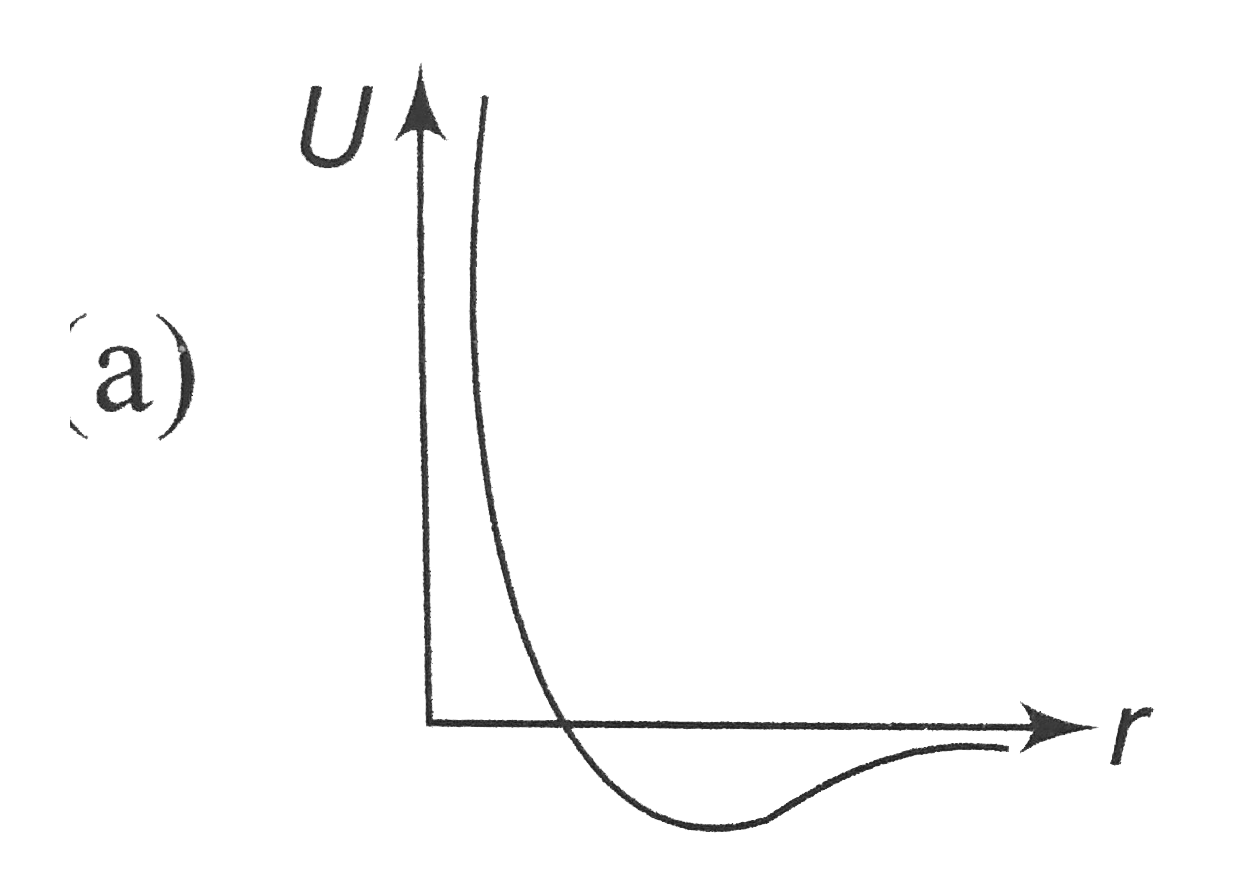
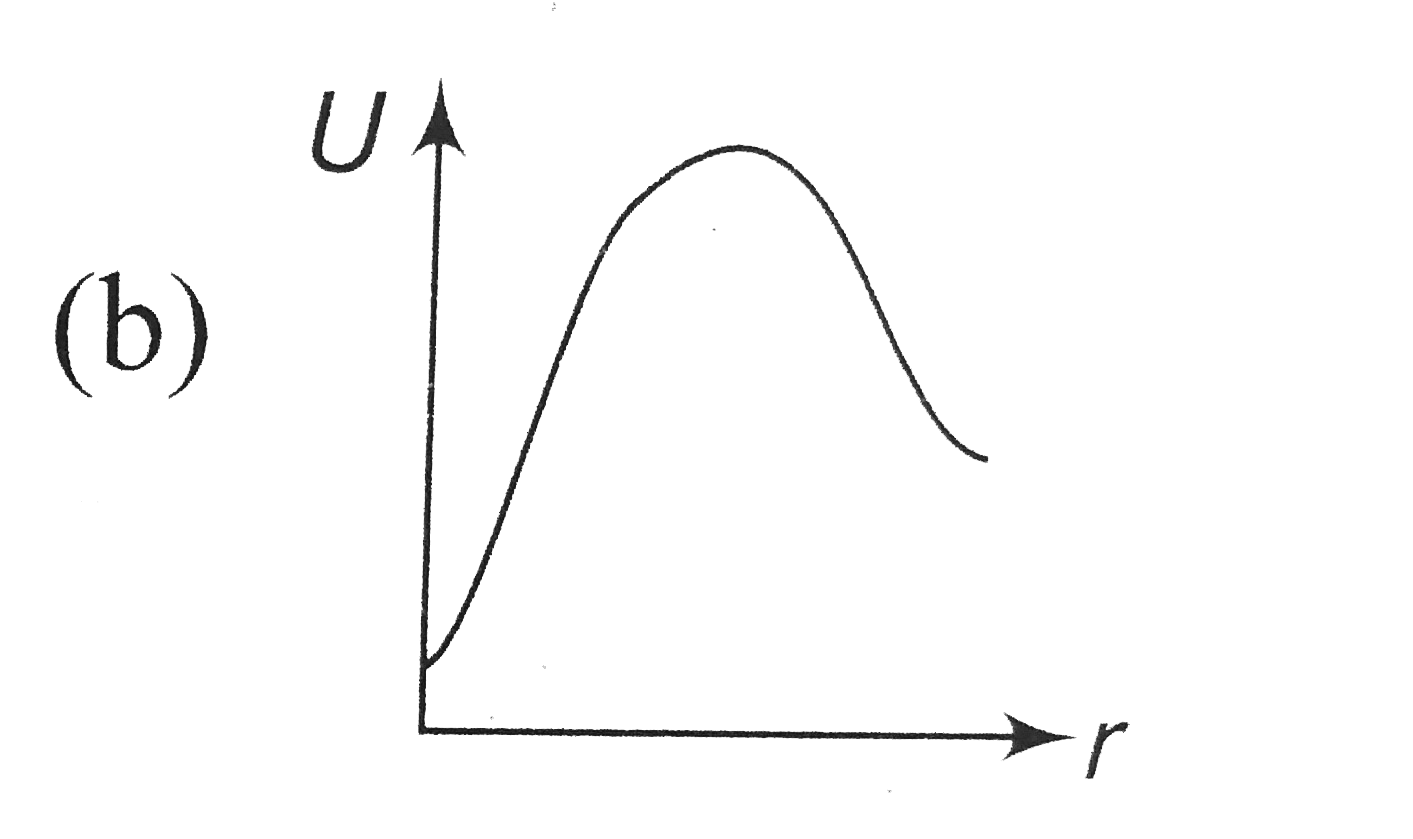
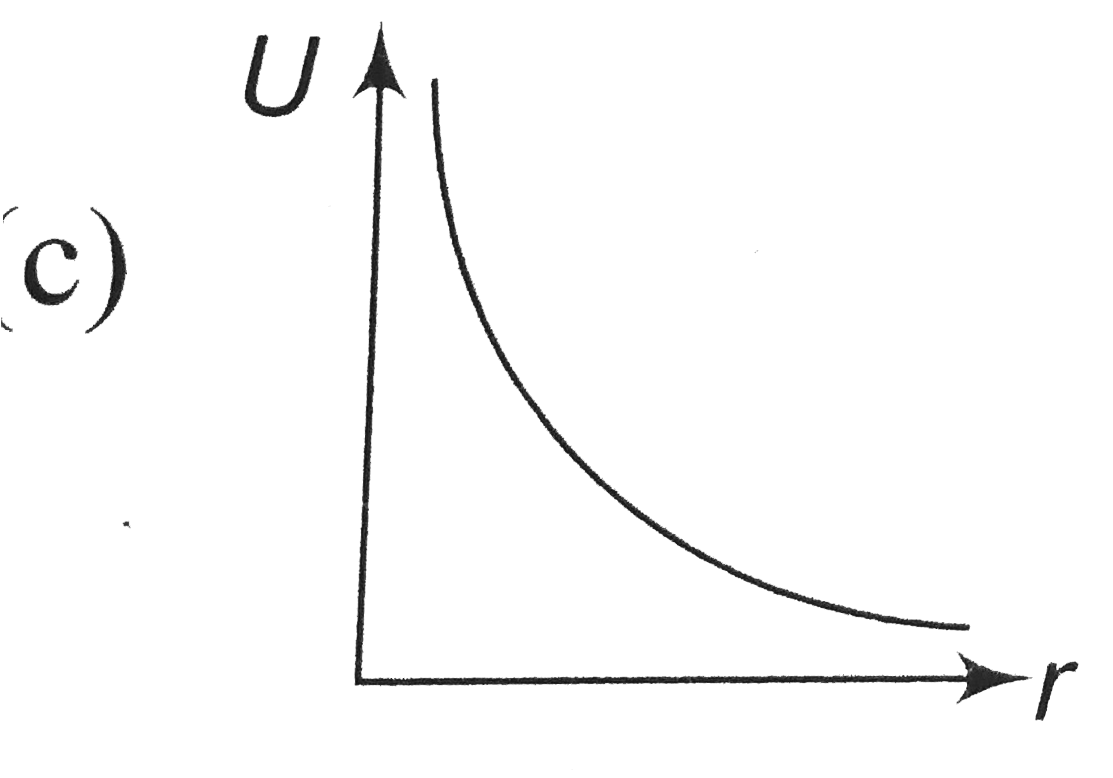
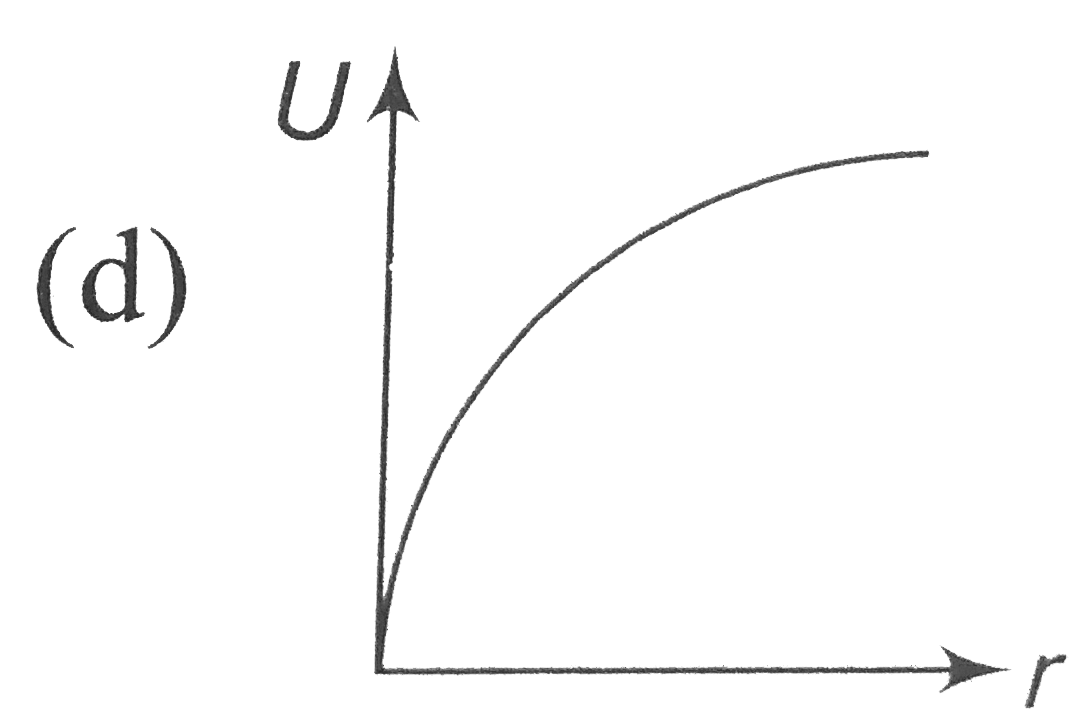
The diagram respresent the potential energy U of a function of the inter atomic distance r. Which diagram corresponding to slabe molecules found in nature?
The correct Answer is:A
When the distance between atoms is large its introtamic force is very weak when they one close force because increases and it a period distance force becomes zero When they are further brought closer force becomes repative in motion
This can explated by slope of U curve shown in graph
Topper's Solved these Questions
- WORK, ENERGY, POWER AND COLLISIONBOOK - A2ZCHAPTER - WORK, ENERGY, POWER AND COLLISIONEXERCISE - Conservation Of Mechanical Energy And Linear Momentum
24 Videos
- WORK, ENERGY, POWER AND COLLISIONBOOK - A2ZCHAPTER - WORK, ENERGY, POWER AND COLLISIONEXERCISE - Mechanical Power
25 Videos
- WORK, ENERGY, POWER AND COLLISIONBOOK - A2ZCHAPTER - WORK, ENERGY, POWER AND COLLISIONEXERCISE - Work-Energy Theorem
27 Videos
- WAVES AND ACOUSTICSBOOK - A2ZCHAPTER - WAVES AND ACOUSTICSEXERCISE - Chapter Test
30 Videos
Similar Questions
These diagrams represent the potential energy U of a diatomic molecule as a function of the inter-atomic distance r. The diagram corresponds to stable molecule found in nature is.
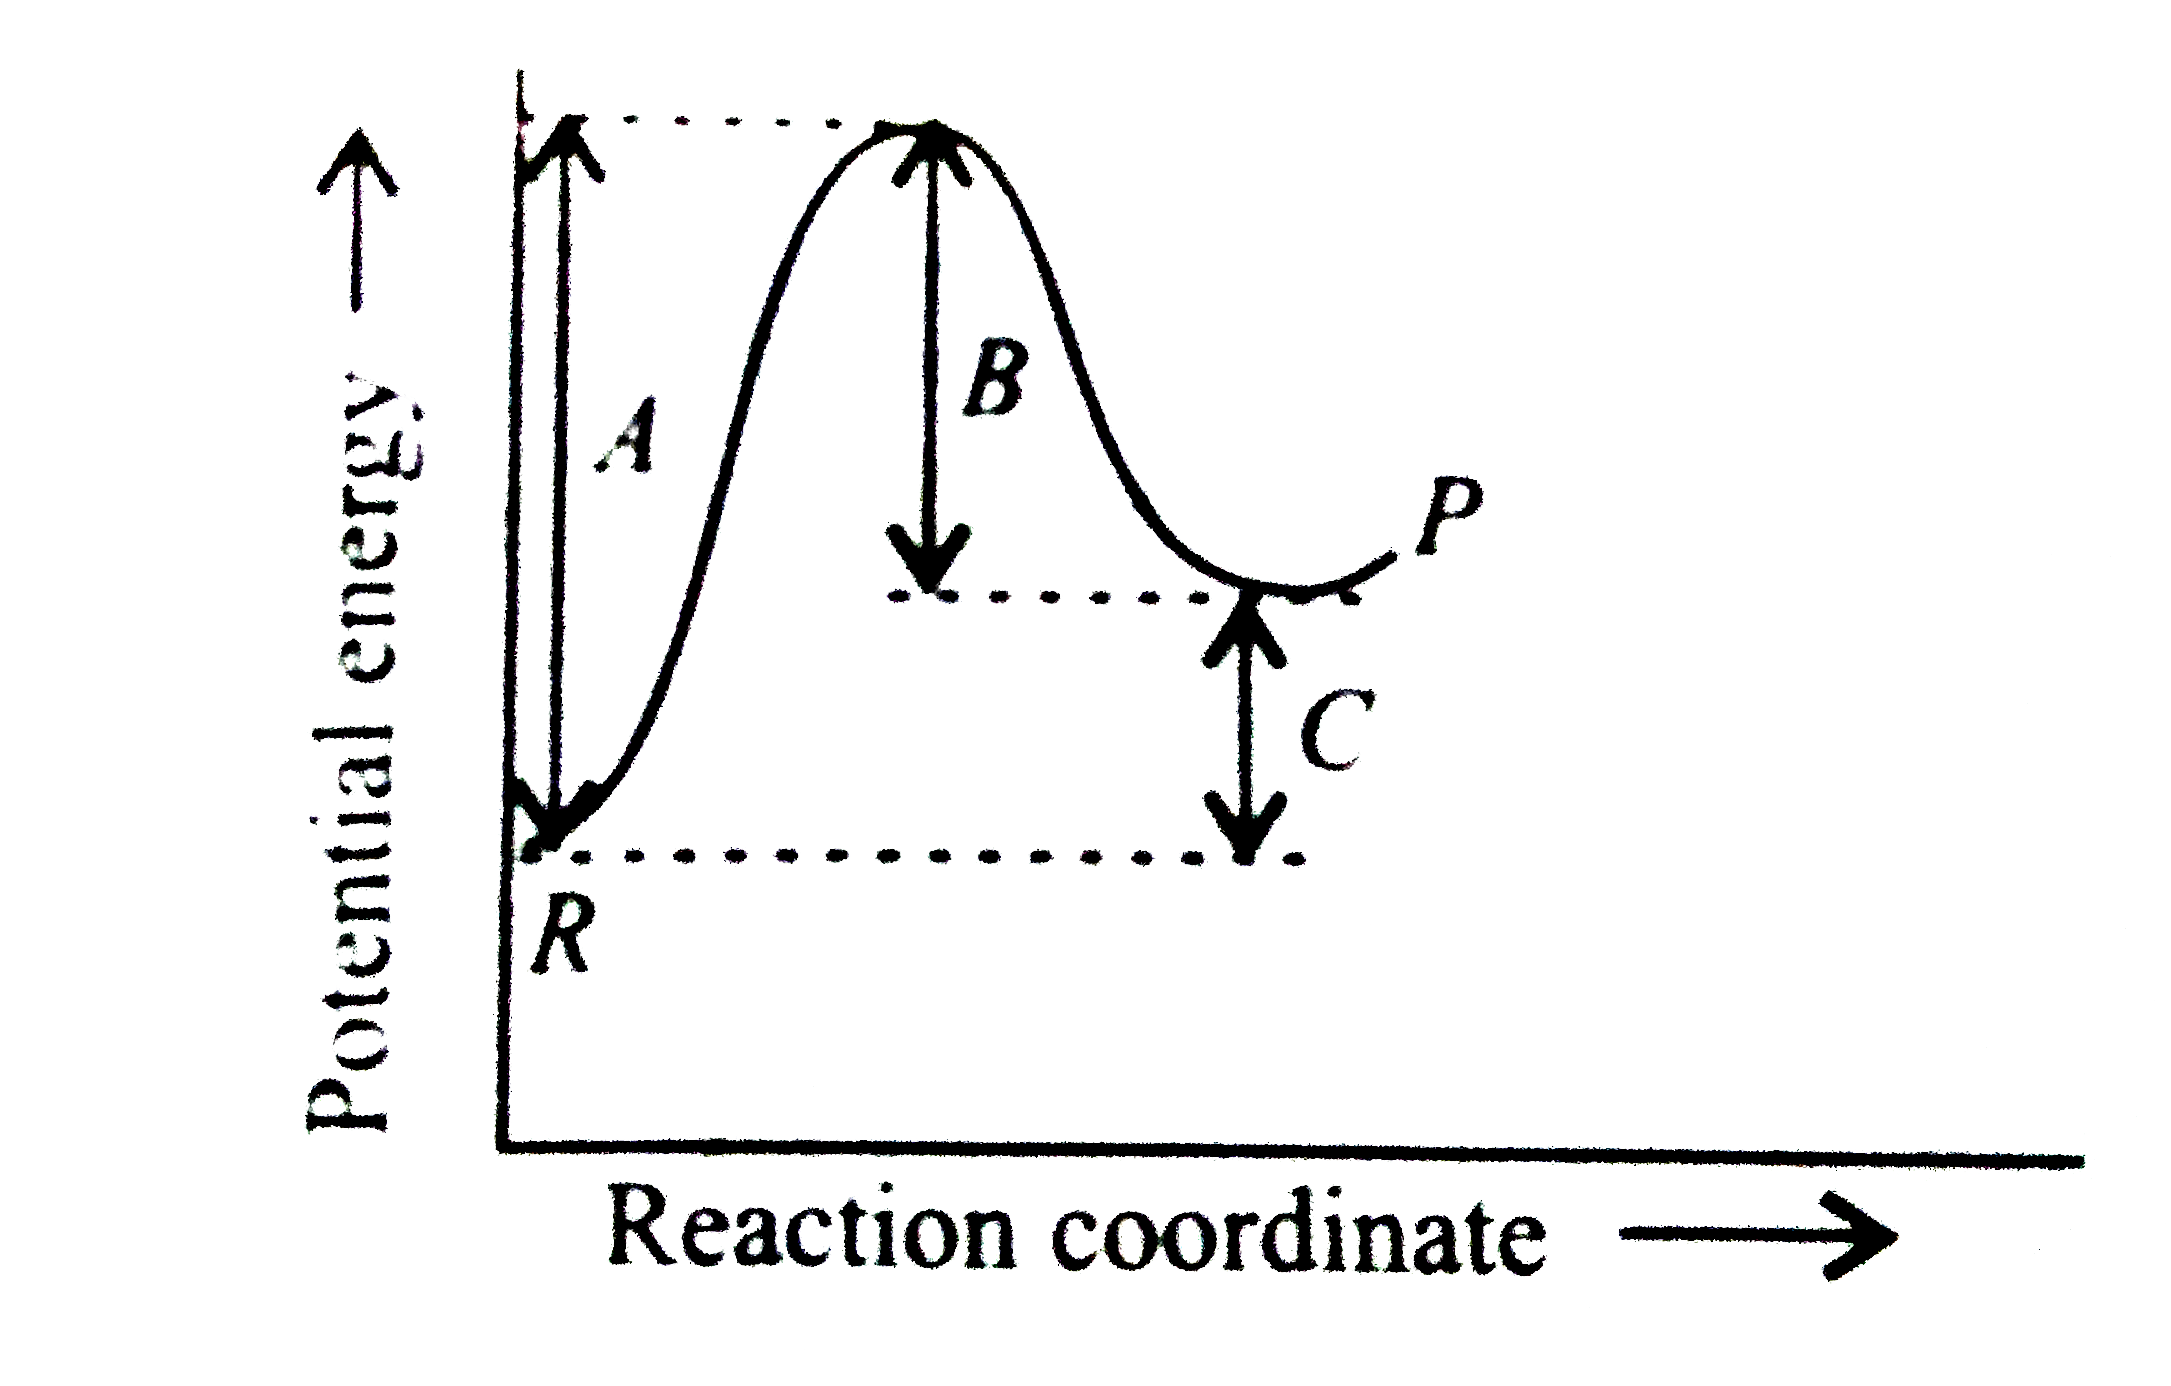
View SolutionThe potential energy diagram for a reaction X→Y is given. A and C in the graph corresponding to
View Solution
Knowledge Check
These diagrams represent the potential energy U of a diatomic molecule as a function of the inter-atomic distance r. The diagram corresponds to stable molecule found in nature is.
A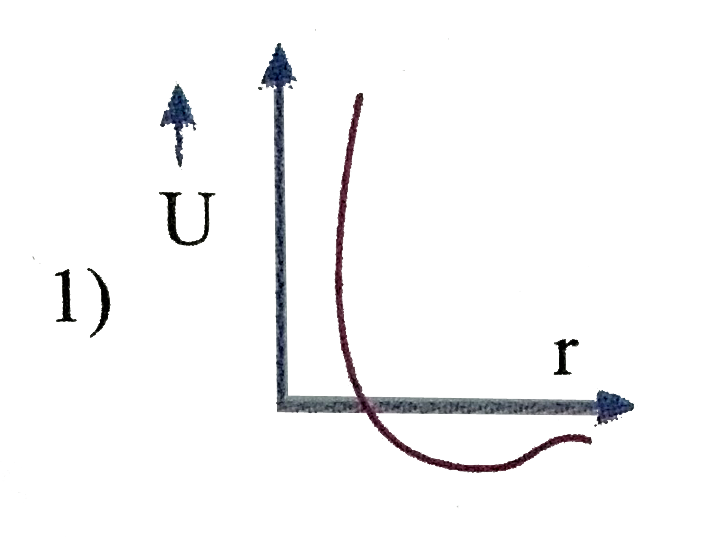 B
B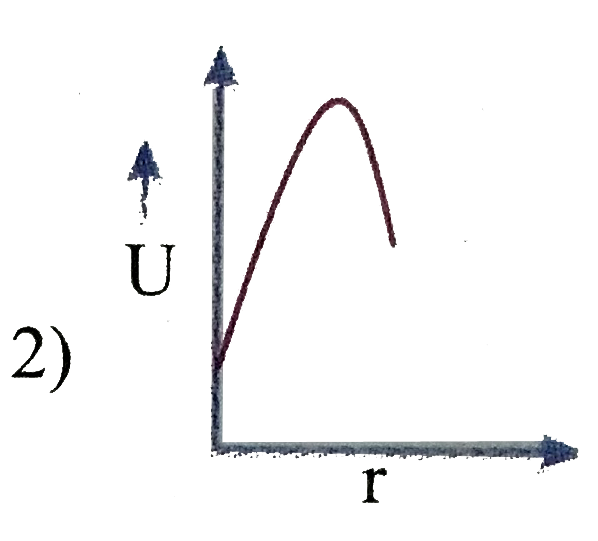 C
C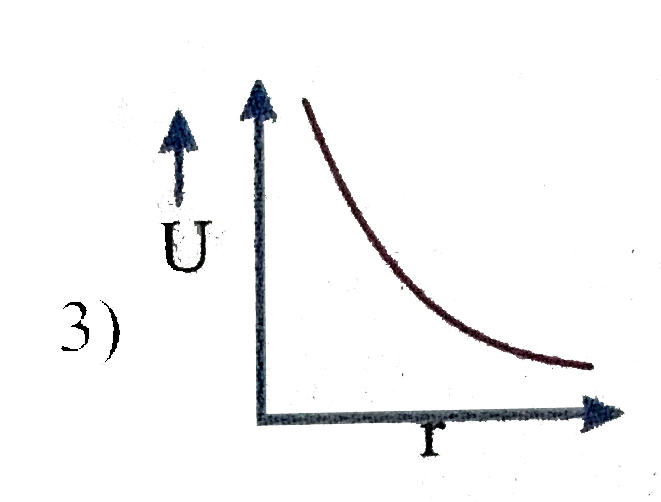 D
D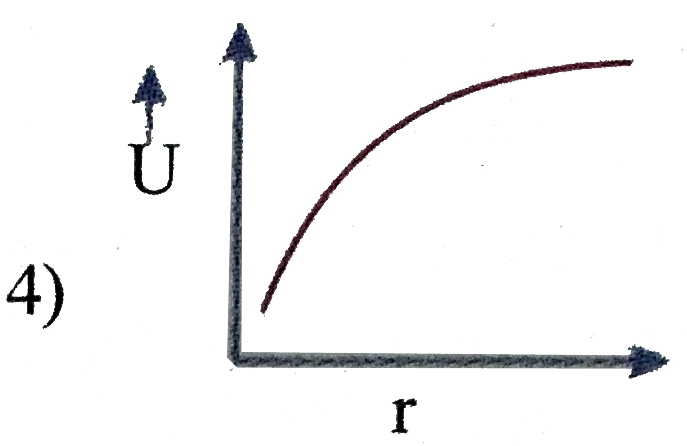
The potential energy U between two molecules as a function of the distance X between them has been shown in the figure. The two molecules are
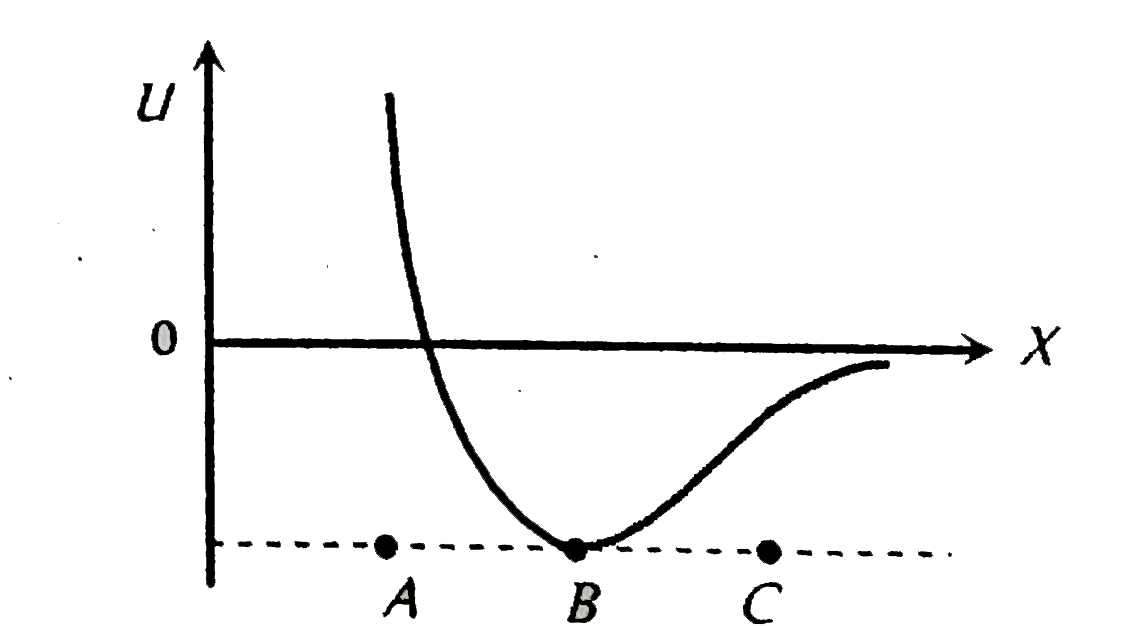 AAttracted when x lies between A and B and are repelled when X lies between B and CBAttracted when x lies between B and C and are repelled when X lies between A and BCAttracted when they reach BDRepelled when they each B
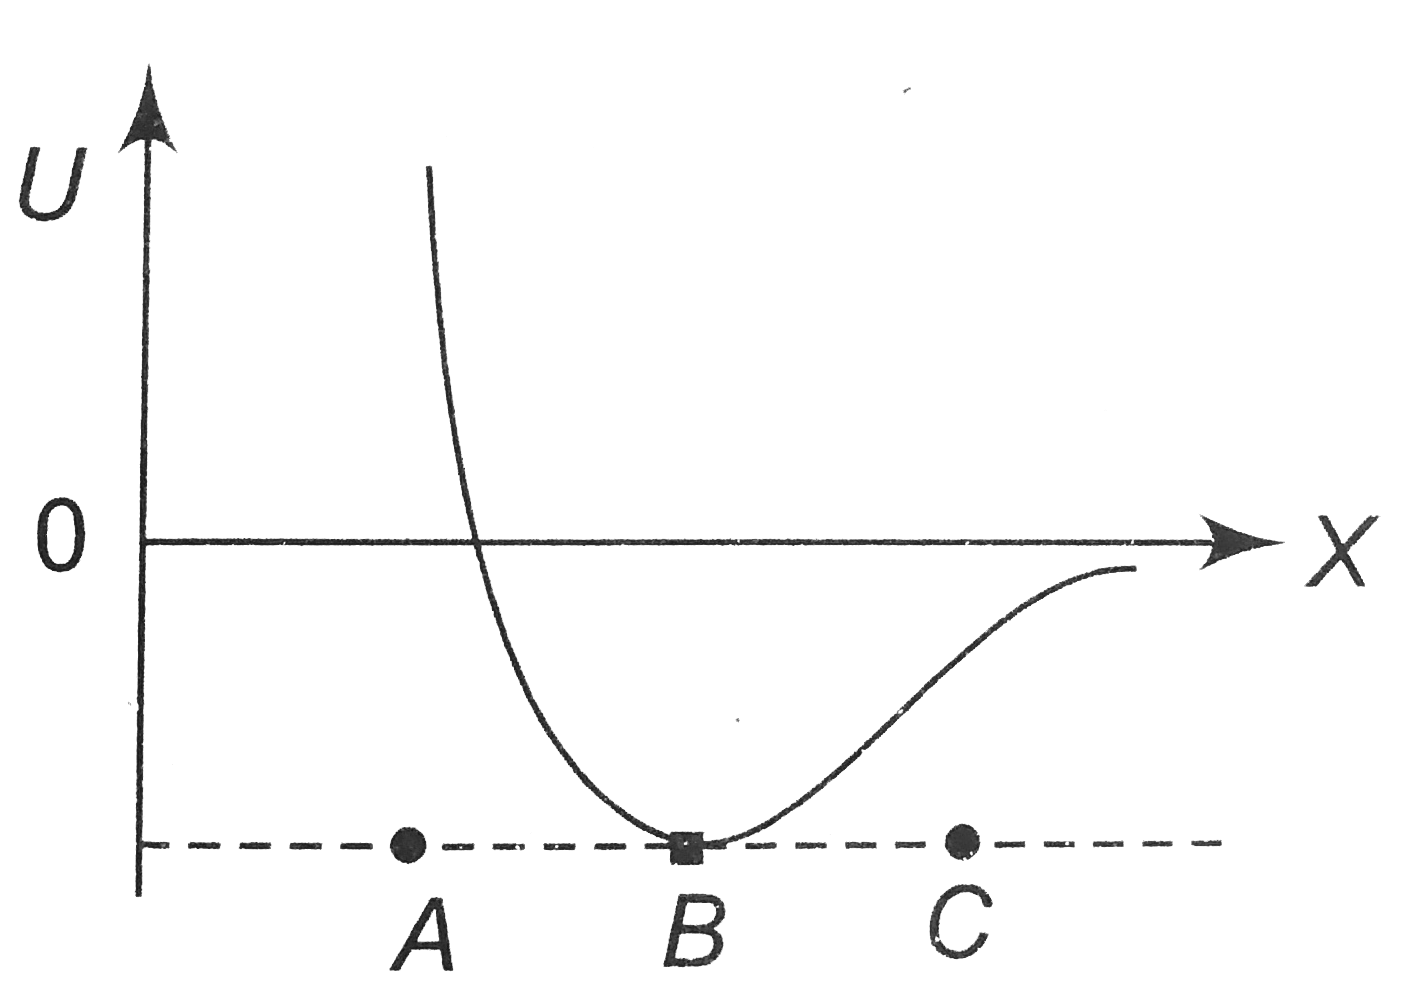
The potential energy U between two molecules as a function of the distance X between them has been shown in the figure. The two molecules areAAttracted when x lies between A and B and are repelled when X lies between B and CBAttracted when x lies between B and C and are repelled when X lies between A and BCAttracted when they reach BDRepelled when they reach B
The potential energy diagram for a reaction X→Y is given. A and C in the graph corresponding to

View SolutionThe potential energy curve for the H2 molecule as a function of internuclear distance is :
View SolutionThe potential energy curve for the H2 molecule as a function of internuclear distance is :
View Solution
The potential energy U between two molecules as a function of the distance X between them has been shown in the figure. The two molecules are
View Solution
The potential energy U between two molecules as a function of the distance X between them has been shown in the figure. The two molecules are
View Solution
