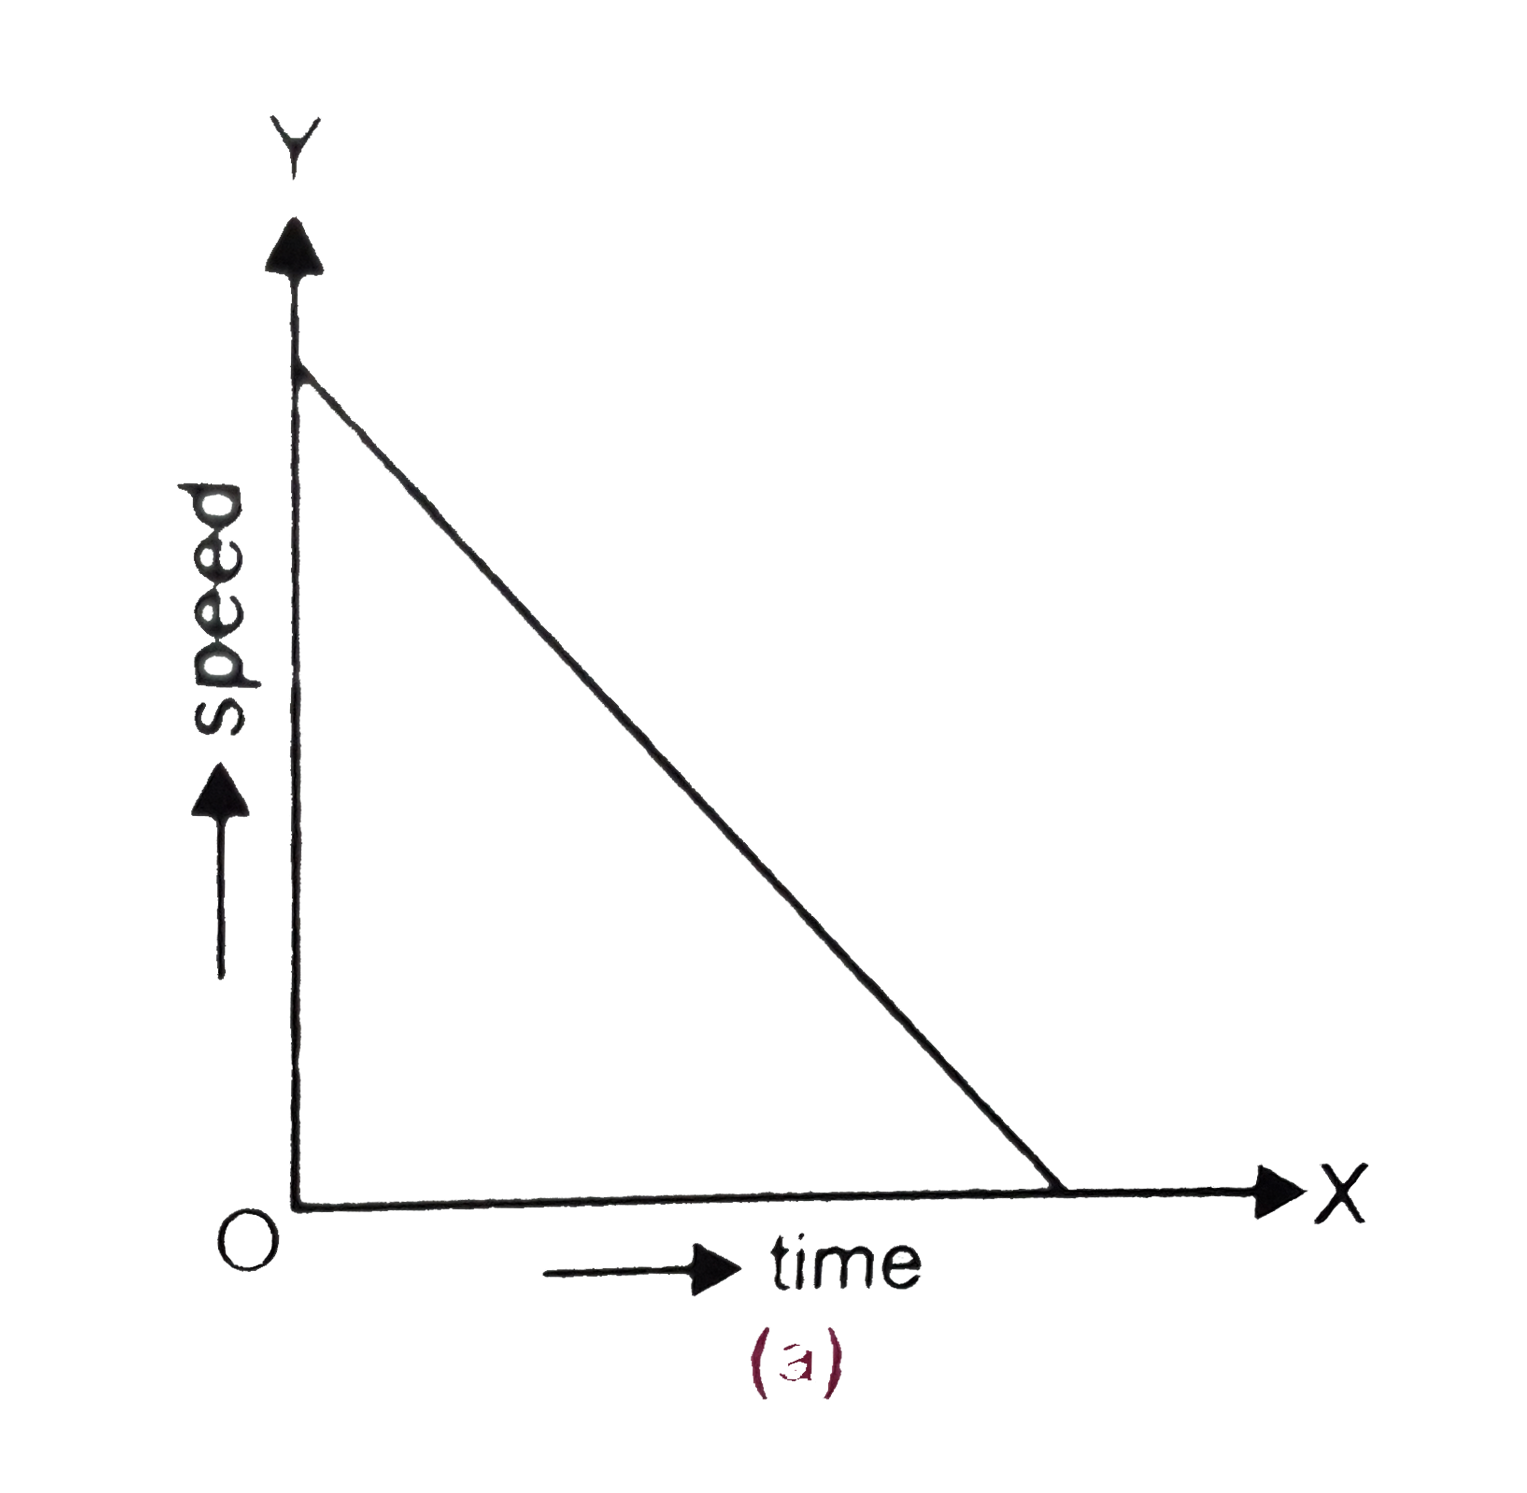
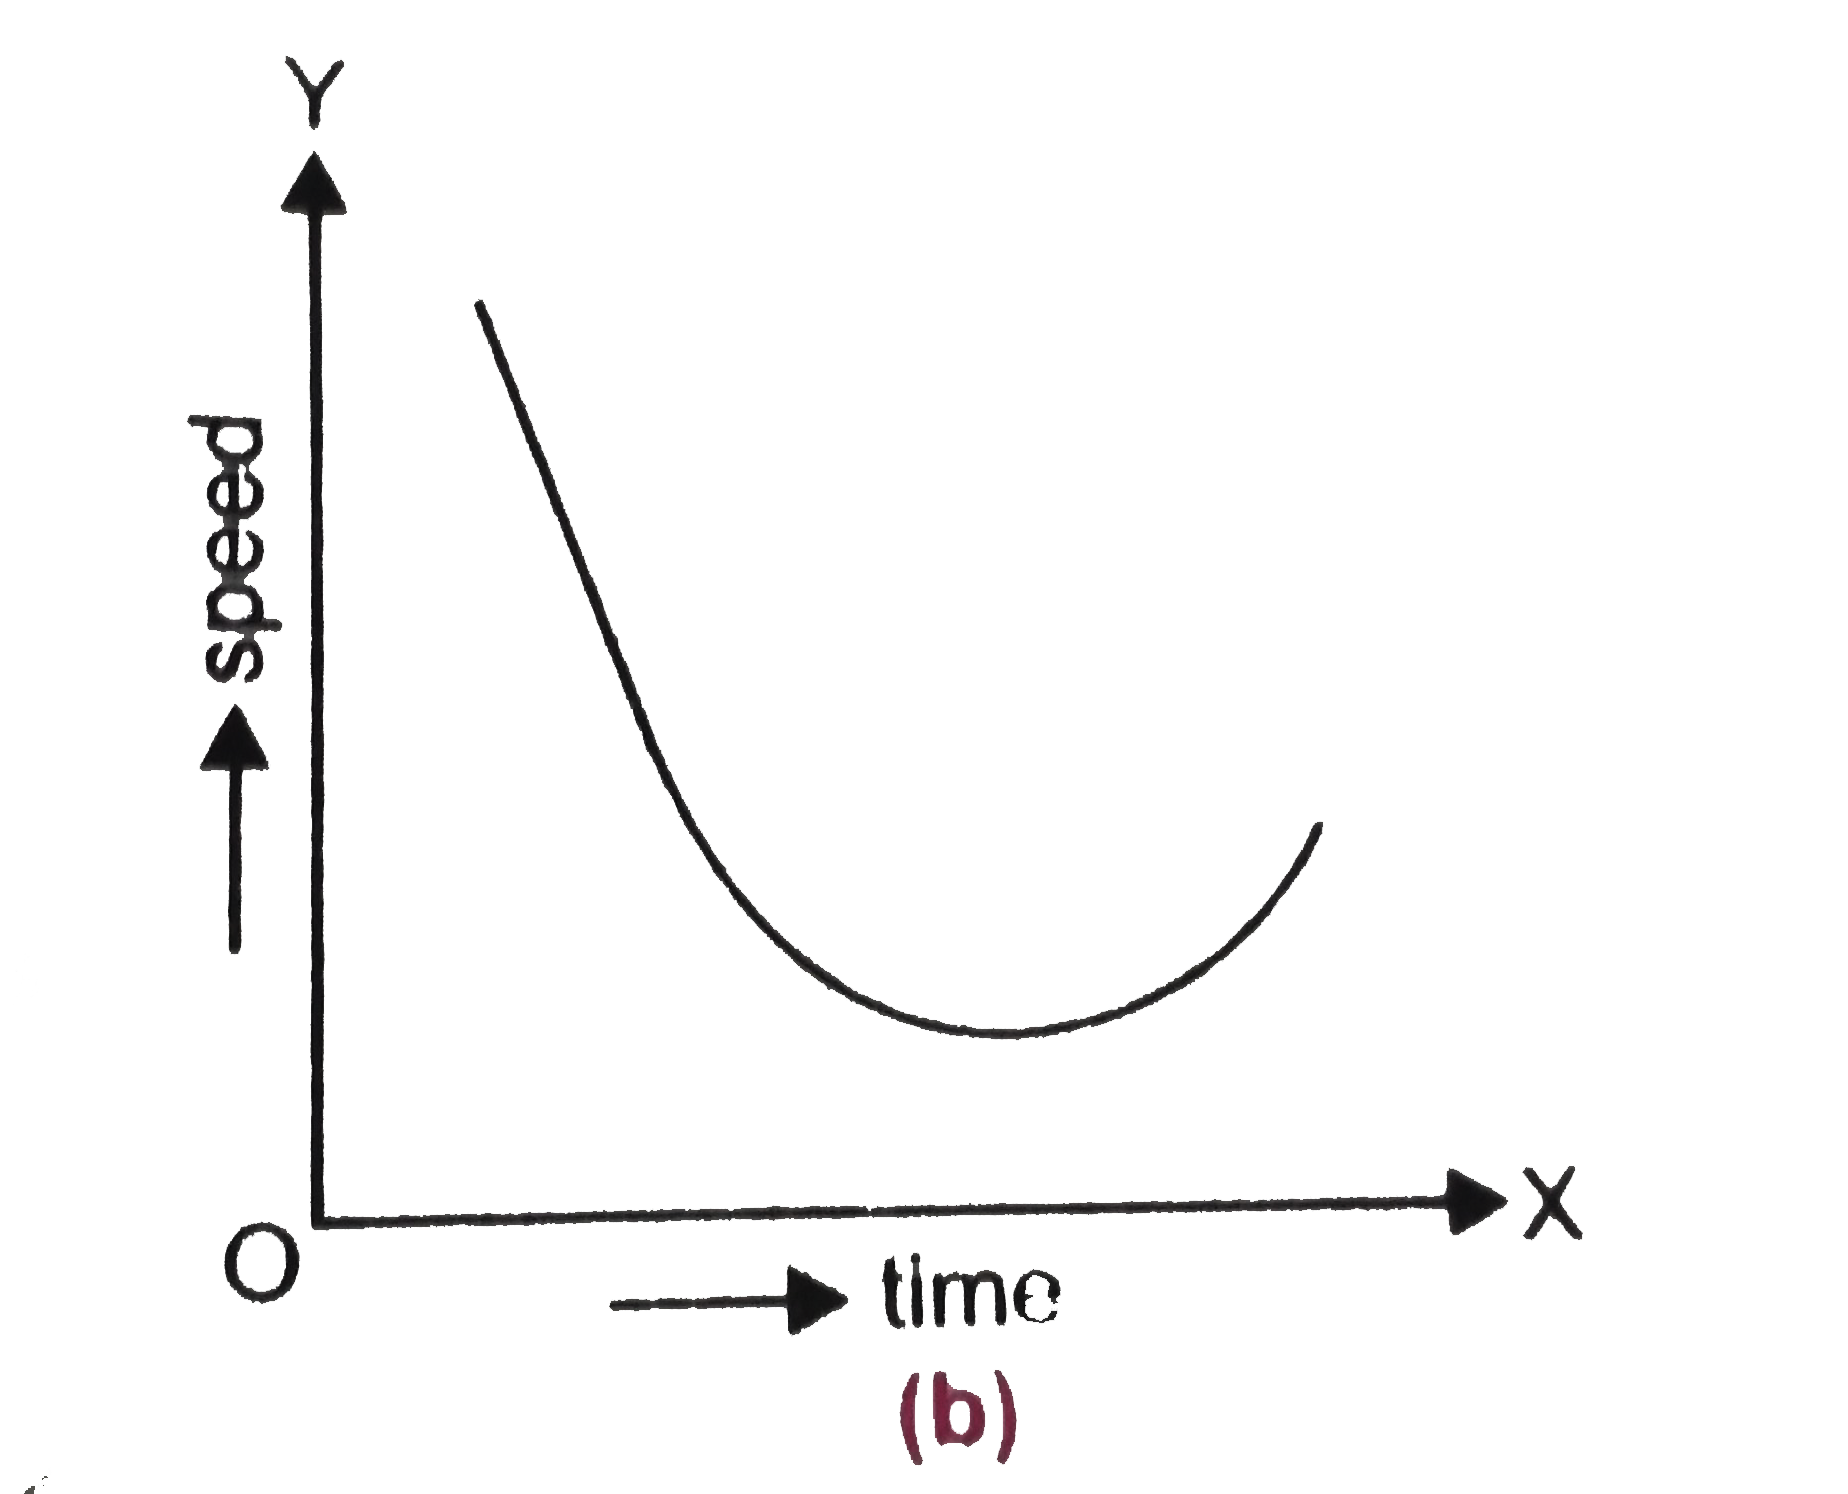
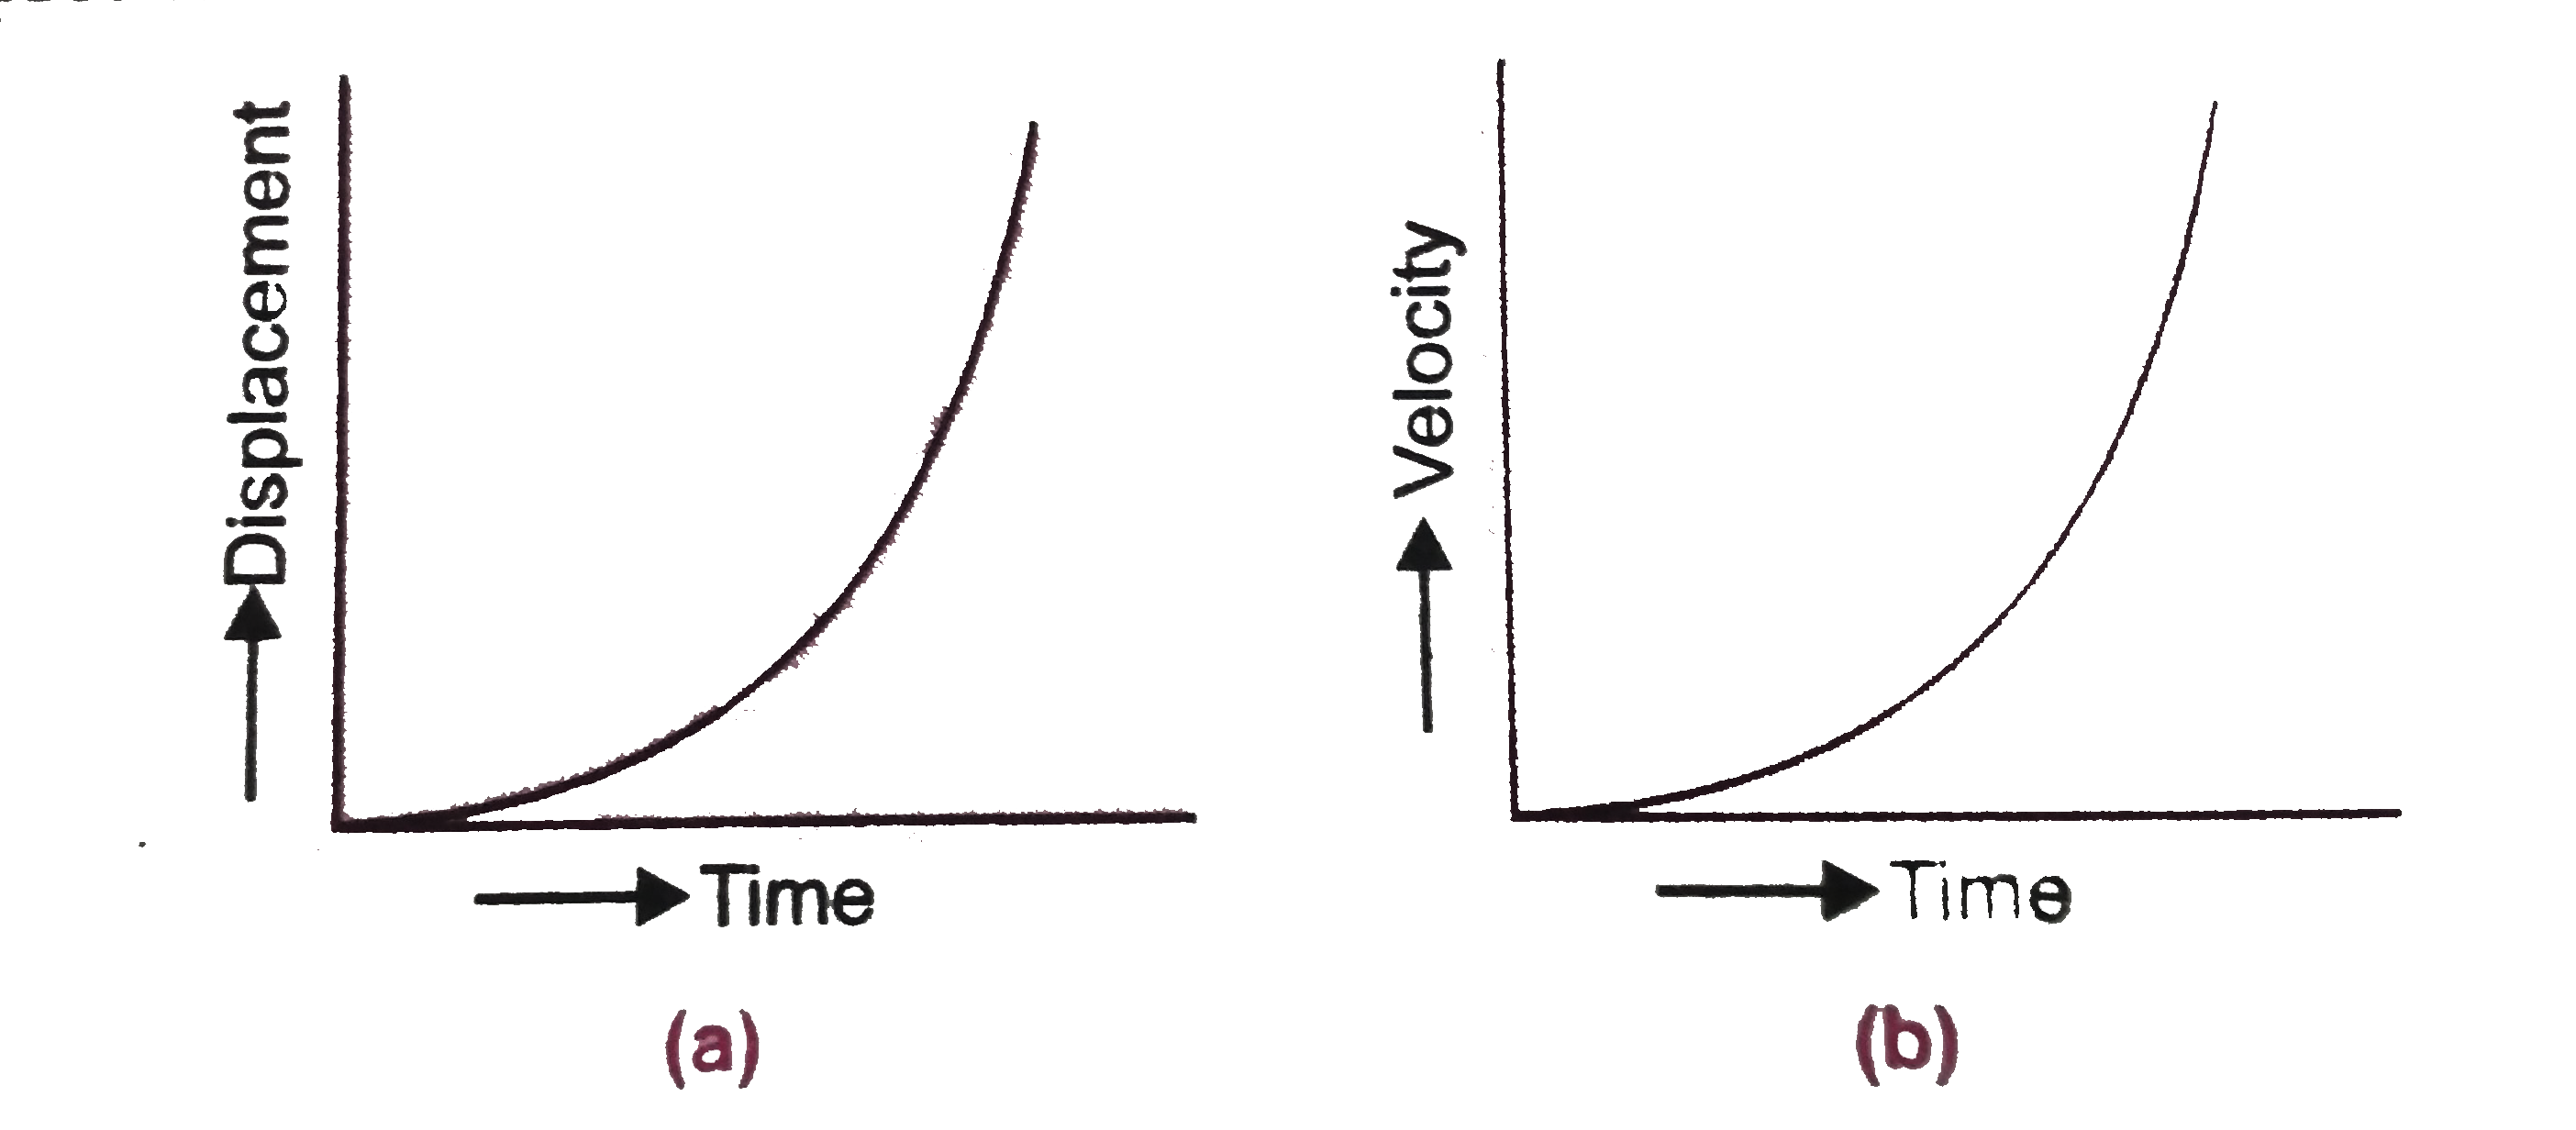
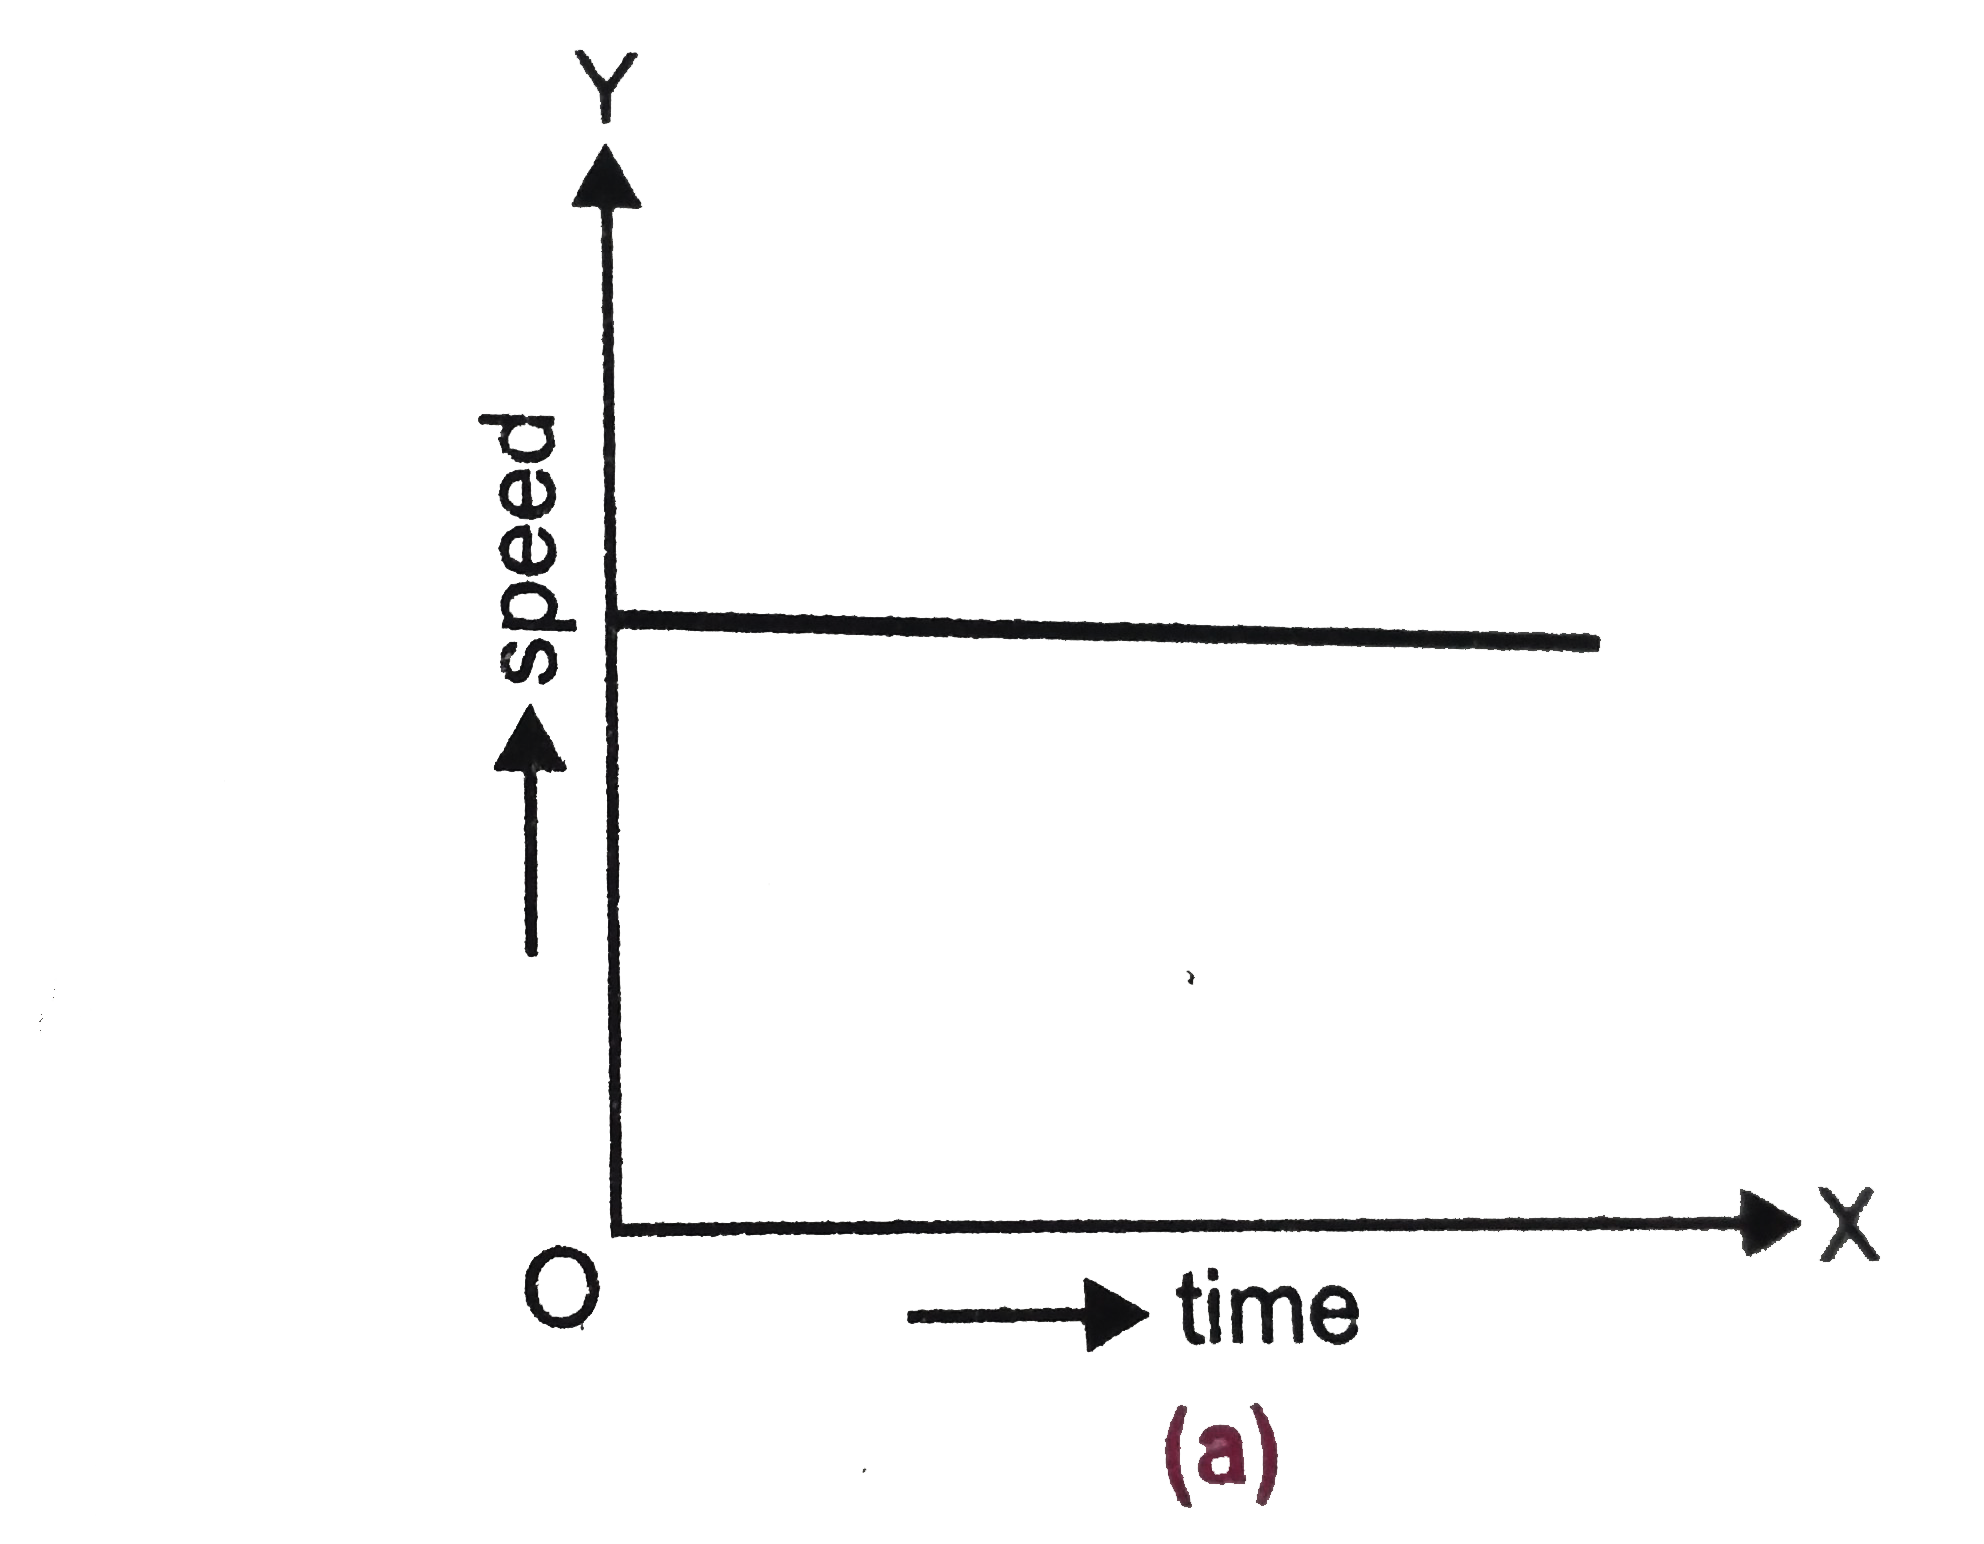
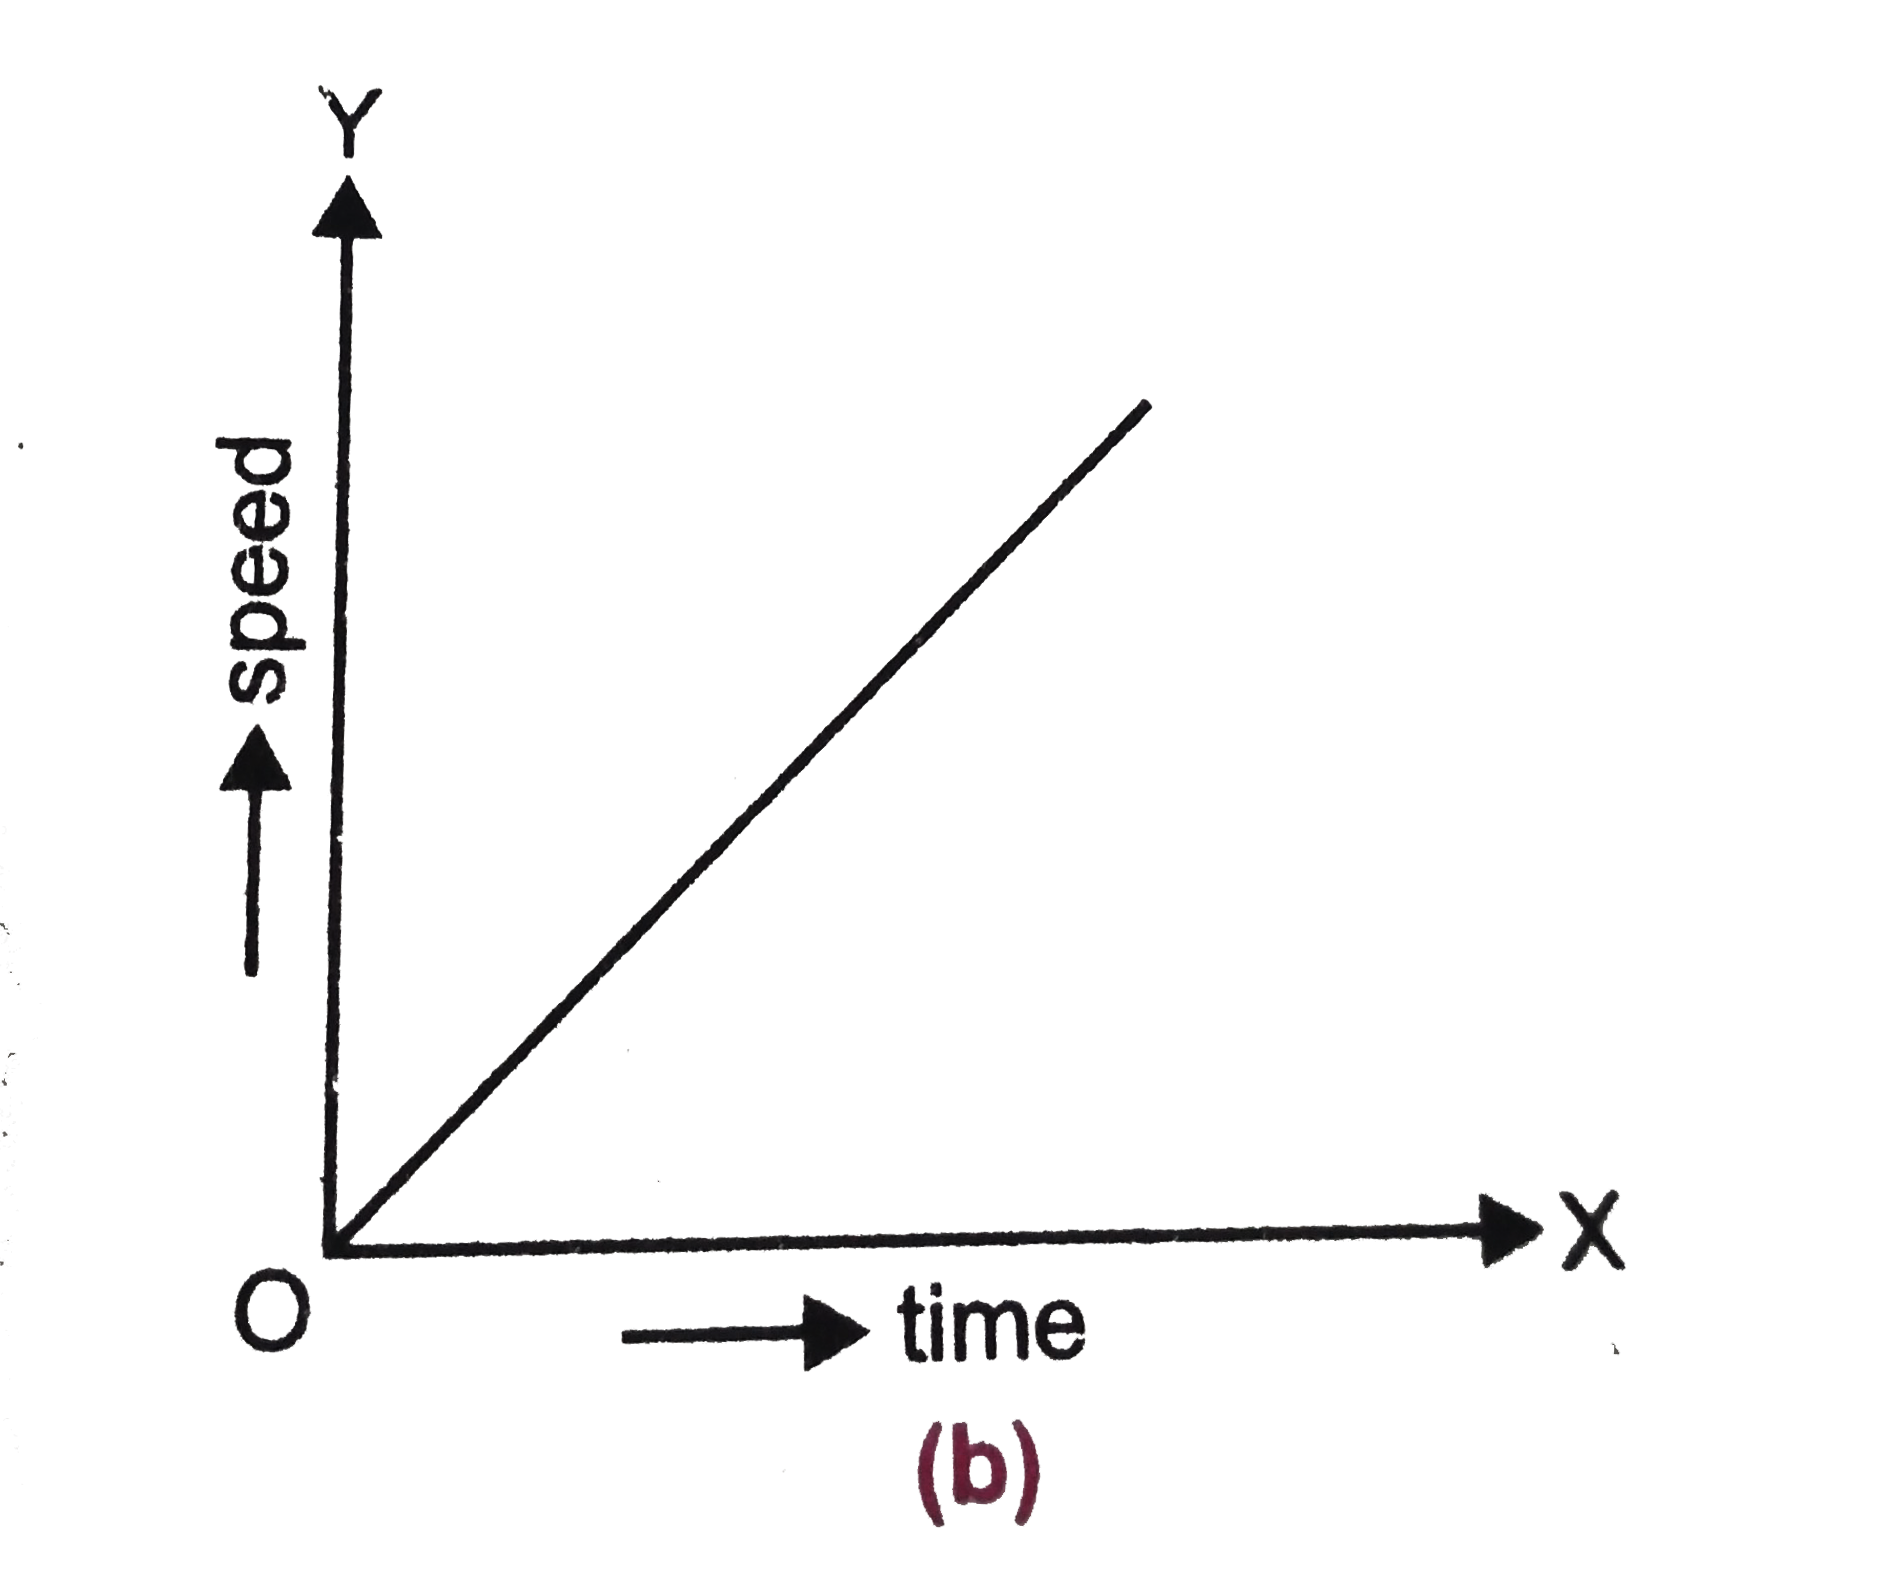
What do the graph shown in Figure indicate ?
Video Solution
Text Solution
Graph (a) shows uniform retardation, i.e., decrease in speed of the body at a constant rate. Graph (b) shows non-uniform retardation first and then non-uniform acceleration.
|
Topper's Solved these Questions
- MOTIONBook:PRADEEPChapter:MOTIONExercise:Short answer questions
Explore 9 Videos
- MOTIONBook:PRADEEPChapter:MOTIONExercise:Higher order thinking skills
Explore 6 Videos
- MOTIONBook:PRADEEPChapter:MOTIONExercise:very short answer queation
Explore 25 Videos
- GRAVITATIONBook:PRADEEPChapter:GRAVITATIONExercise:Model Test paper (1)
Explore 36 Videos
- SOUNDBook:PRADEEPChapter:SOUNDExercise:Model Test (sec - B)
Explore 12 Videos
Similar Questions
Knowledge Check
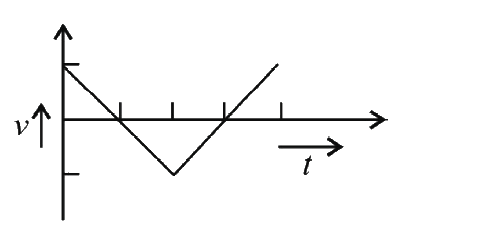
The graph in figure shows the velocity v versus time t for a body. Which of the graphs shown in figure represents the corresponding acceleration versus time graphs ?
 A
A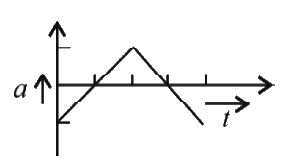 B
B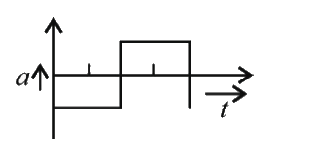 C
C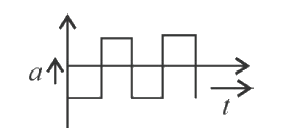 D
D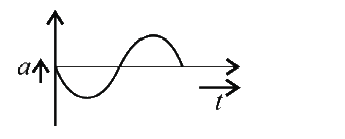
For the graph shown in figure -4.17, which of the following statement is/are possible?
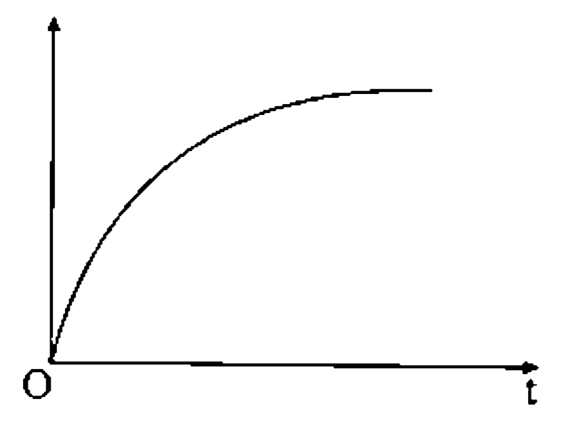 Ay-axis shows number of nuclei of a radioactive element which is produced at a constant rateBy-axis represents number of nuclei decayed in a radio nuclideCy-axis represents activity of a radio nuclideDnone of these
If a graph is plotted between 1/v and 1/u , which one of the graph shown in figure is approximately correct ?
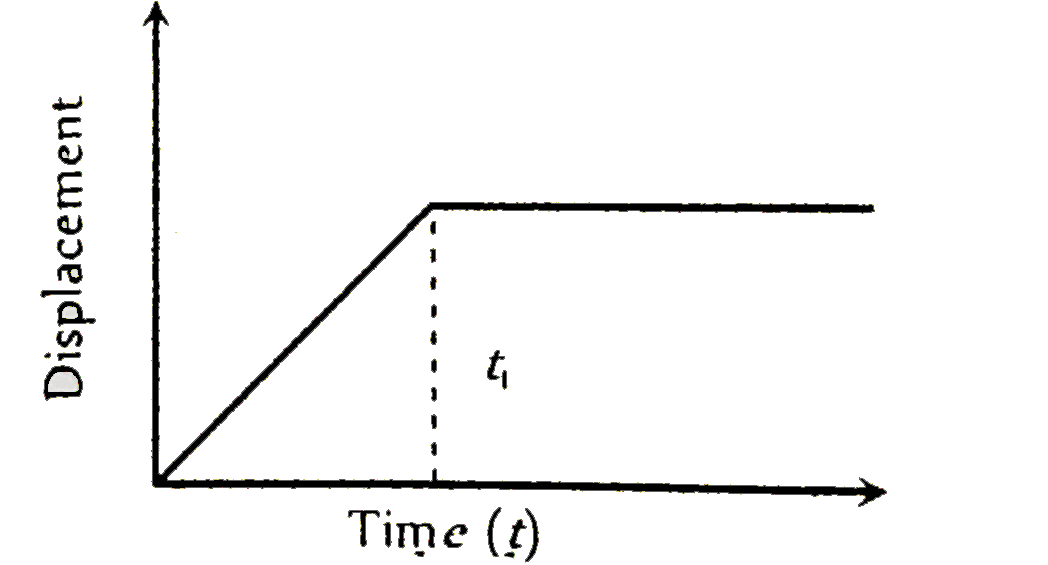
View SolutionThe x -t graph shown in figure represents
View SolutionWhat do the morphological evidences indicate?
View SolutionHow do you interpret the two graphs shwon in Figure ?
View SolutionThe graph shown in figure is exponential. Write down the equation corresponding to the graph.
View SolutionWhat is represented by the graph in Figure ?
View Solution

