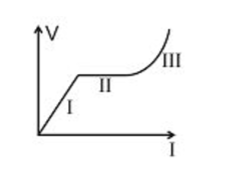
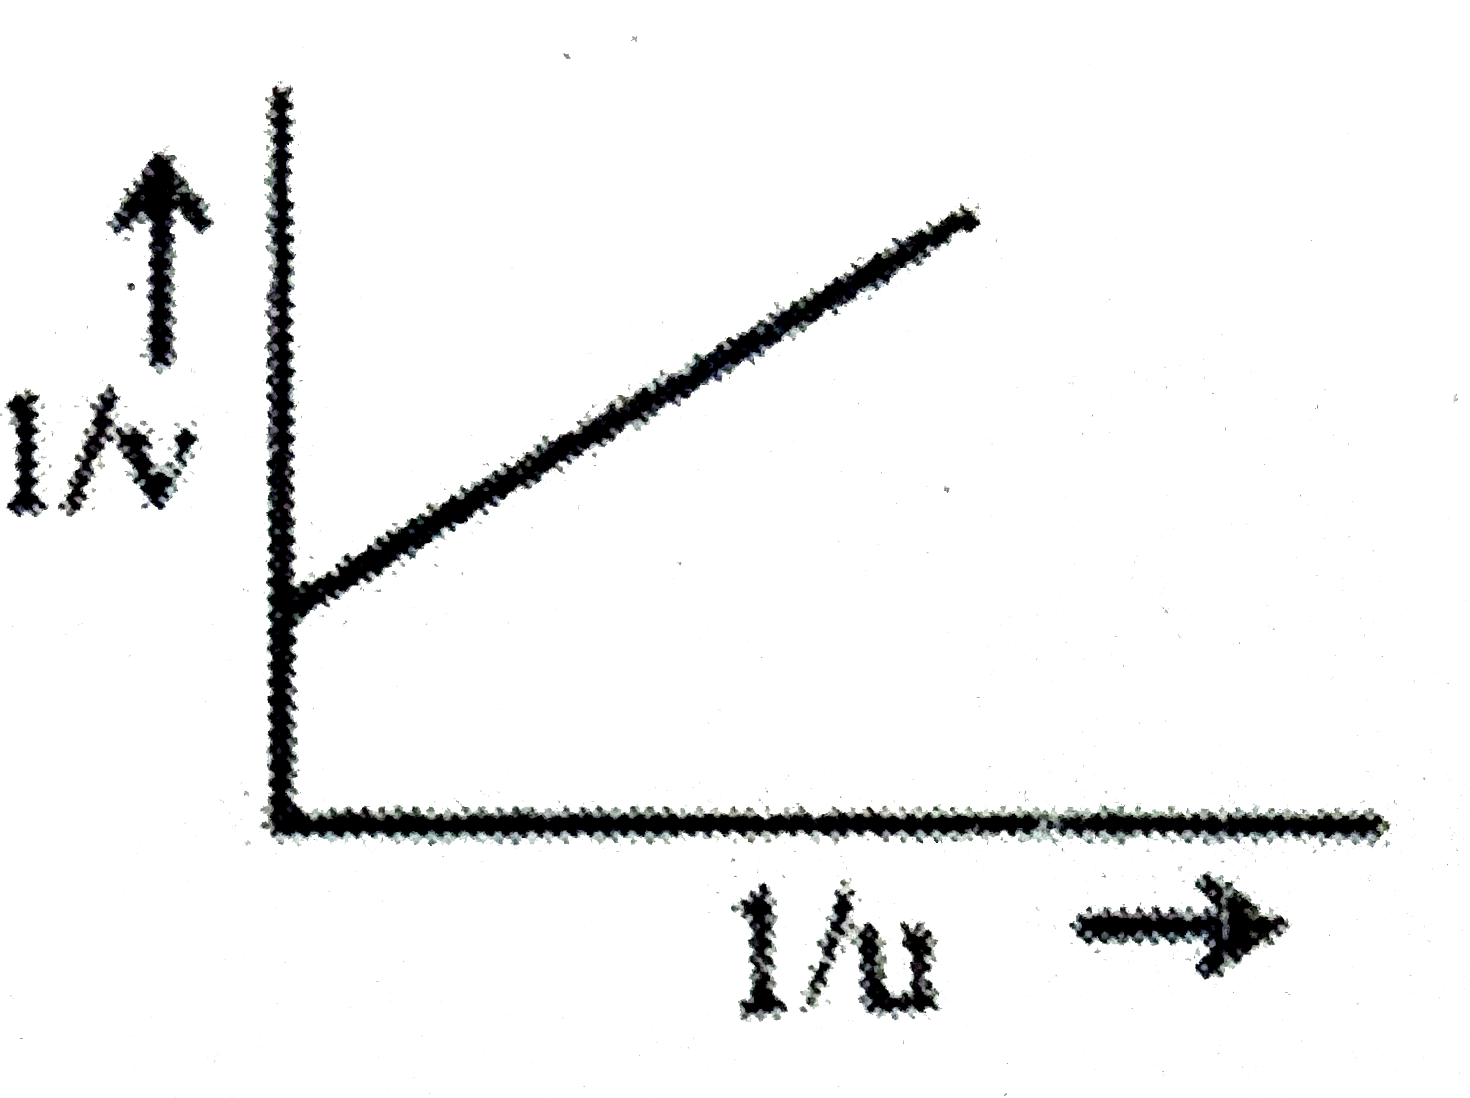
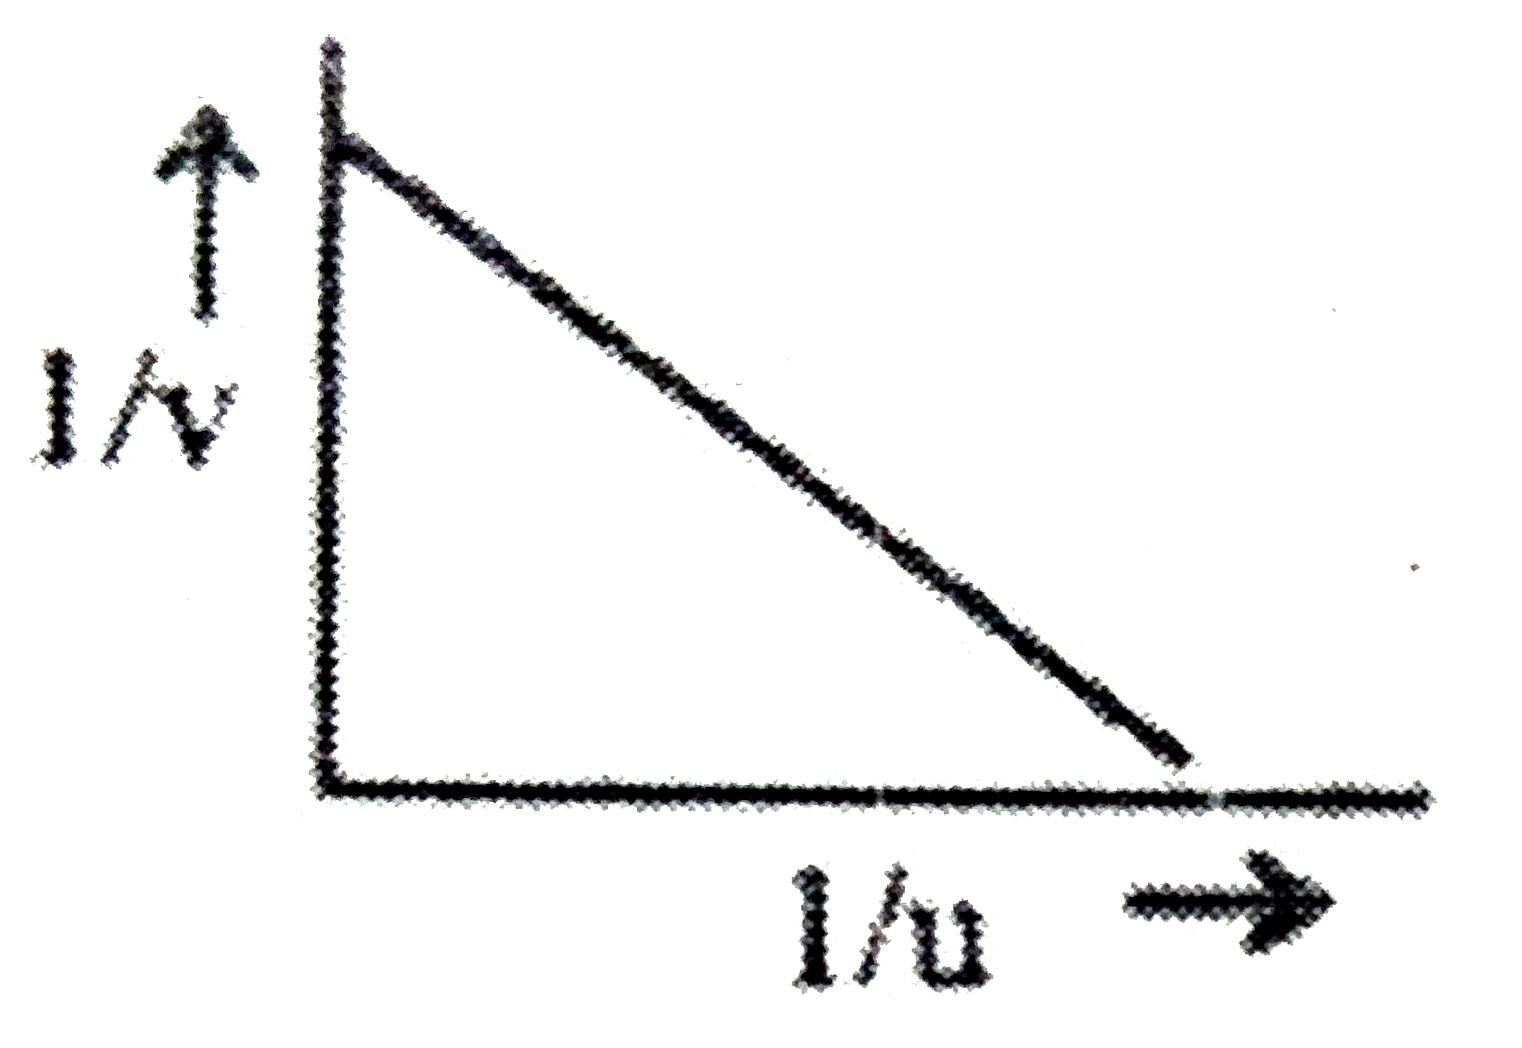
If a graph is plotted between 1/v and 1/u , which one of the graph shown in figure is approximately correct ?
A
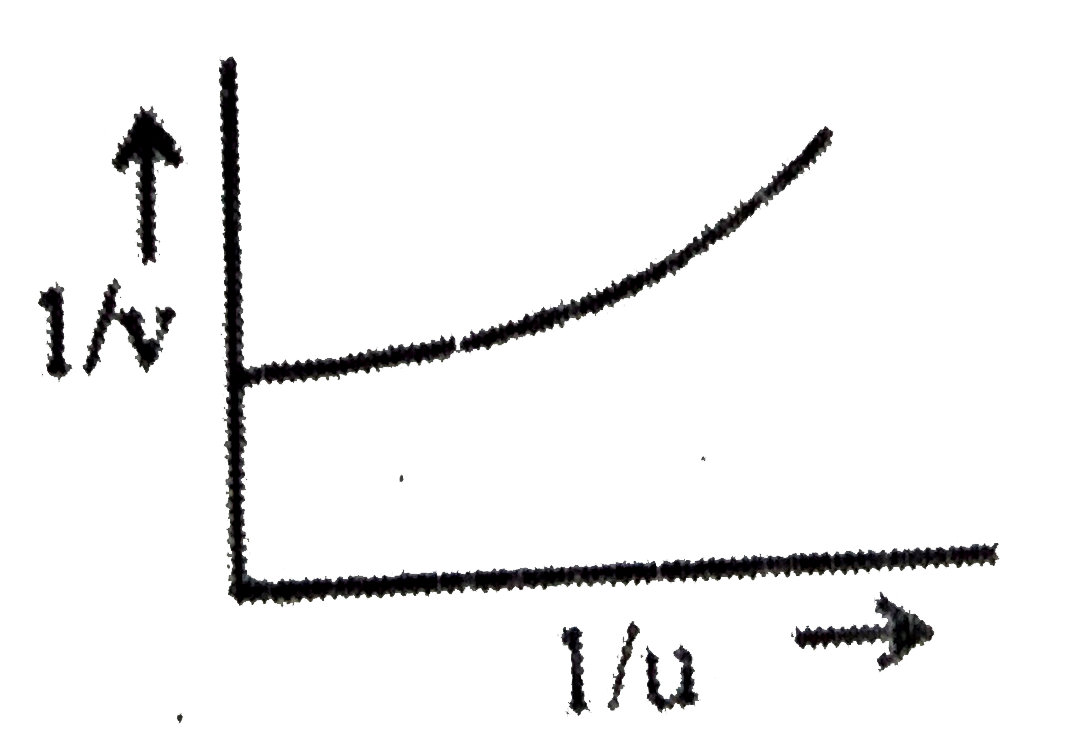
B
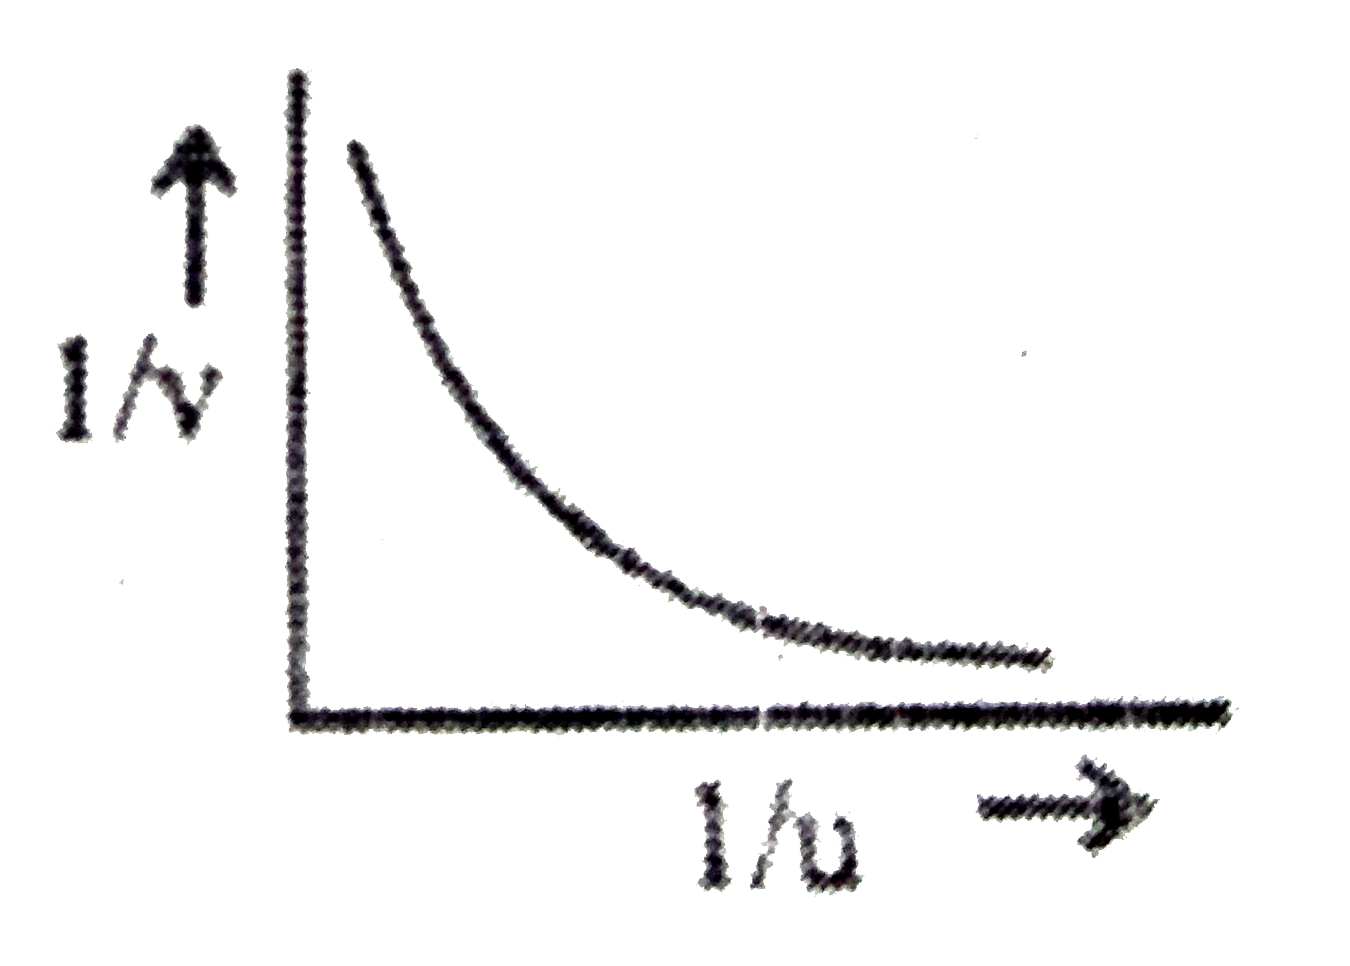
C
D
Video Solution
|
Answer
Step by step video & image solution for If a graph is plotted between 1/v and 1/u , which one of the graph shown in figure is approximately correct ? by Physics experts to help you in doubts & scoring excellent marks in Class 12 exams.
Updated on:21/07/2023Topper's Solved these Questions
Similar Questions
Knowledge Check
The distance v of the real image formed by a convex lens is measured for various object distance u . A graph is plotted between v and u , which one of the following graphs is correct
A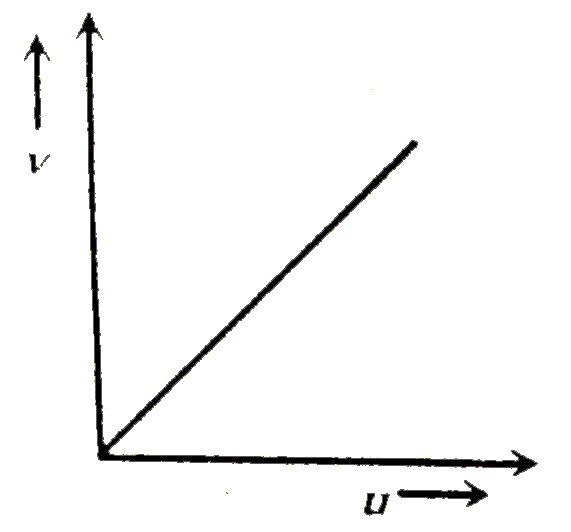 B
B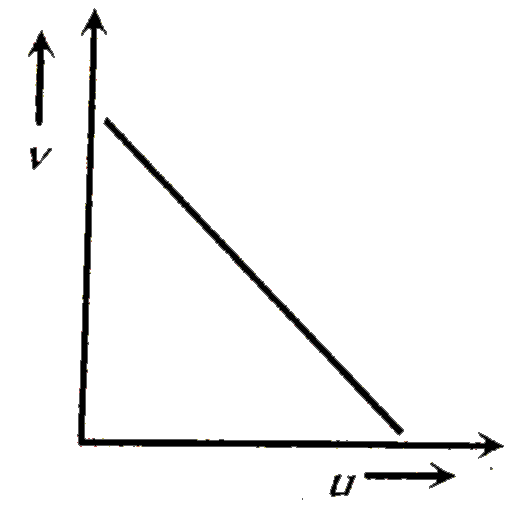 C
C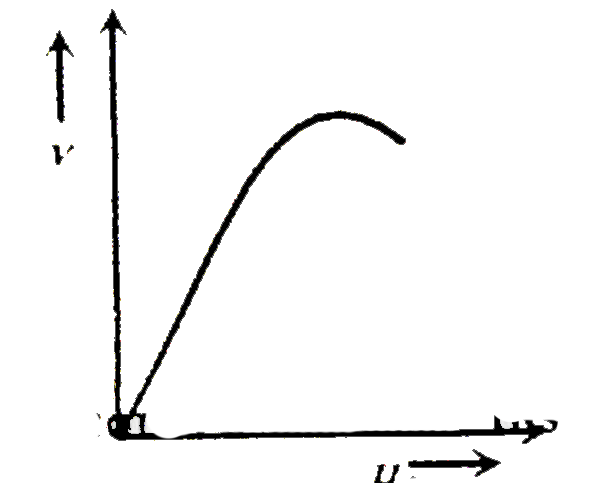 D
D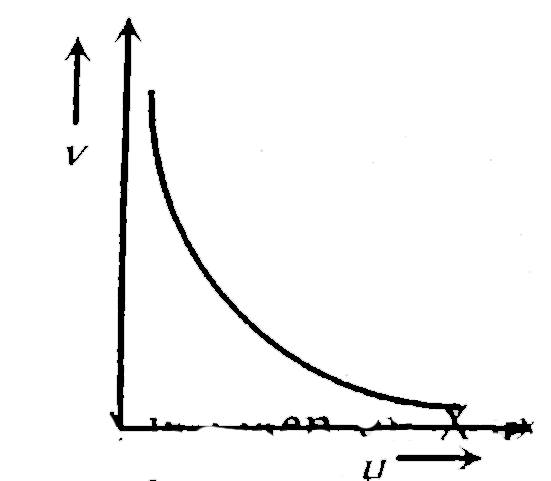
The distance v of the real image formed by a convex lens is measured for various object distance u. A graph is poltted between v and u, which one of the following graphs is correct
A B
B C
C D
D
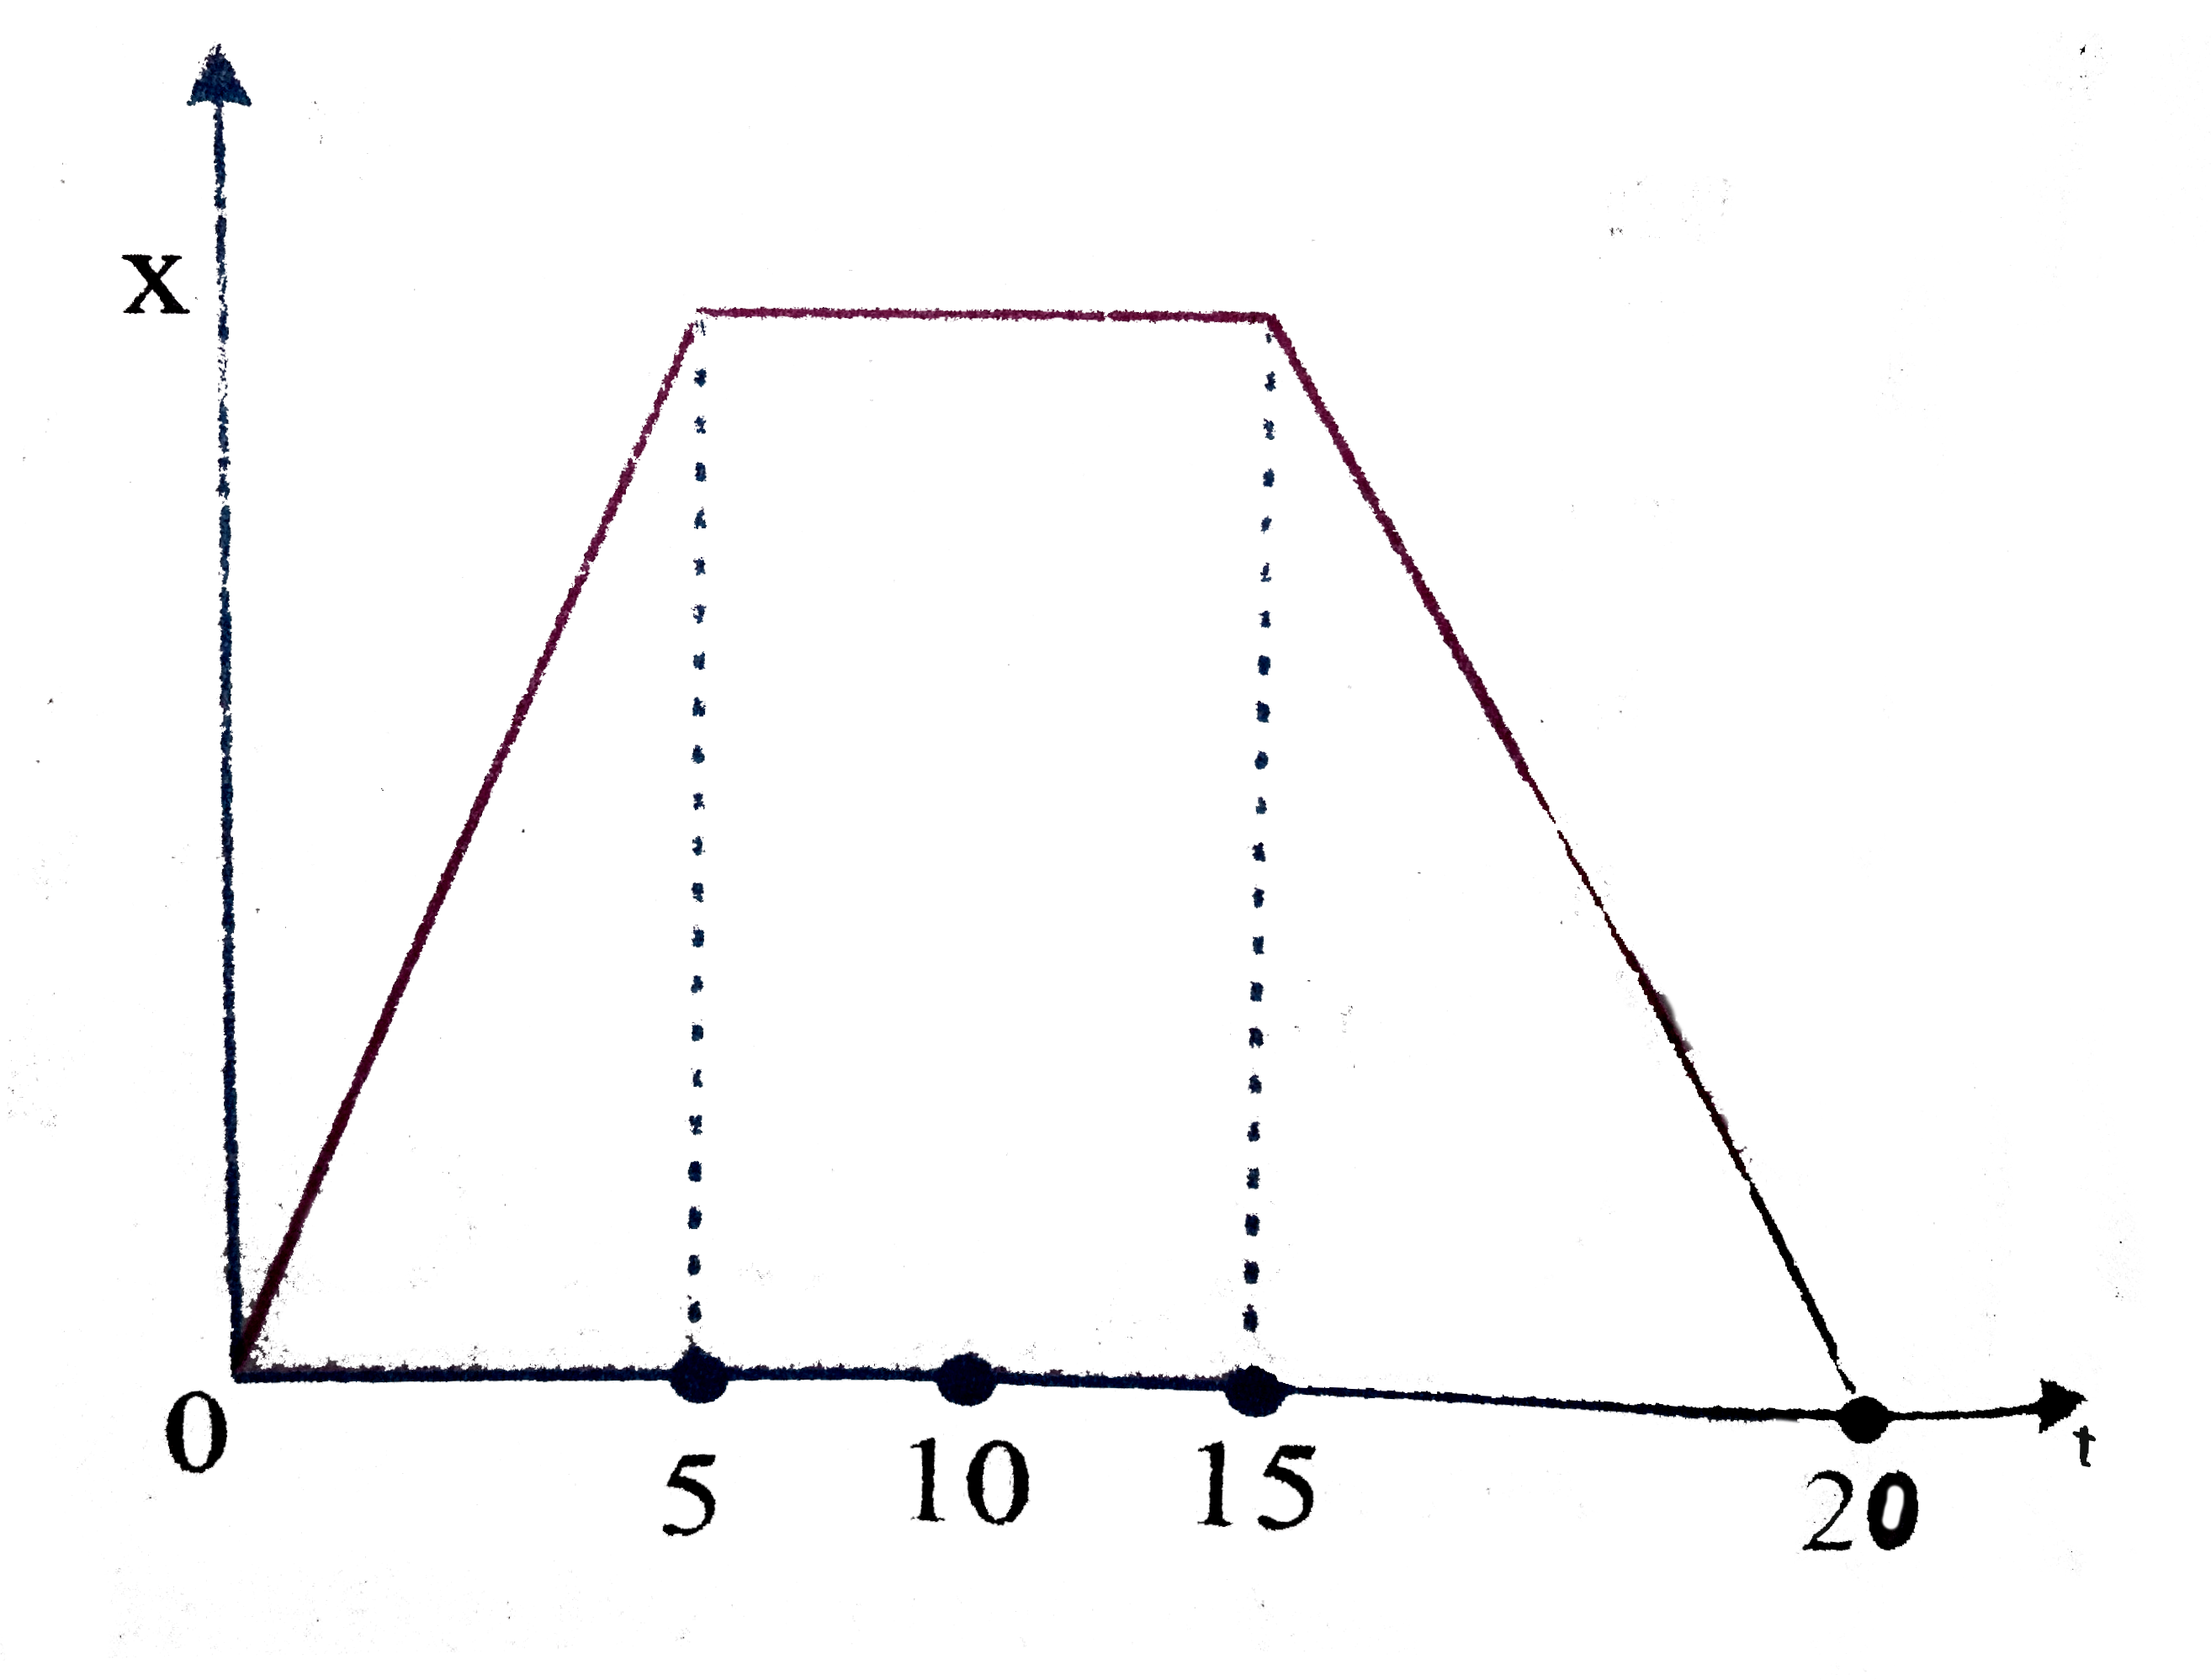
Figure shows the displacement tiime (x-t) graph of a body moving in a straight line which one of the graph shown in figure represents the velocity- time (v-t) graph of the motion of the body.A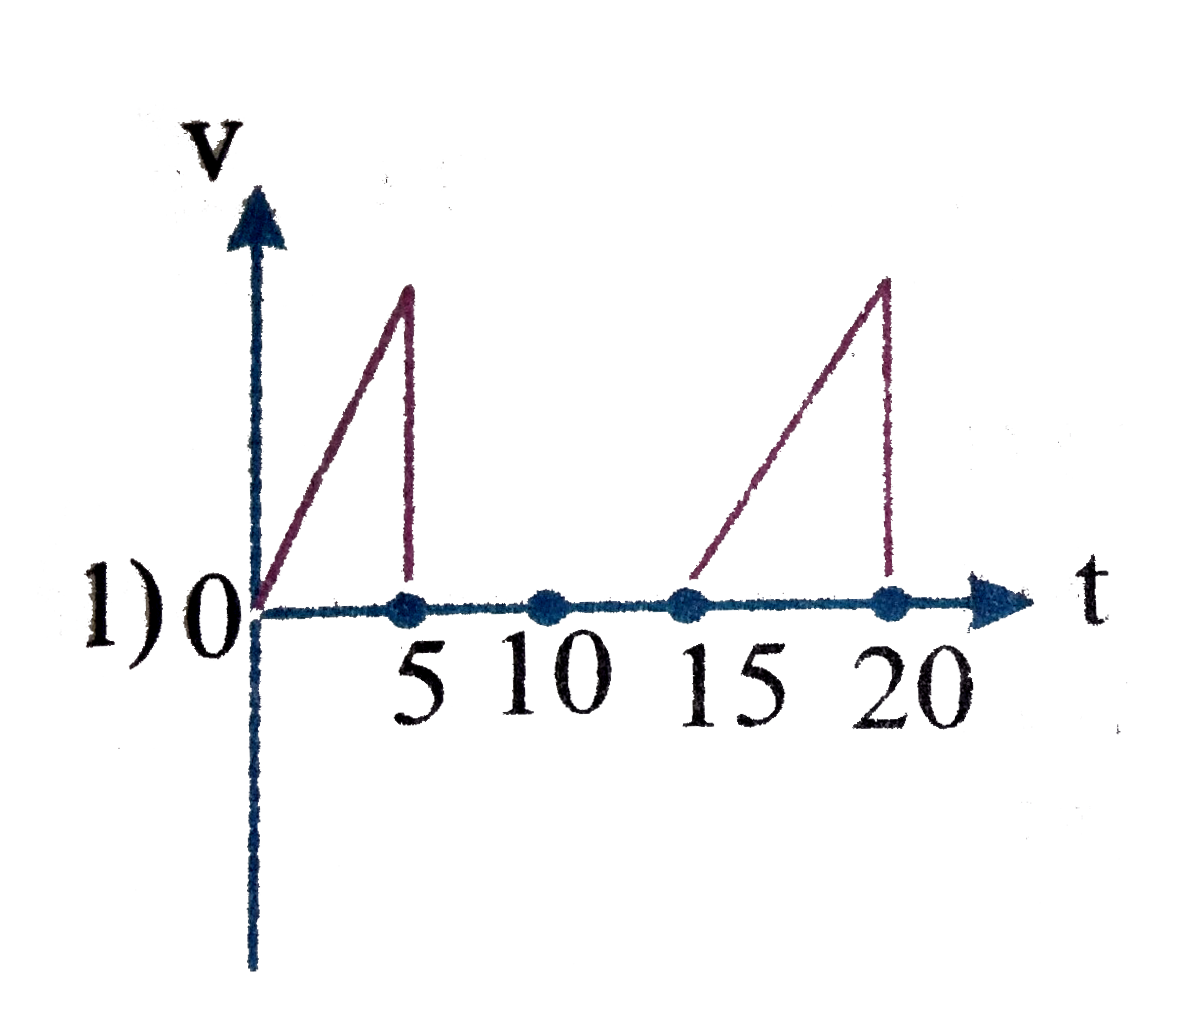 B
B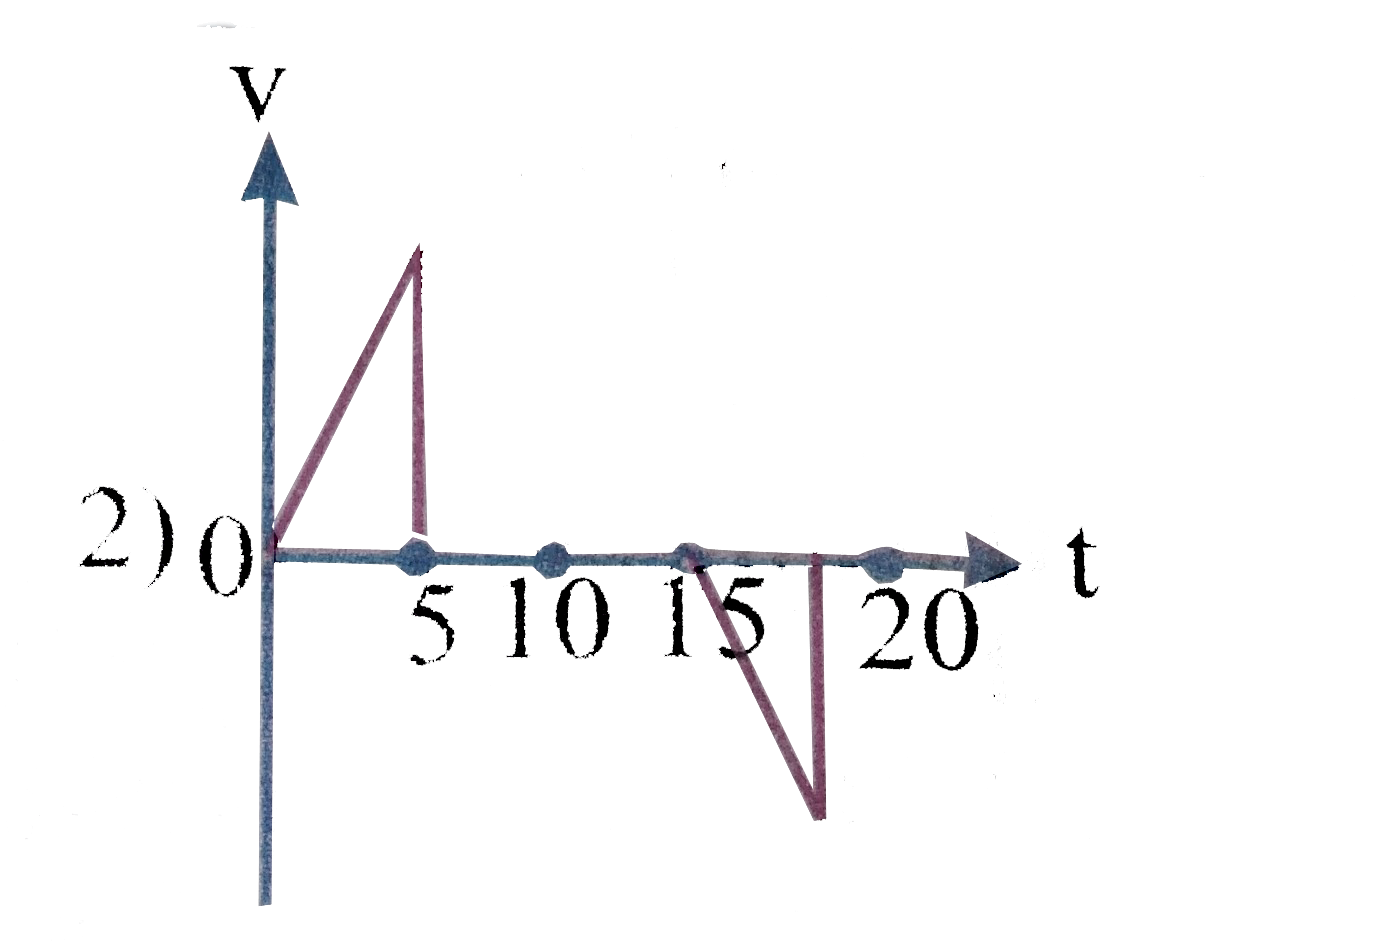 C
C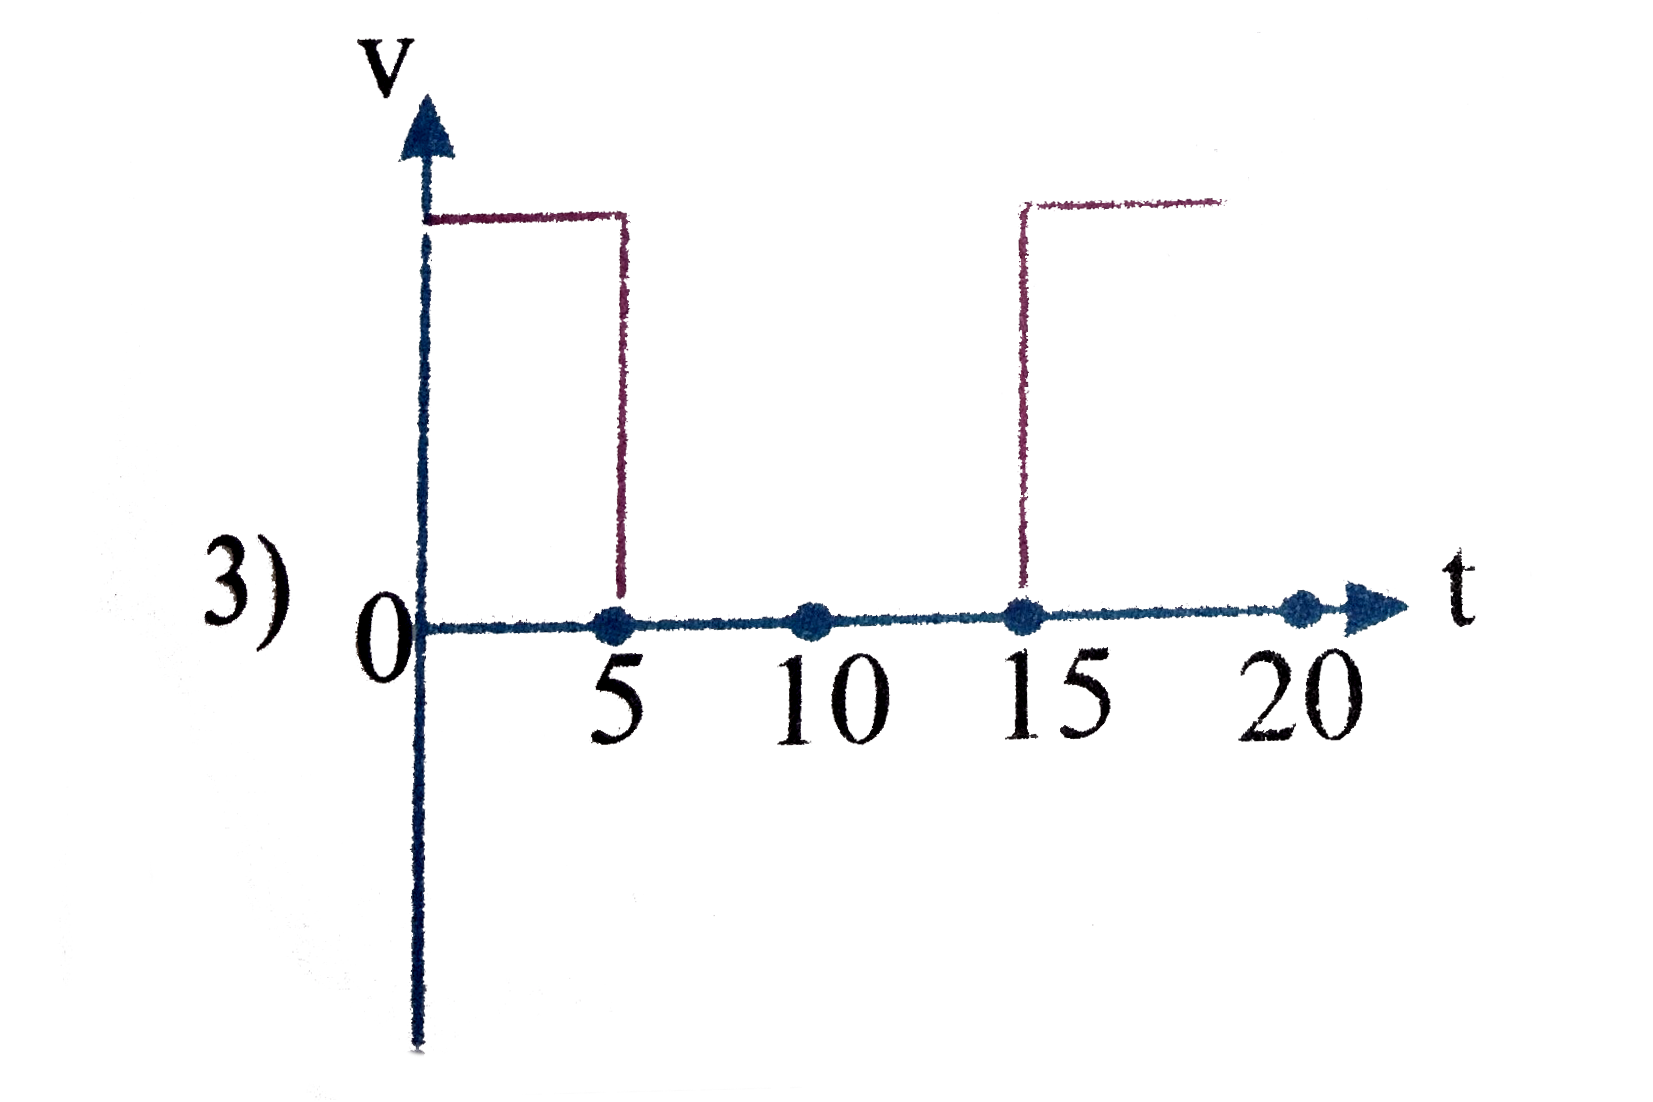 D
D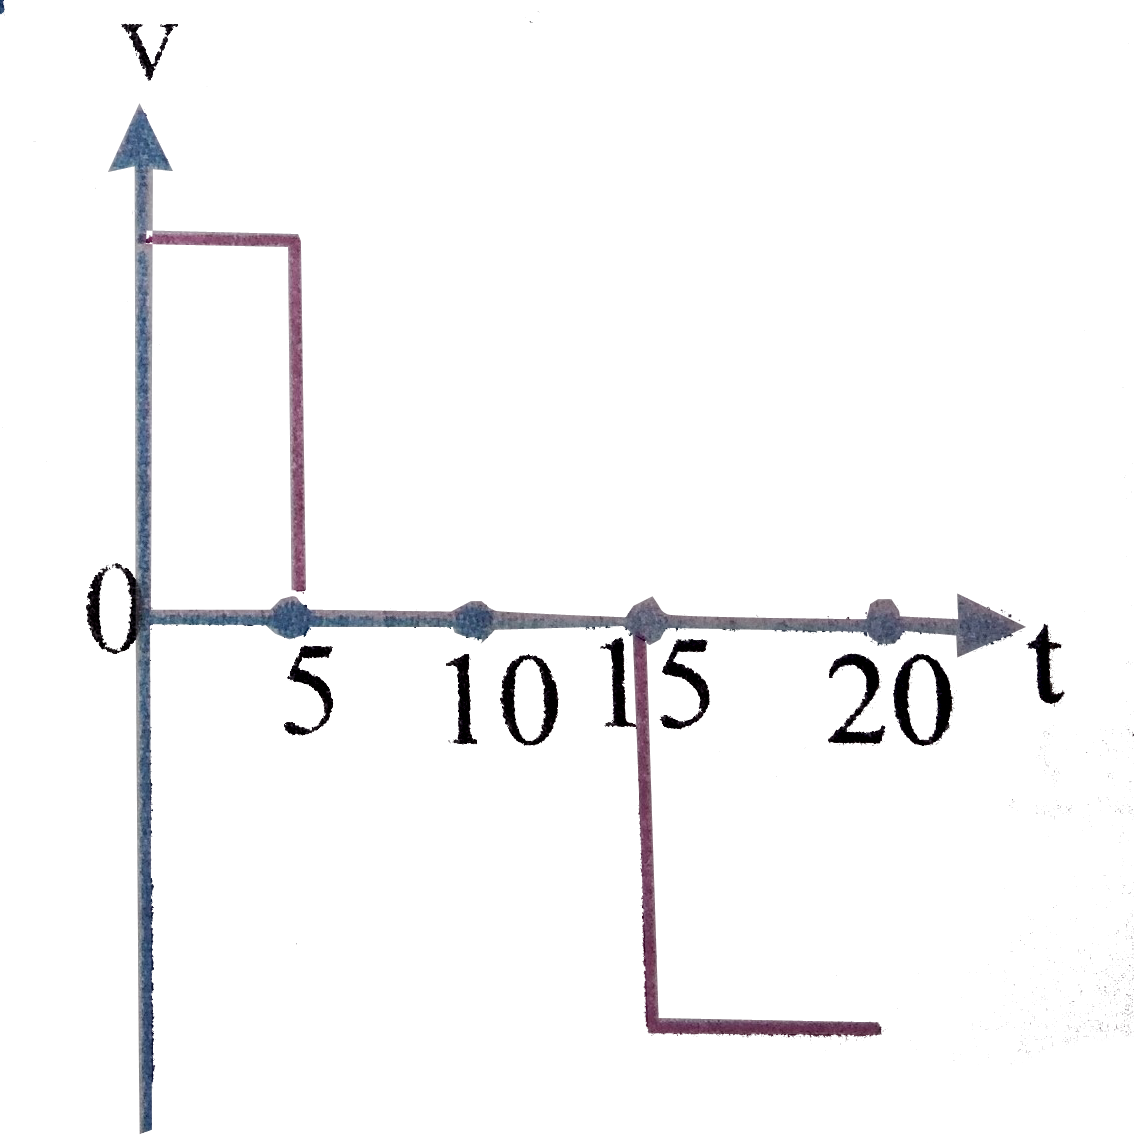
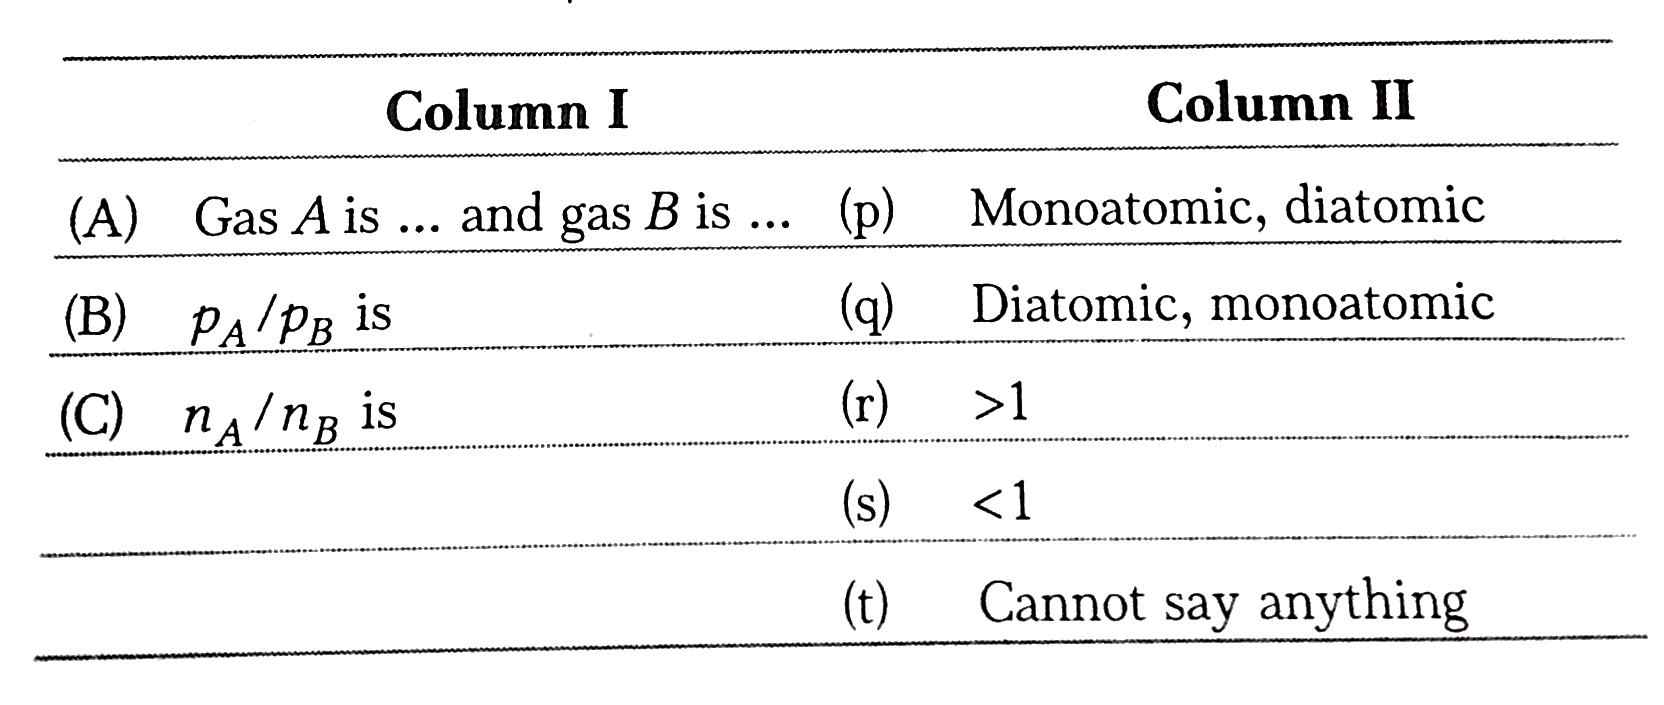
In the V-T graph shown in the figure match the following columns.
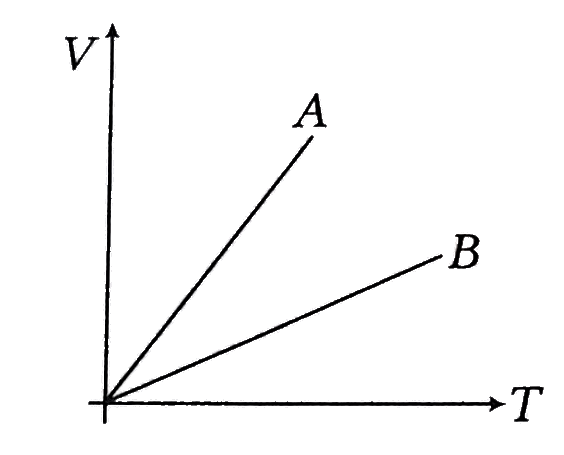
View SolutionA graph plotted between log k vs 1T is represented by
View SolutionIn Arrehenius equation if a graph is plotted between logK and 1/T, the slope of the curve will be:
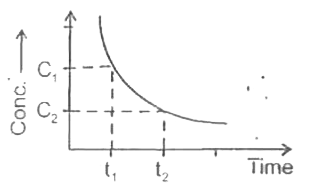
View SolutionThe graph plotted between concentration versus time
View SolutionIn Searl's experiment a graph is plotted between
View Solution

