A person goes to market, makes purchases and comes back at a constant slower speed. Draw displacement-time and velocity time graphs of the person.
Figure (a) shows displacement time graph. Part OA has greater slope and part BC. Therefore, velocity while going to market is higher compared to velocity while coming back.
Figure (b) shows velocity time graph. Again velocity PQ while going to market is higher than areas enclosed between time axis and velocity curves are equal but of opposite sign as the net displacement in the process is zero.
(a) 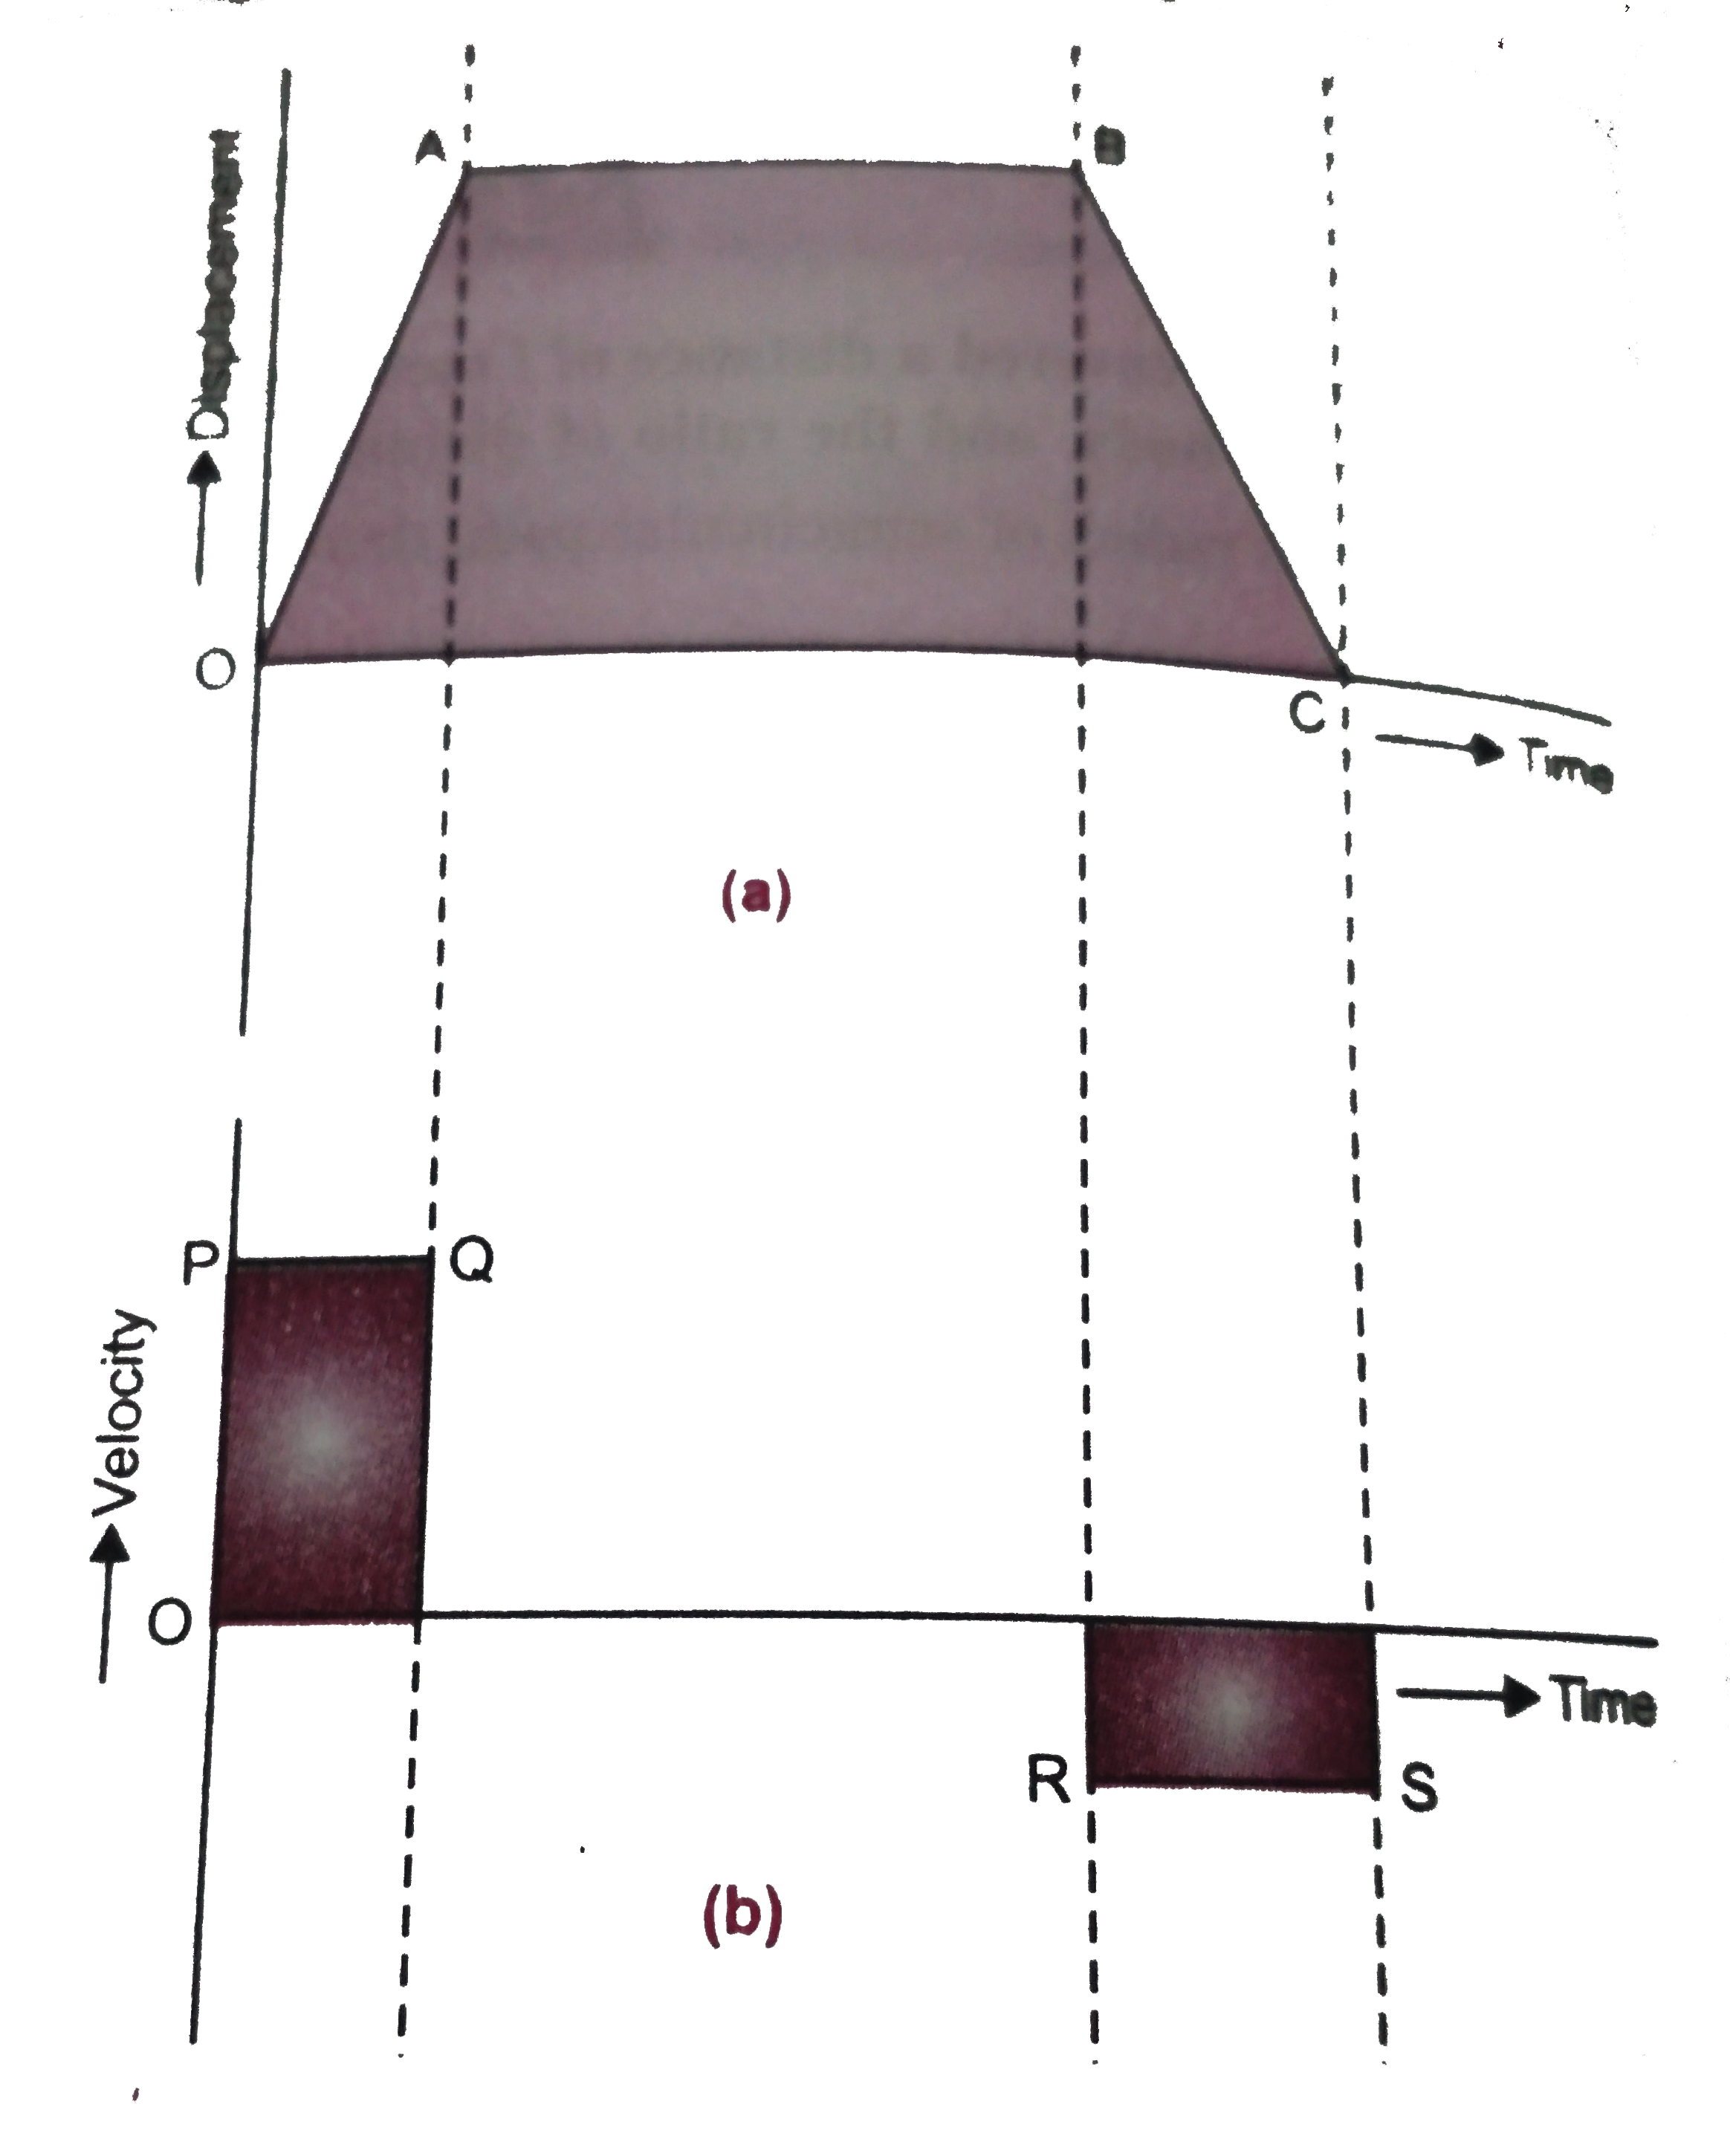
Topper's Solved these Questions
- BOOK - PRADEEPCHAPTER - MOTIONEXERCISE - value based question4videos
MOTION
- BOOK - PRADEEPCHAPTER - MOTIONEXERCISE - Problem for practice32videos
MOTION
- BOOK - PRADEEPCHAPTER - MOTIONEXERCISE - Short answer questions9videos
MOTION
- BOOK - PRADEEPCHAPTER - GRAVITATIONEXERCISE - Model Test paper (1)36videos
GRAVITATION
- BOOK - PRADEEPCHAPTER - SOUNDEXERCISE - Model Test (sec - B)12videos
SOUND
Similar Questions
Knowledge Check
- Question 1 - Select One
If a particle moves with a constant speed, the distance-time graph is
Astraight lineBcircleCstairlike lineDpolygon - Question 2 - Select One
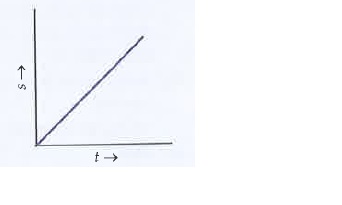
If a particle moves with a constant speed, the distance-time graph is
Astraight lineBcurved lineChorizontal line to time axisDparallel line to velocity axis
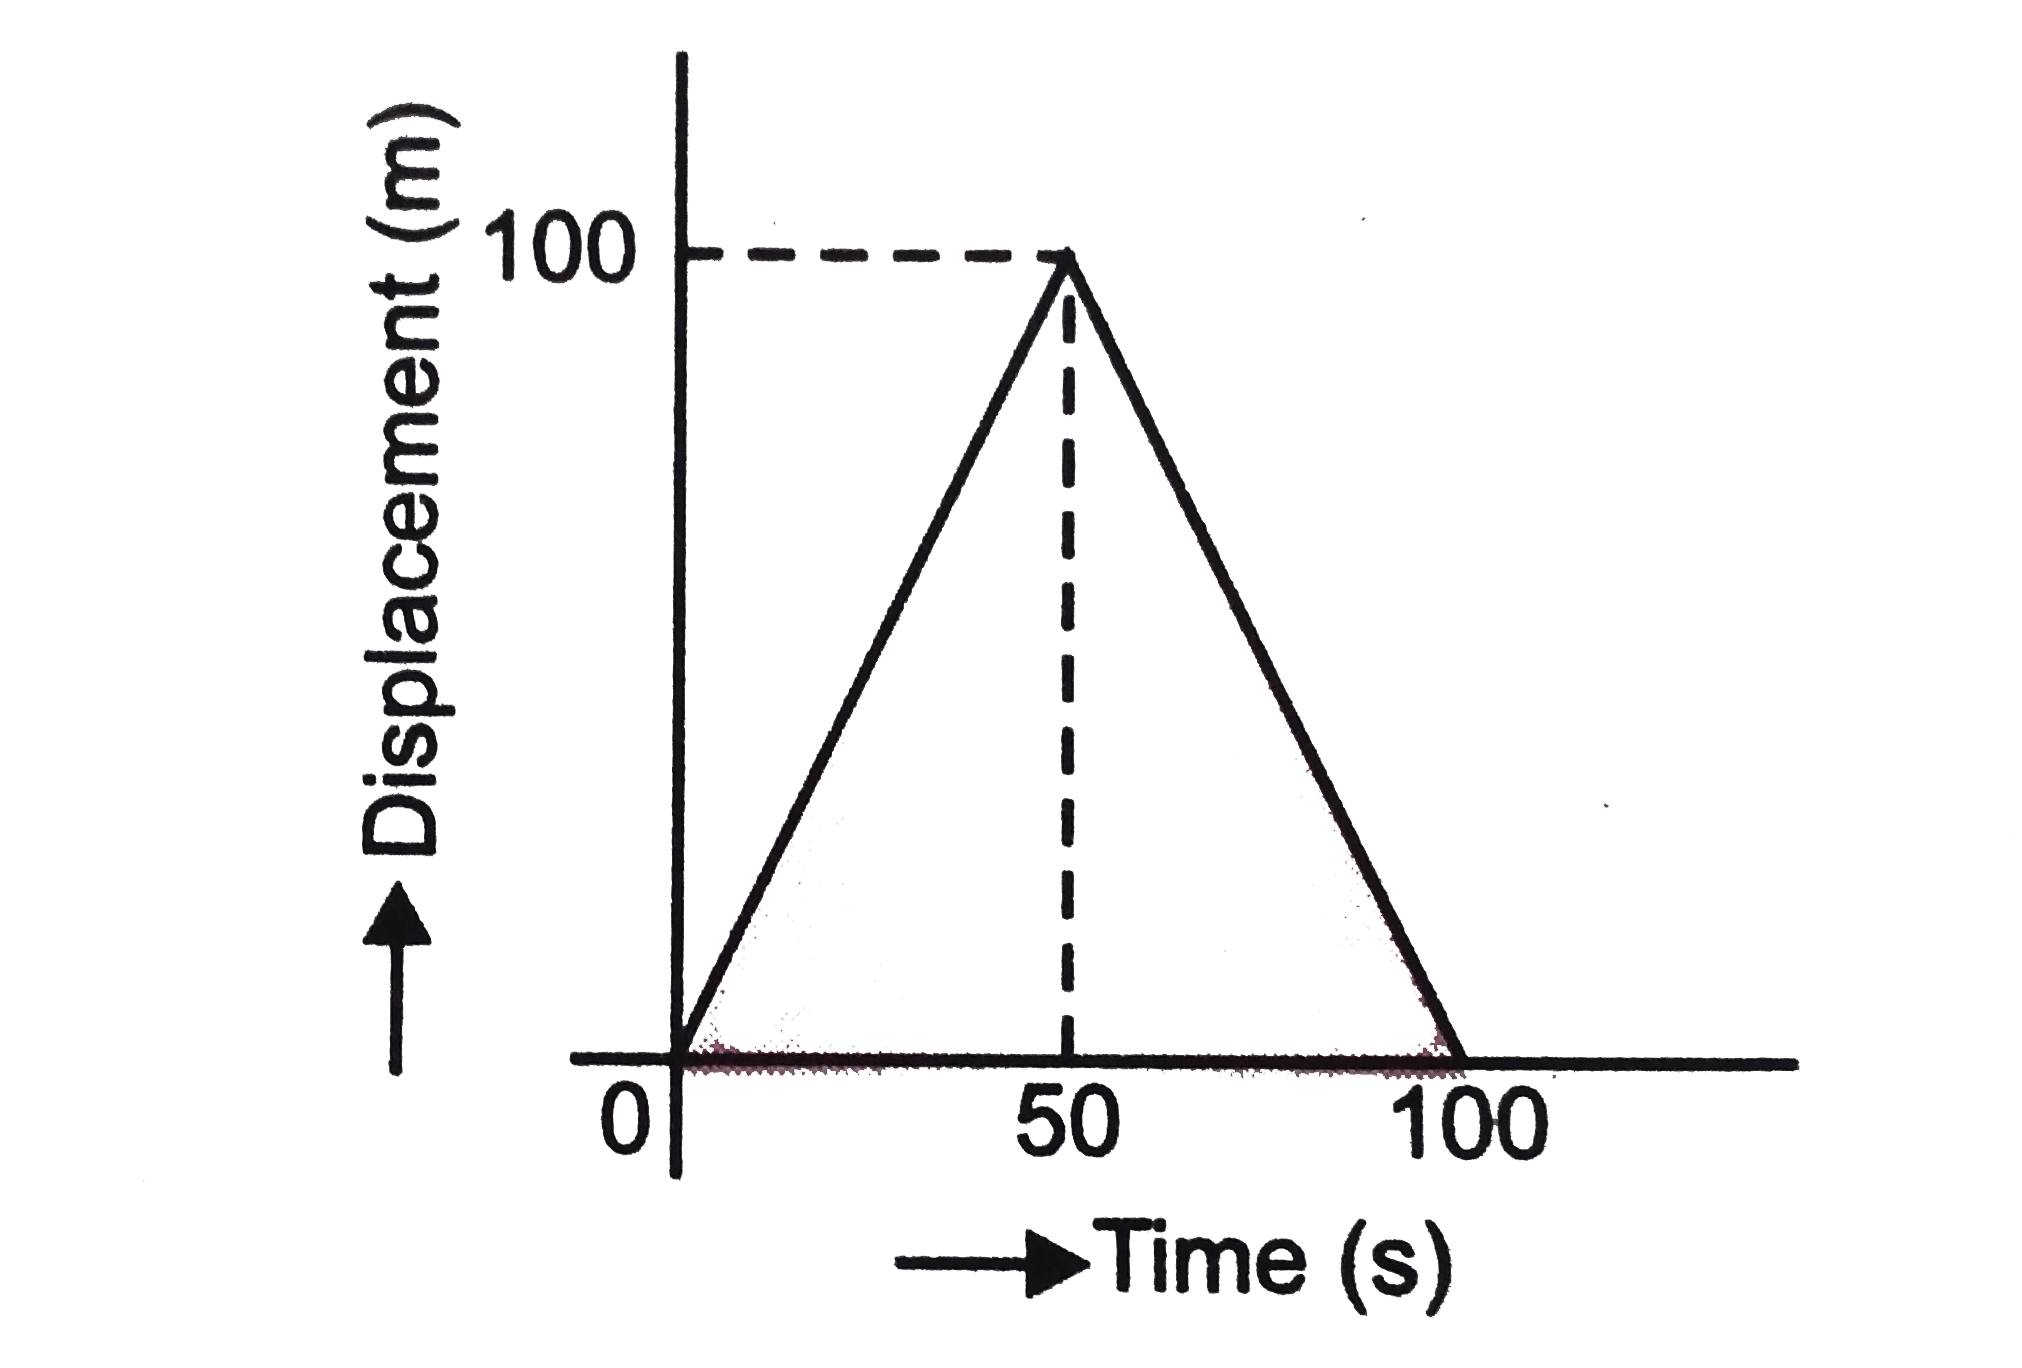
A girl walks along a straight path to drop a letter in the letterbox and comes back to her initial position. Her displacement-time graph is shown in Figure. Plot a velocity-time graph for the same.
 View Solution
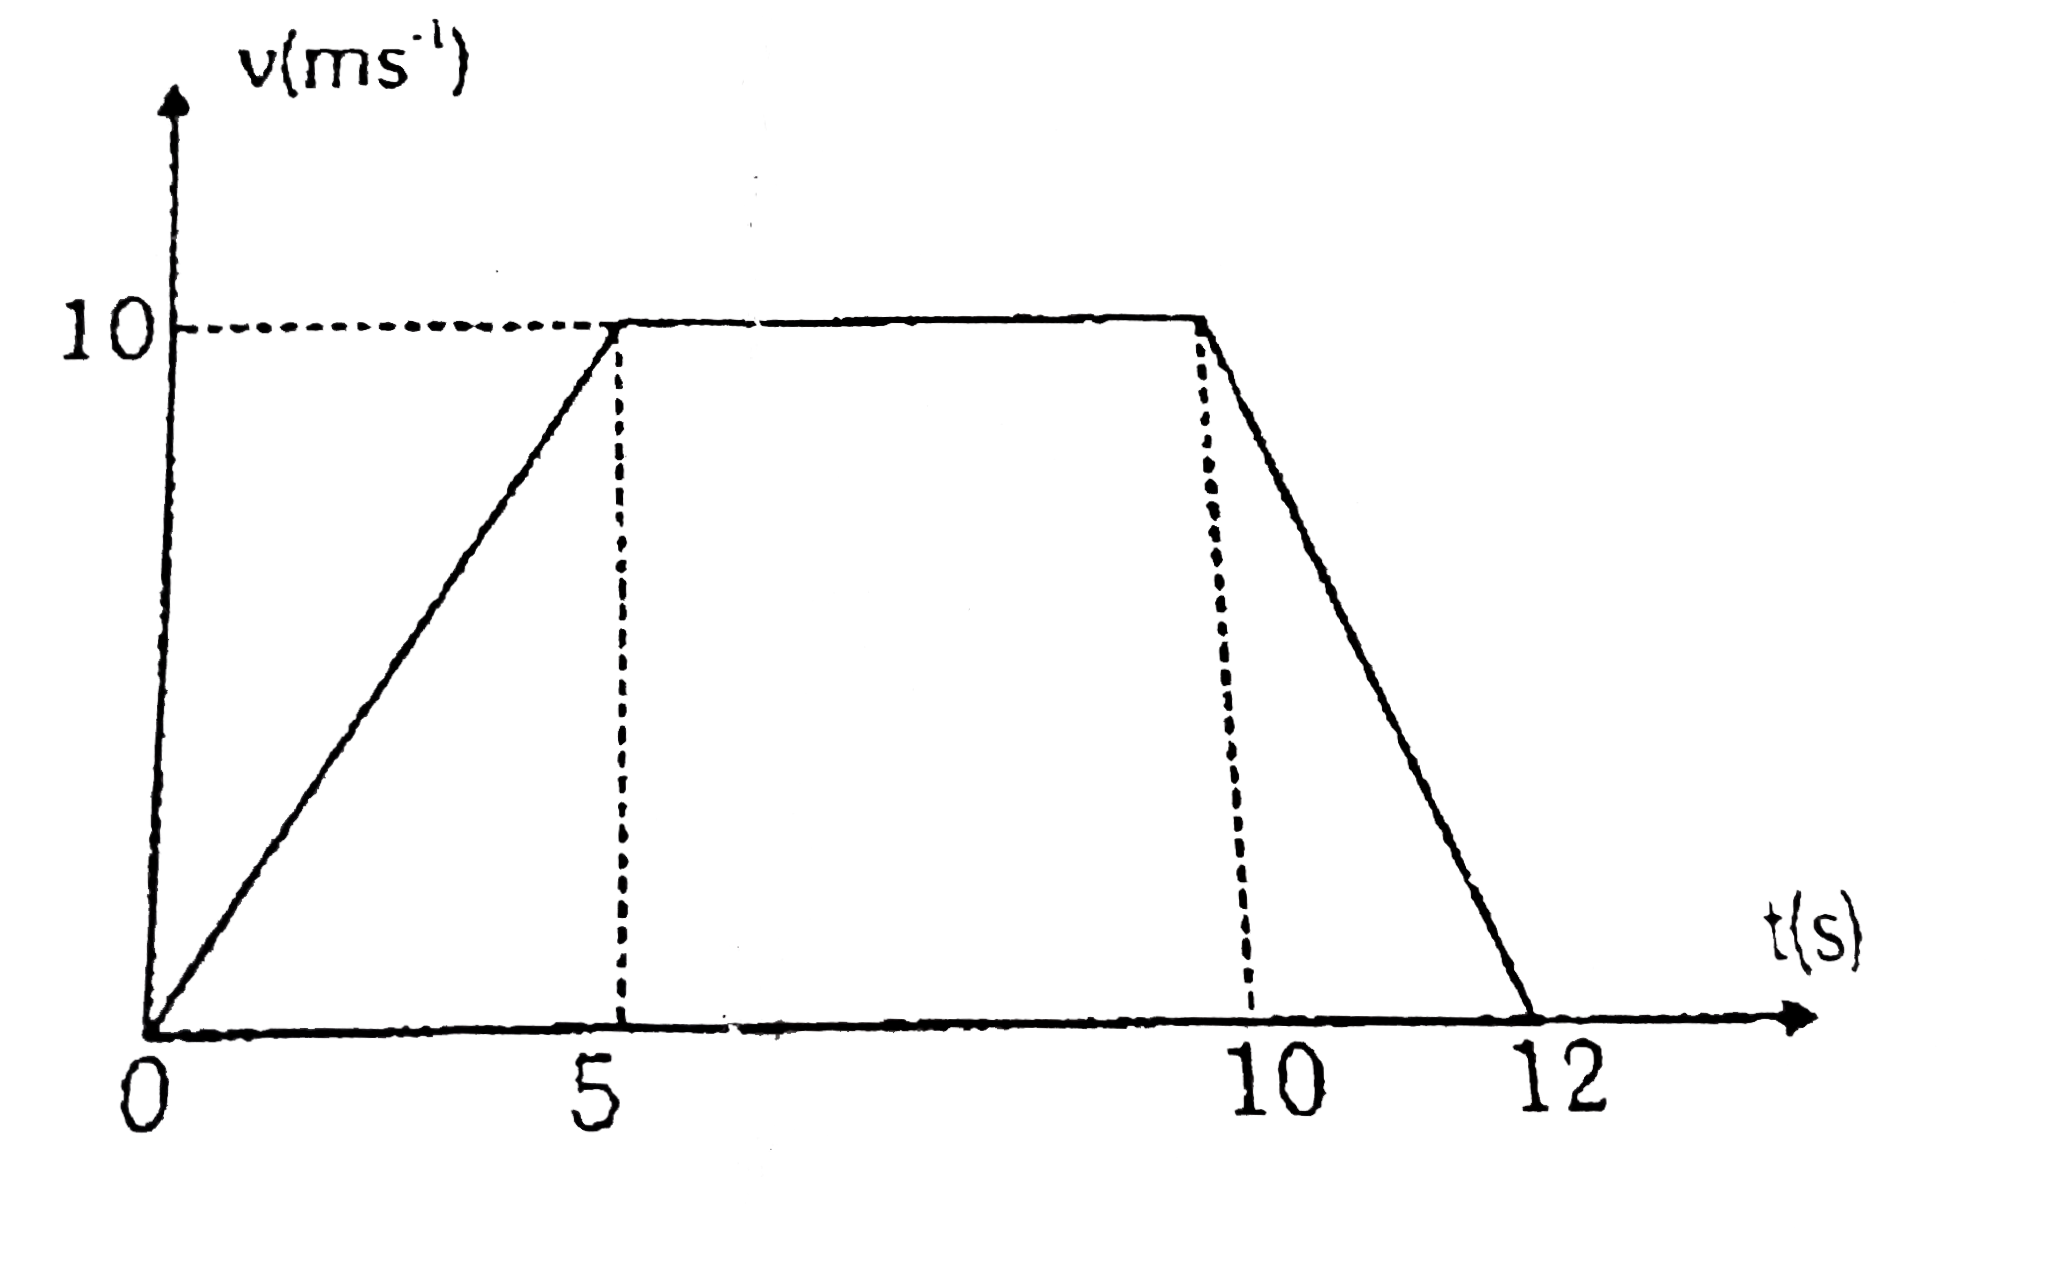
Draw displacement time and acceleration -time graph for the given velocity-time graph
 View Solution
Graphs in Kinematics|| Displacement-time graph|| Velocity-time graph|| accn vs time graph
View SolutionA body A is at rest and body B is moving with a constant velocity.
Draw (i) distance time graph of AandB
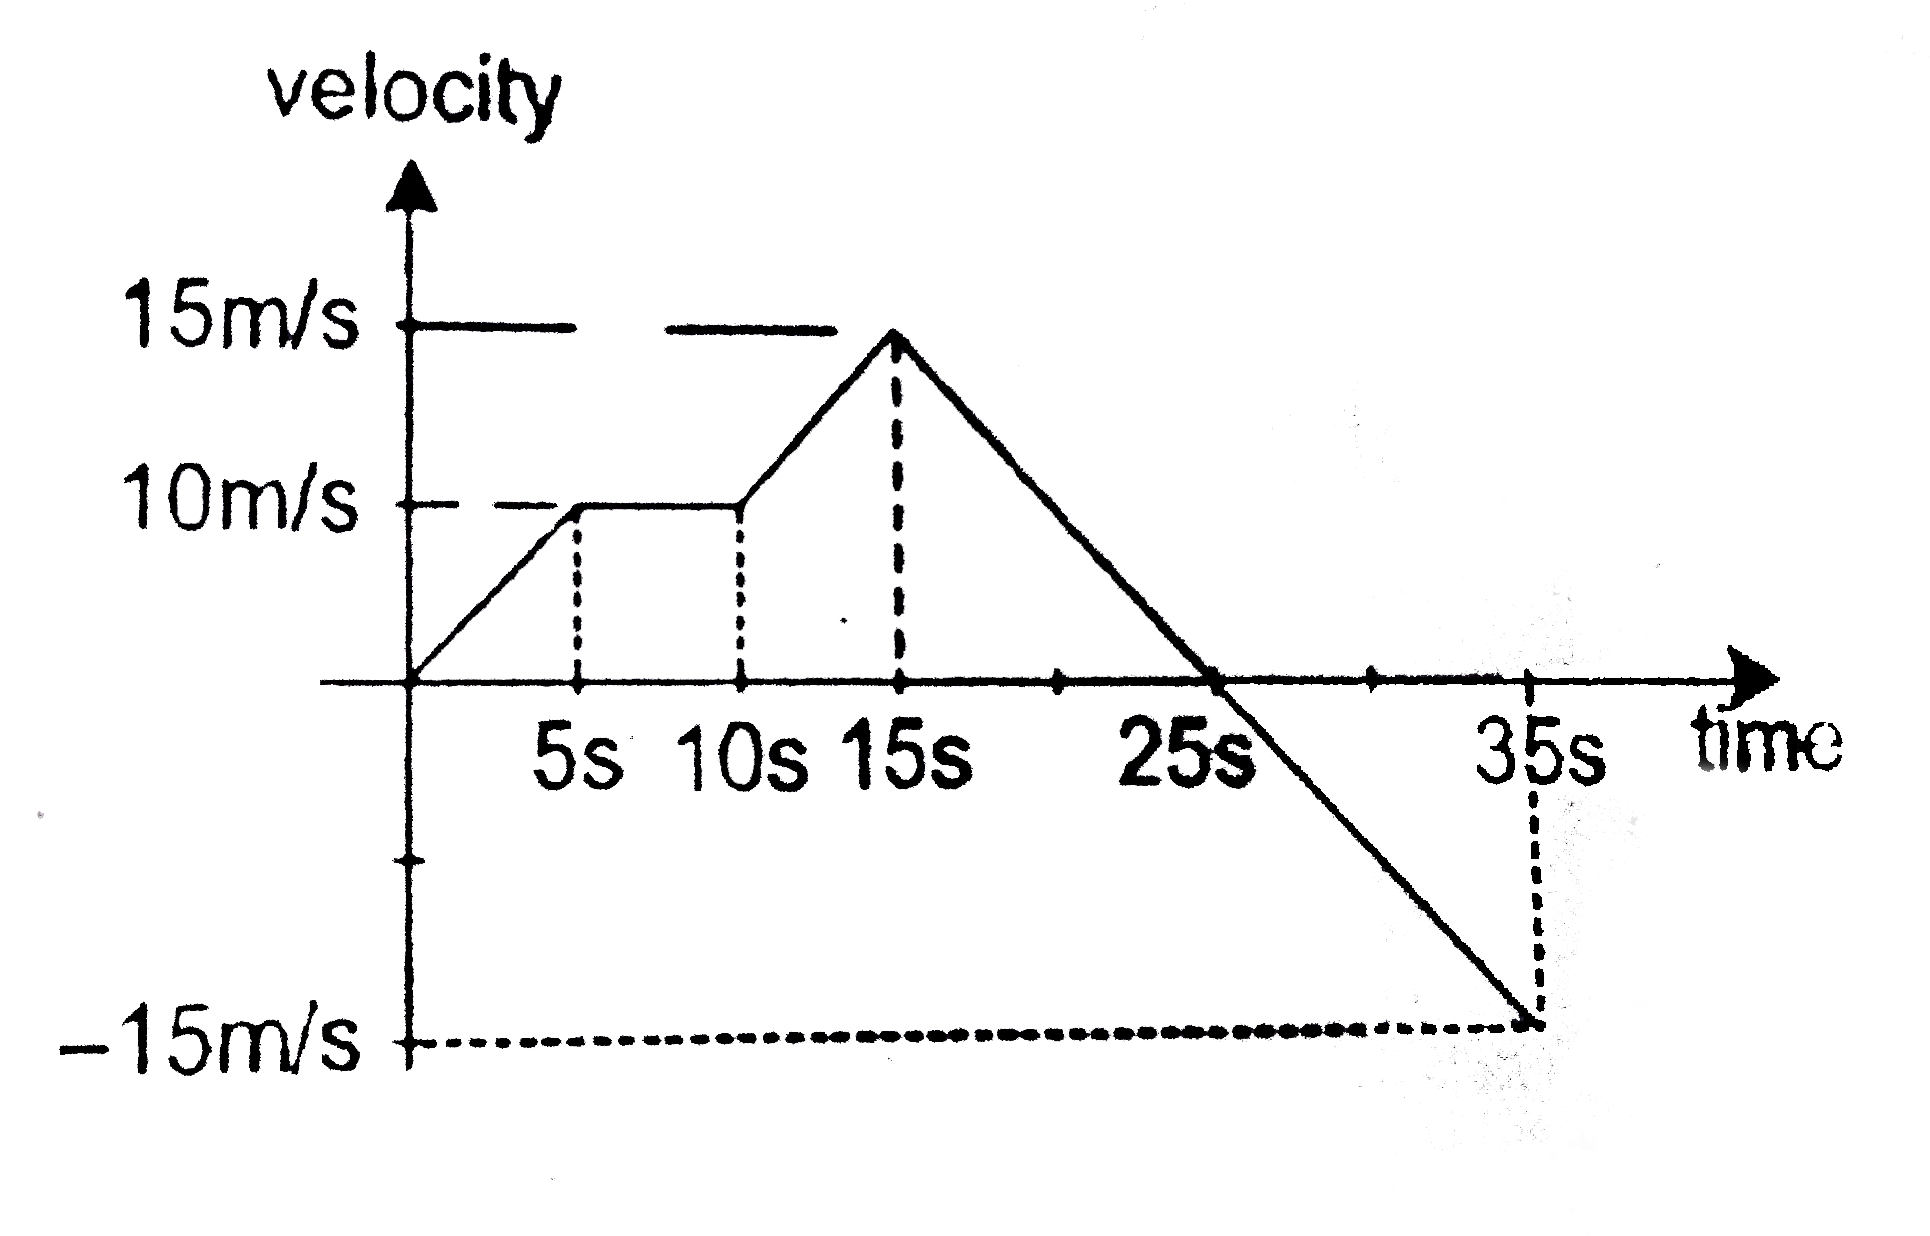
(ii) velocity time graph of AandB.View SolutionA person starts from origin and for his linear motion velocity is given as shown in figure. Draw displacement and acceleration graph with respect to time. Also find maximum displacement of the person.
 View Solution
Displacement-time graph of any object is shown in the adjacent figure. Draw velocity-time graph for this motion.
 View Solution

