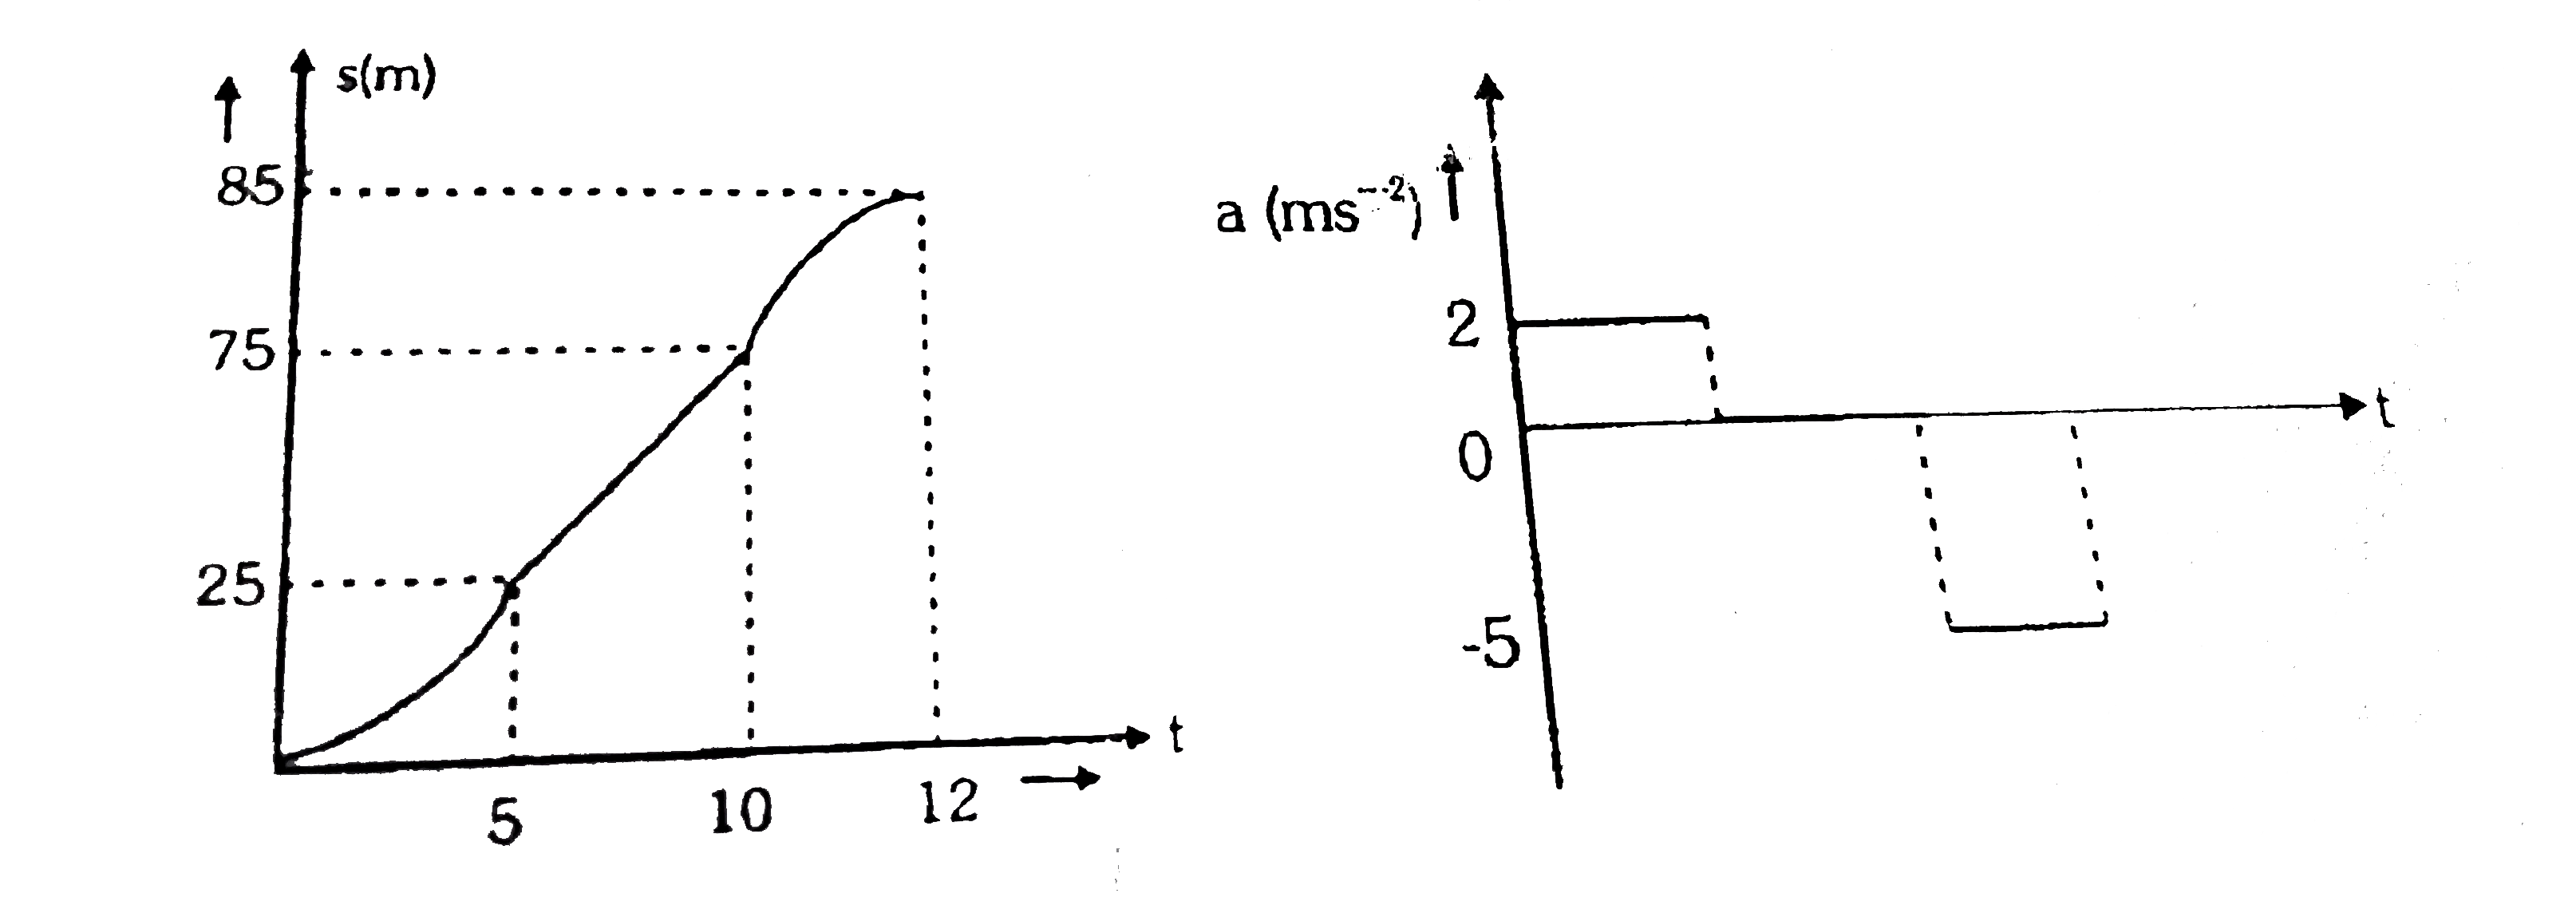
Draw displacement time and acceleration -time graph for the given velocity-time graph
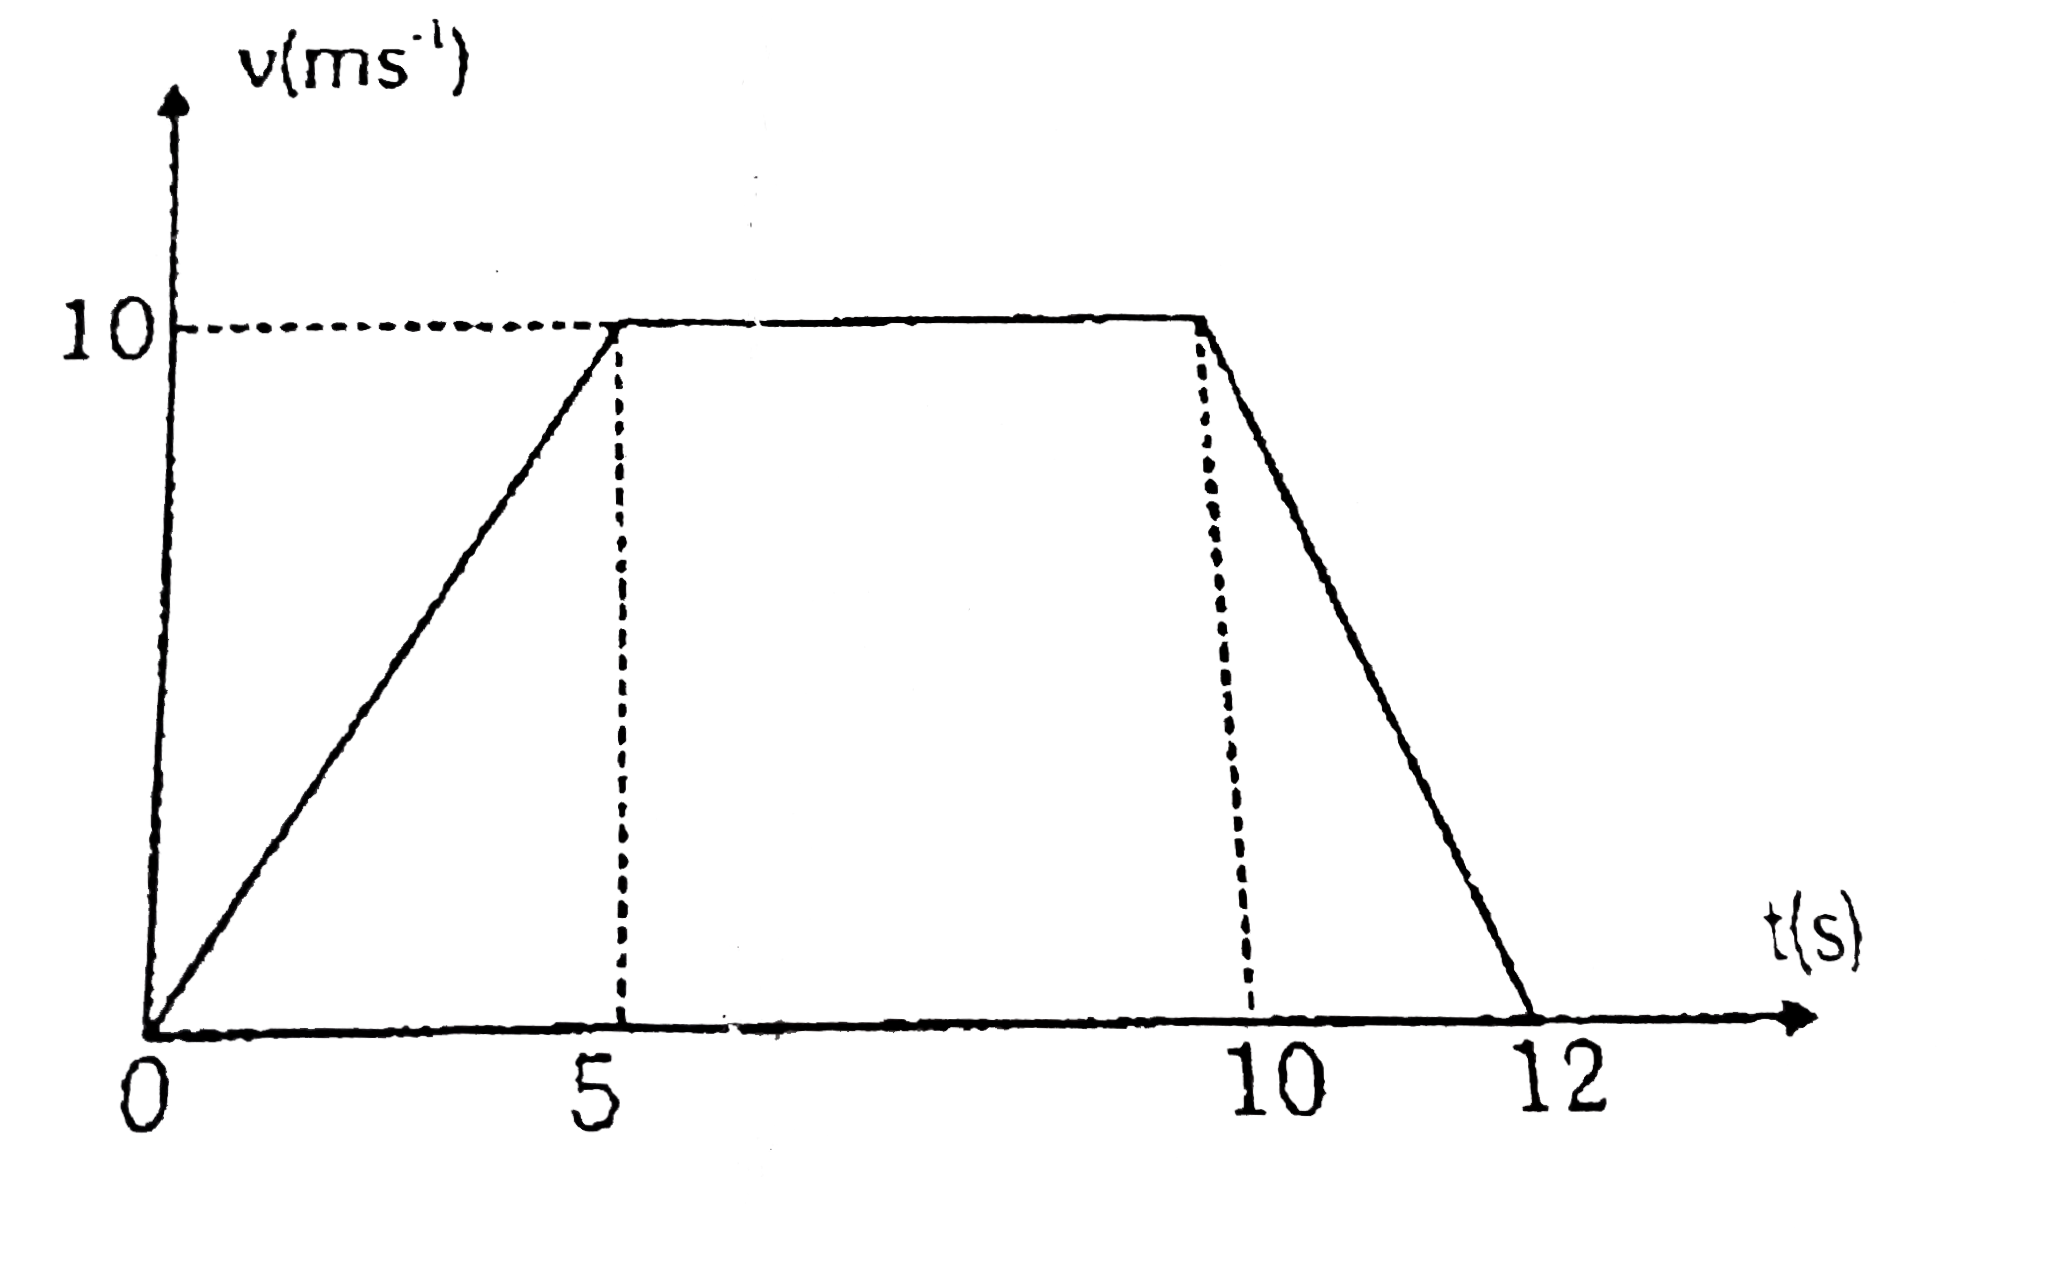
For 0≤t≤5v∝t⇒s∝t2 and a1= constant 105=2m/s2
for whole interval s1= Area under the curve =12×5×10=25m
For 5≤t≤10,v=10ms−1⇒a=0
for whole interval s2= area under the curve =5×10=50m
For 10≤t≤12 v linearly decreases decreases with time ⇒a3=−102=−5ms−2
for whole interval s3= Area under the curve =12×2×10=10m
Topper's Solved these Questions
- BOOK - ALLENCHAPTER - KINEMATICSEXERCISE - EXERCISE-0155videos
KINEMATICS
- BOOK - ALLENCHAPTER - KINEMATICSEXERCISE - EXERCISE-0257videos
KINEMATICS
- BOOK - ALLENCHAPTER - ERROR AND MEASUREMENTEXERCISE - Part-2(Exercise-2)(B)22videos
ERROR AND MEASUREMENT
- BOOK - ALLENCHAPTER - KINEMATICS (MOTION ALONG A STRAIGHT LINE AND MOTION IN A PLANE)EXERCISE - BEGINNER S BOX-78videos
KINEMATICS (MOTION ALONG A STRAIGHT LINE AND MOTION IN A PLANE)
Similar Questions
Draw the acceleration-time graphs for the given velocity-time graphs of a particle moving along x-axis.
 View Solution
Which of the following can be a closed curve? Give one example each.
(i) Velocity-time graph
(ii) Displacement-time graph
(iii) Acceleration-time graph
(iv) Velocity-displacement graphView Solution
Knowledge Check
- Question 1 - Select One
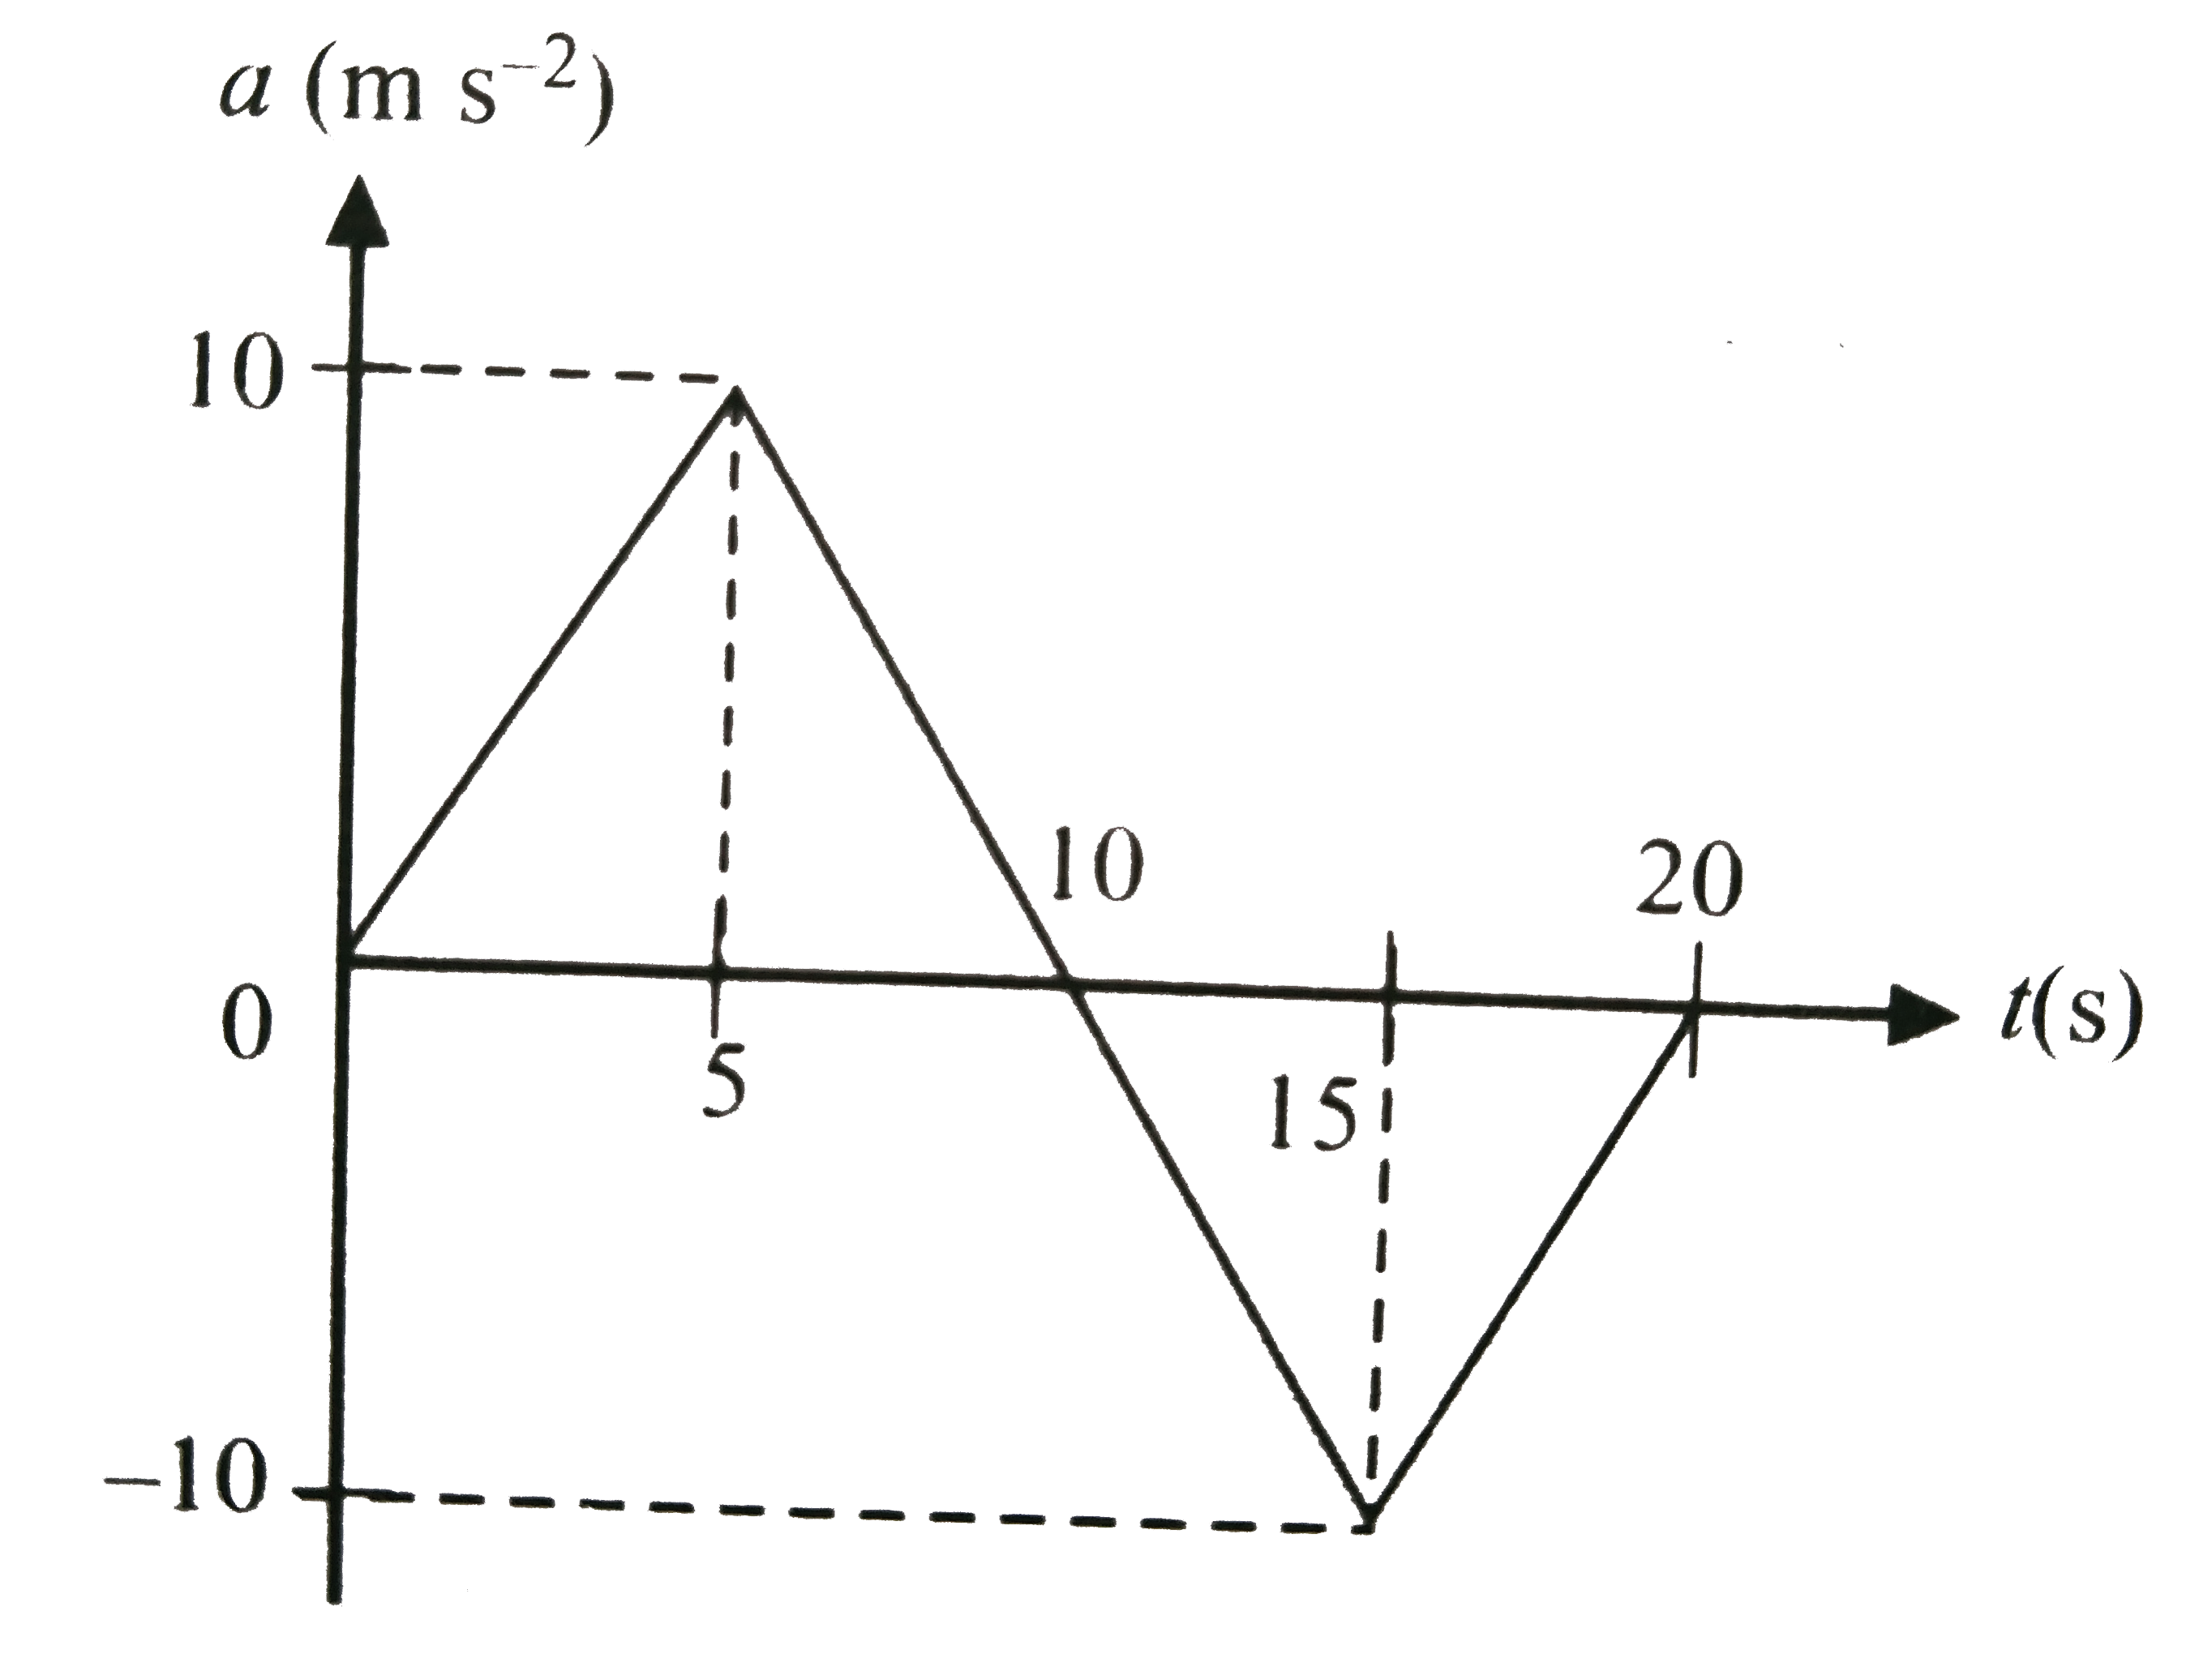
Plot the acceleration-time graph of the welocity-time graph given in.
 .A
.A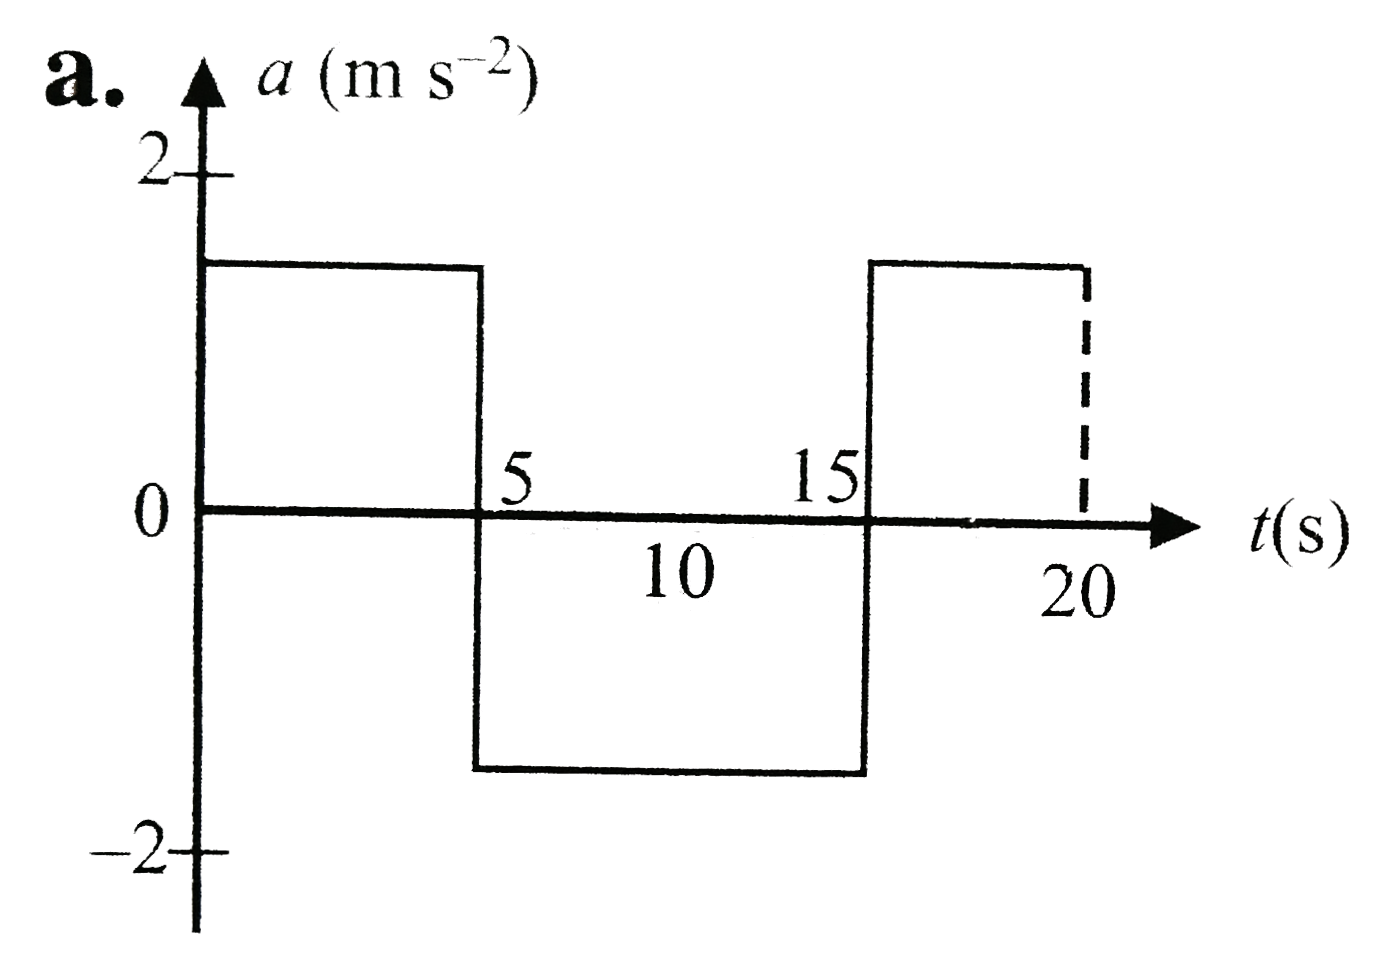 .B
.B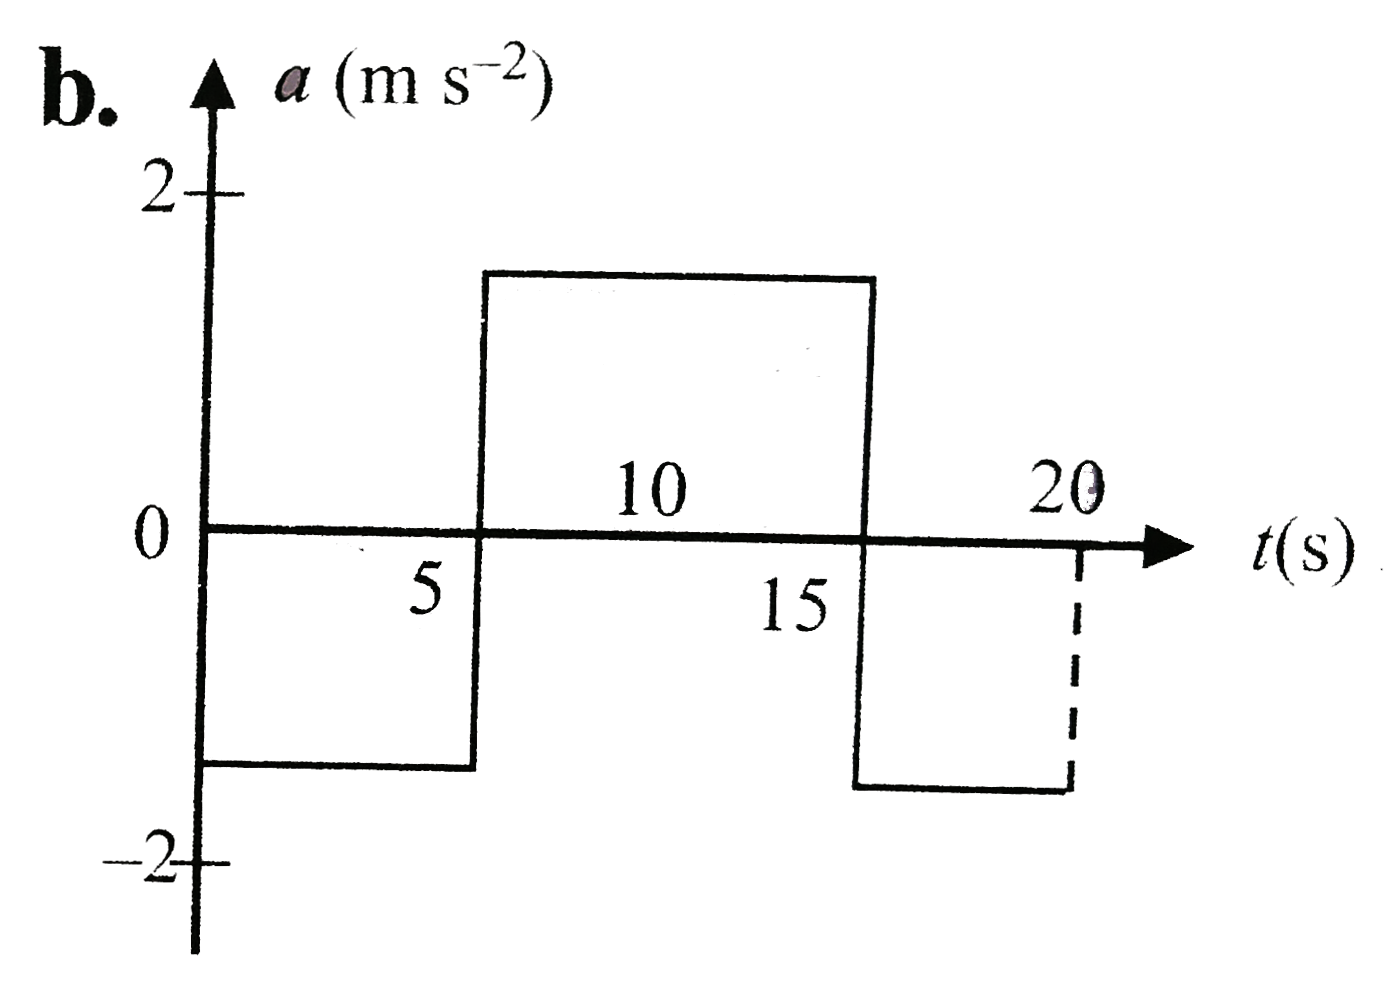 .C
.C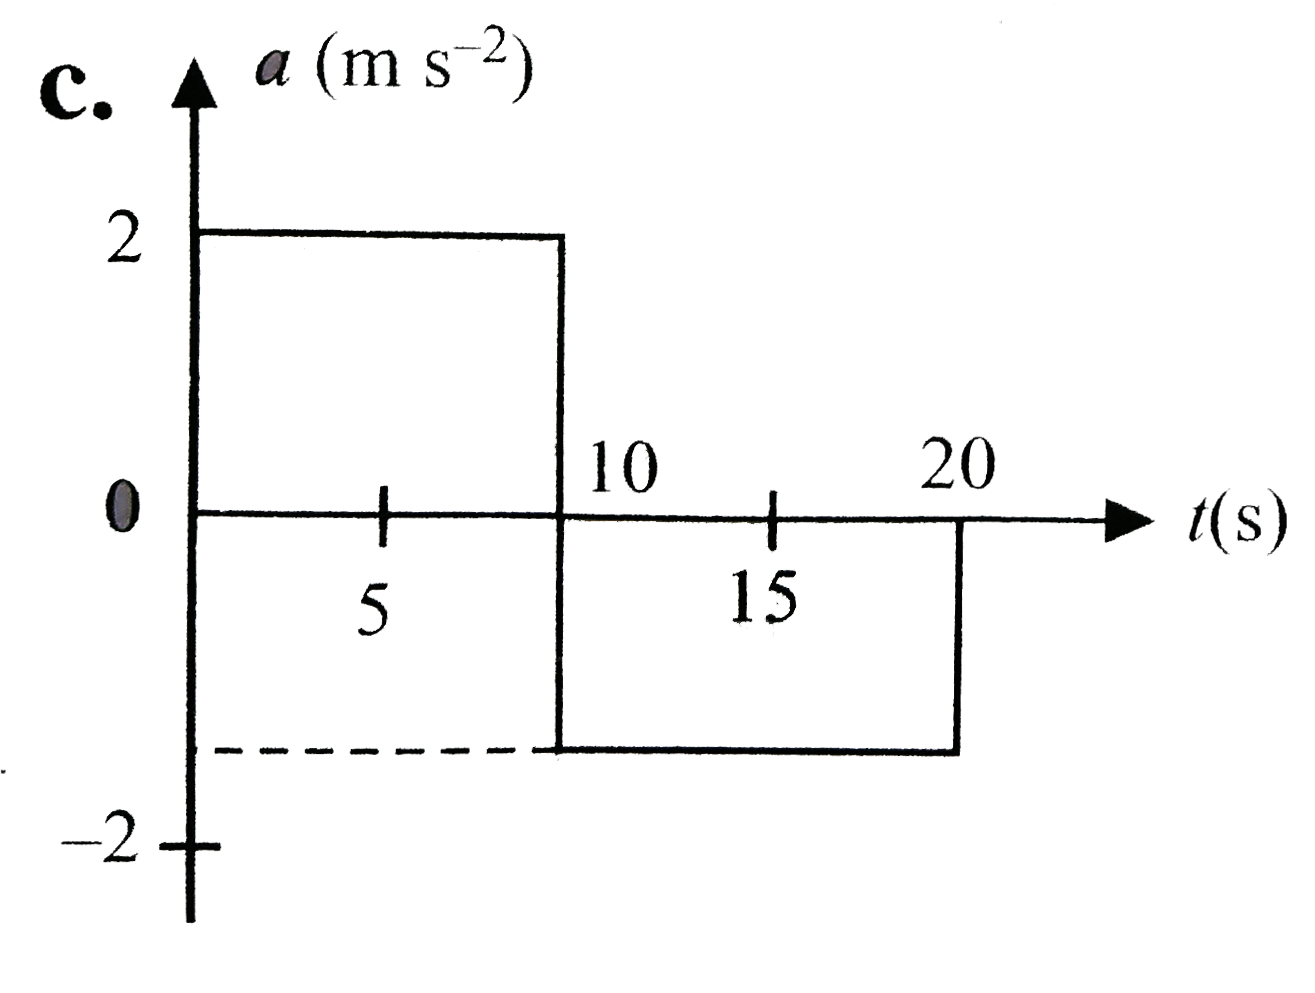 .D
.D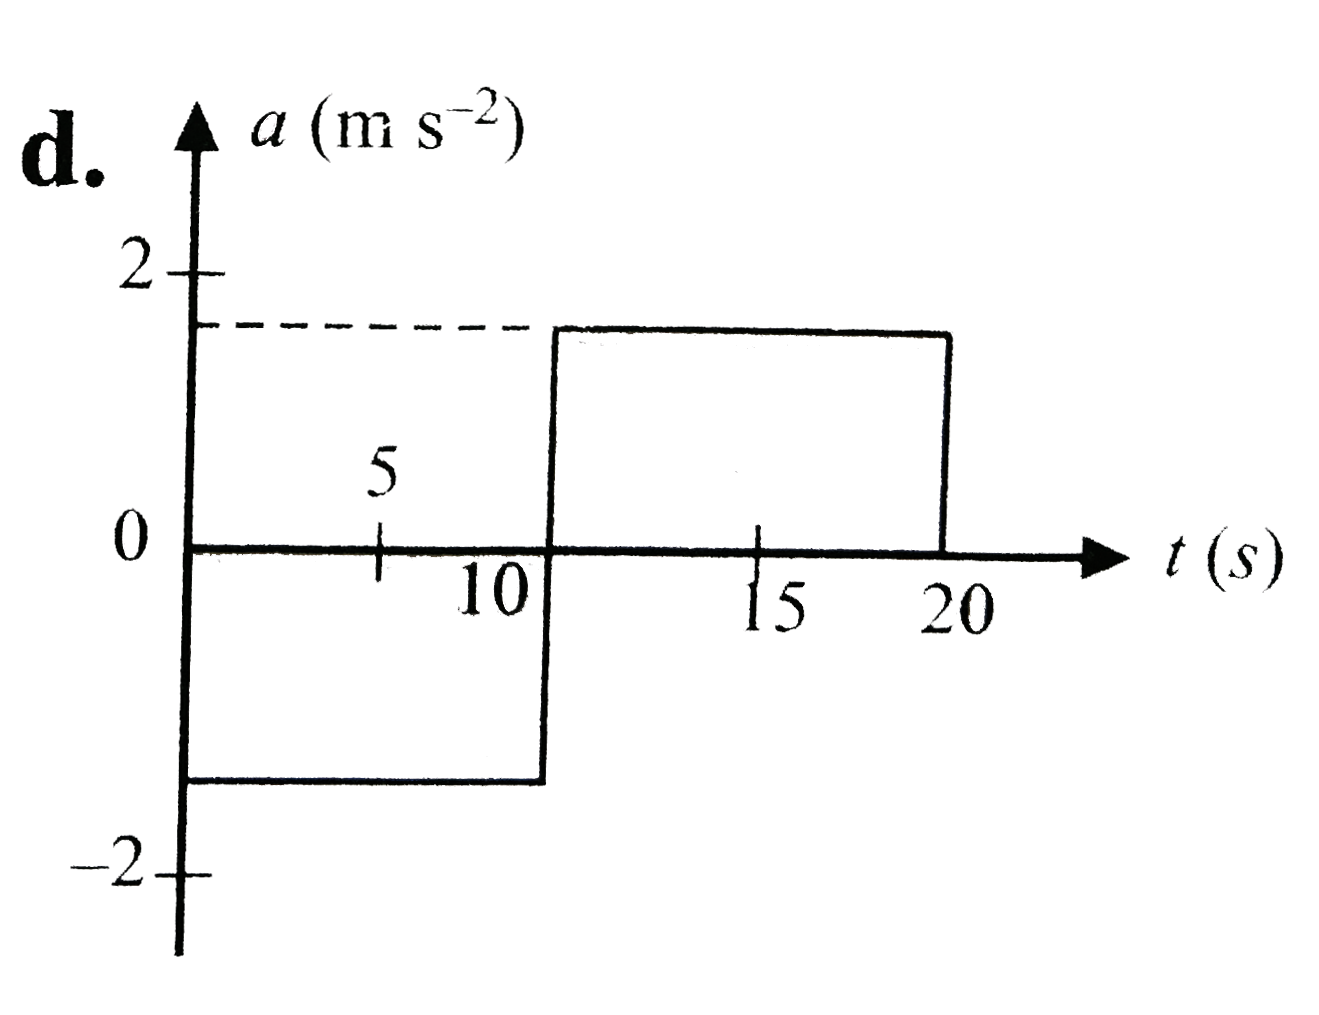 .
. - Question 2 - Select One
For a given acceleration − time graph, there exist ………………………… velocity − time graph
A1B2C3Dmany - Question 3 - Select One
Assertion: Area under velocity-time graph give displacement.
Reason: Area under acceleration-time graph give velocity.AIf both assertion and reason are true and reason is the correct explanation of assertion.BIf both assertion and reason are true but reason is not the correct explanation of assertion.CIf assertion is true but reason is false.DIf assersion is false but reason is true.
Draw displacement-time, velocity-time and acceleration-time graphs for a particle executing simple harmonic motion. Discuss their phase relationship.
View SolutionGraphs(Displacement-time)
View SolutionDraw areal velocity time graph for Mars.
View SolutionAcceleration||Acceleration-Time Graph
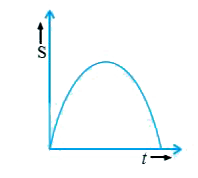
View SolutionThe graph of displacement v/s time is given below. Its corresponding velocity-time graph will be :
 View Solution

