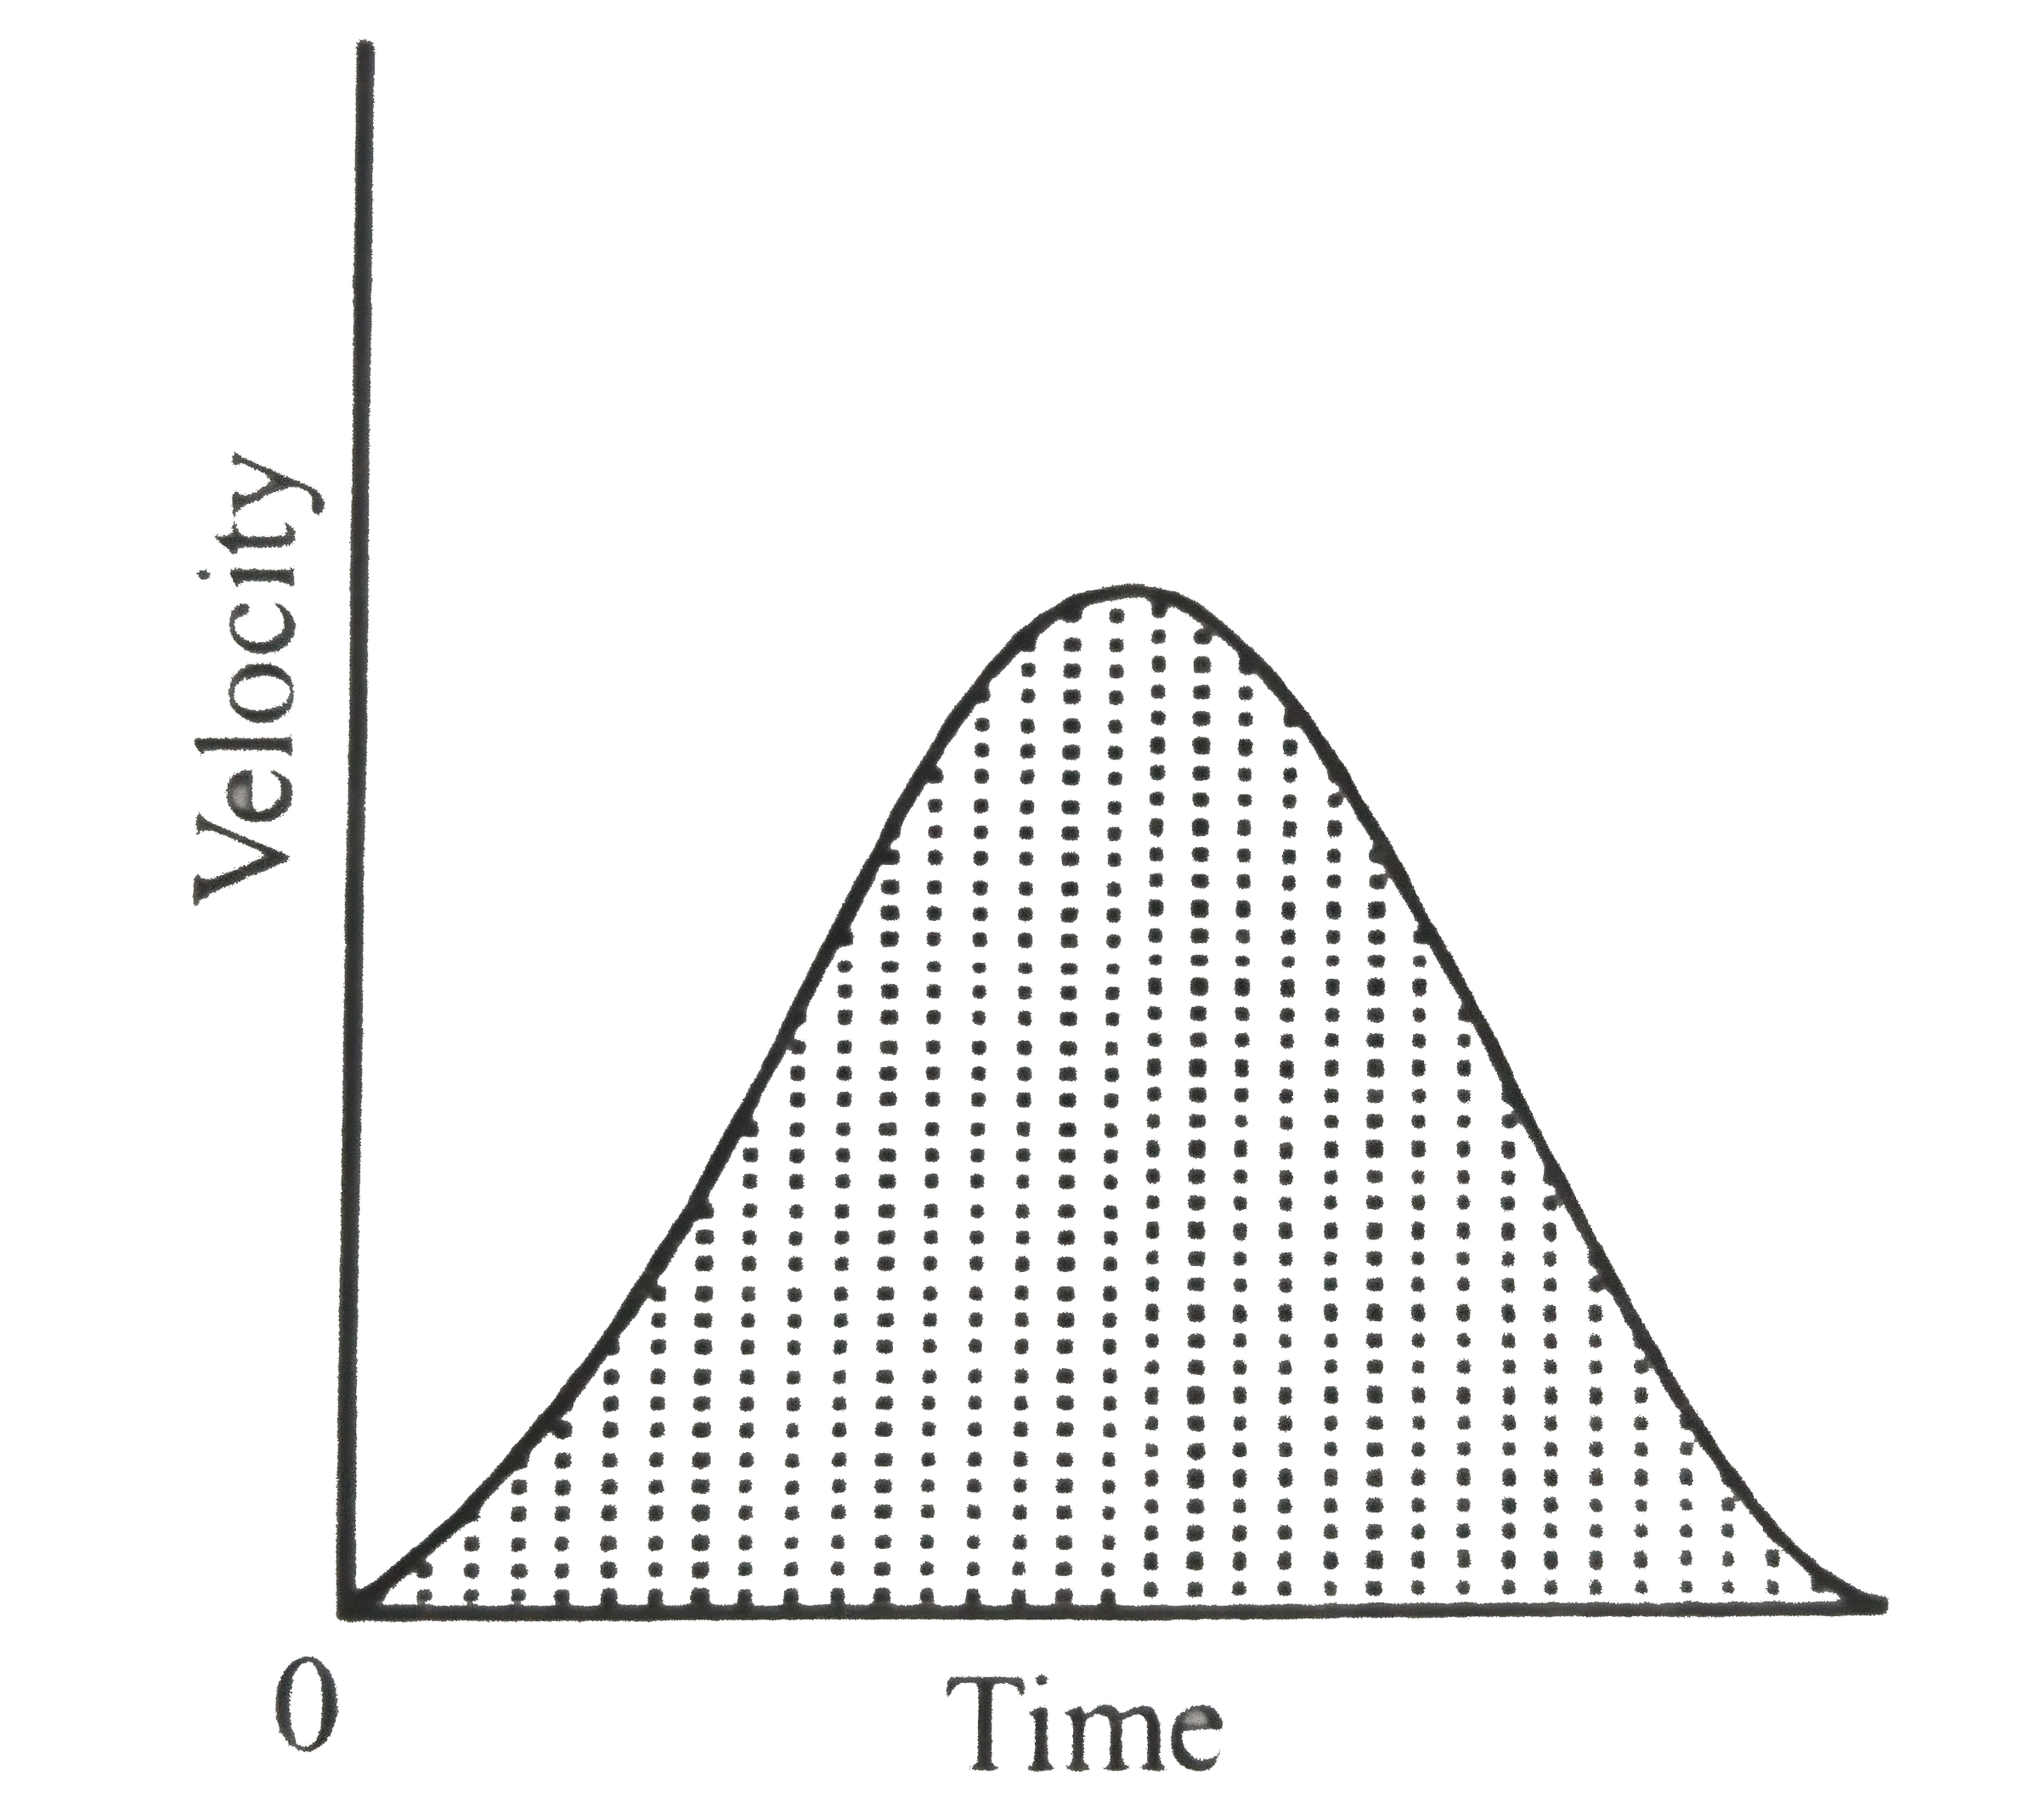
What is the quantity which is measured by the area occupied below the velocity-time graph ?
Area under velocity time graph of a body represents distance travelled by the body in the given time.
Topper's Solved these Questions
- BOOK - PRADEEPCHAPTER - MOTIONEXERCISE - Quiz testing12videos
MOTION
- BOOK - PRADEEPCHAPTER - MOTIONEXERCISE - Worksheet testing(fill in the blanks)5videos
MOTION
- BOOK - PRADEEPCHAPTER - MOTIONEXERCISE - Problem for practice32videos
MOTION
- BOOK - PRADEEPCHAPTER - GRAVITATIONEXERCISE - Model Test paper (1)36videos
GRAVITATION
- BOOK - PRADEEPCHAPTER - SOUNDEXERCISE - Model Test (sec - B)12videos
SOUND
Similar Questions
Knowledge Check
- Question 1 - Select One
In relation to a velocity-time graph
Athe curve can be a circleBthe area under the curve and above the time axis between any two instants gives the average acceleration.Cthe slope at any instant gives the rate of change of acceleration at that instantDthe area under the curve and above the time axis gives the displacement. - Question 2 - Select One
Area under a velocity-time graph gives
Athe time taken by a moving objectBthe distance travelled by a moving objectCthe acceleration of moving objectDthe retardation of a moving object - Question 3 - Select One
The area under a velocity-time graph gives :
ADisplacementBChange in velocityCAccelerationDSpeed

Which one of the following characteristics of the particle does the shaded area of the velocity-time graph shown above represent?View SolutionDraw velocity-time graphof uniform motion and prove that the area under the velocity-time graph of a particle gives the displacement of the particle in a given time.
View SolutionGraphs are very useful to represent a physical situation. Various quantities can be easily represented on graphs and other quantites can be determined from the graph. For example the slope of velocity-time graph represents instantaneous acceleration. For a motion with constant acceleration slope of velocity-time graph is constant. If acceleration is changing with time, slope with change and thus velocity-time graph will be a non-linear curve. Further the area of velocity-time graph gives displacement.
The average velocity of the car for the entire trip isView SolutionGraphs are very useful to represent a physical situation. Various quantities can be easily represented on graphs and other quantites can be determined from the graph. For example the slope of velocity-time graph represents instantaneous acceleration. For a motion with constant acceleration slope of velocity-time graph is constant. If acceleration is changing with time, slope with change and thus velocity-time graph will be a non-linear curve. Further the area of velocity-time graph gives displacement.
The correct relation between v0,a1,a2andt0 isView SolutionGraphs are very useful to represent a physical situation. Various quantities can be easily represented on graphs and other quantites can be determined from the graph. For example the slope of velocity-time graph represents instantaneous acceleration. For a motion with constant acceleration slope of velocity-time graph is constant. If acceleration is changing with time, slope with change and thus velocity-time graph will be a non-linear curve. Further the area of velocity-time graph gives displacement.
For the above situation let t1 be the time of accelerated motion and t2 be the time or retarded motion, then the correct relation isView Solution

