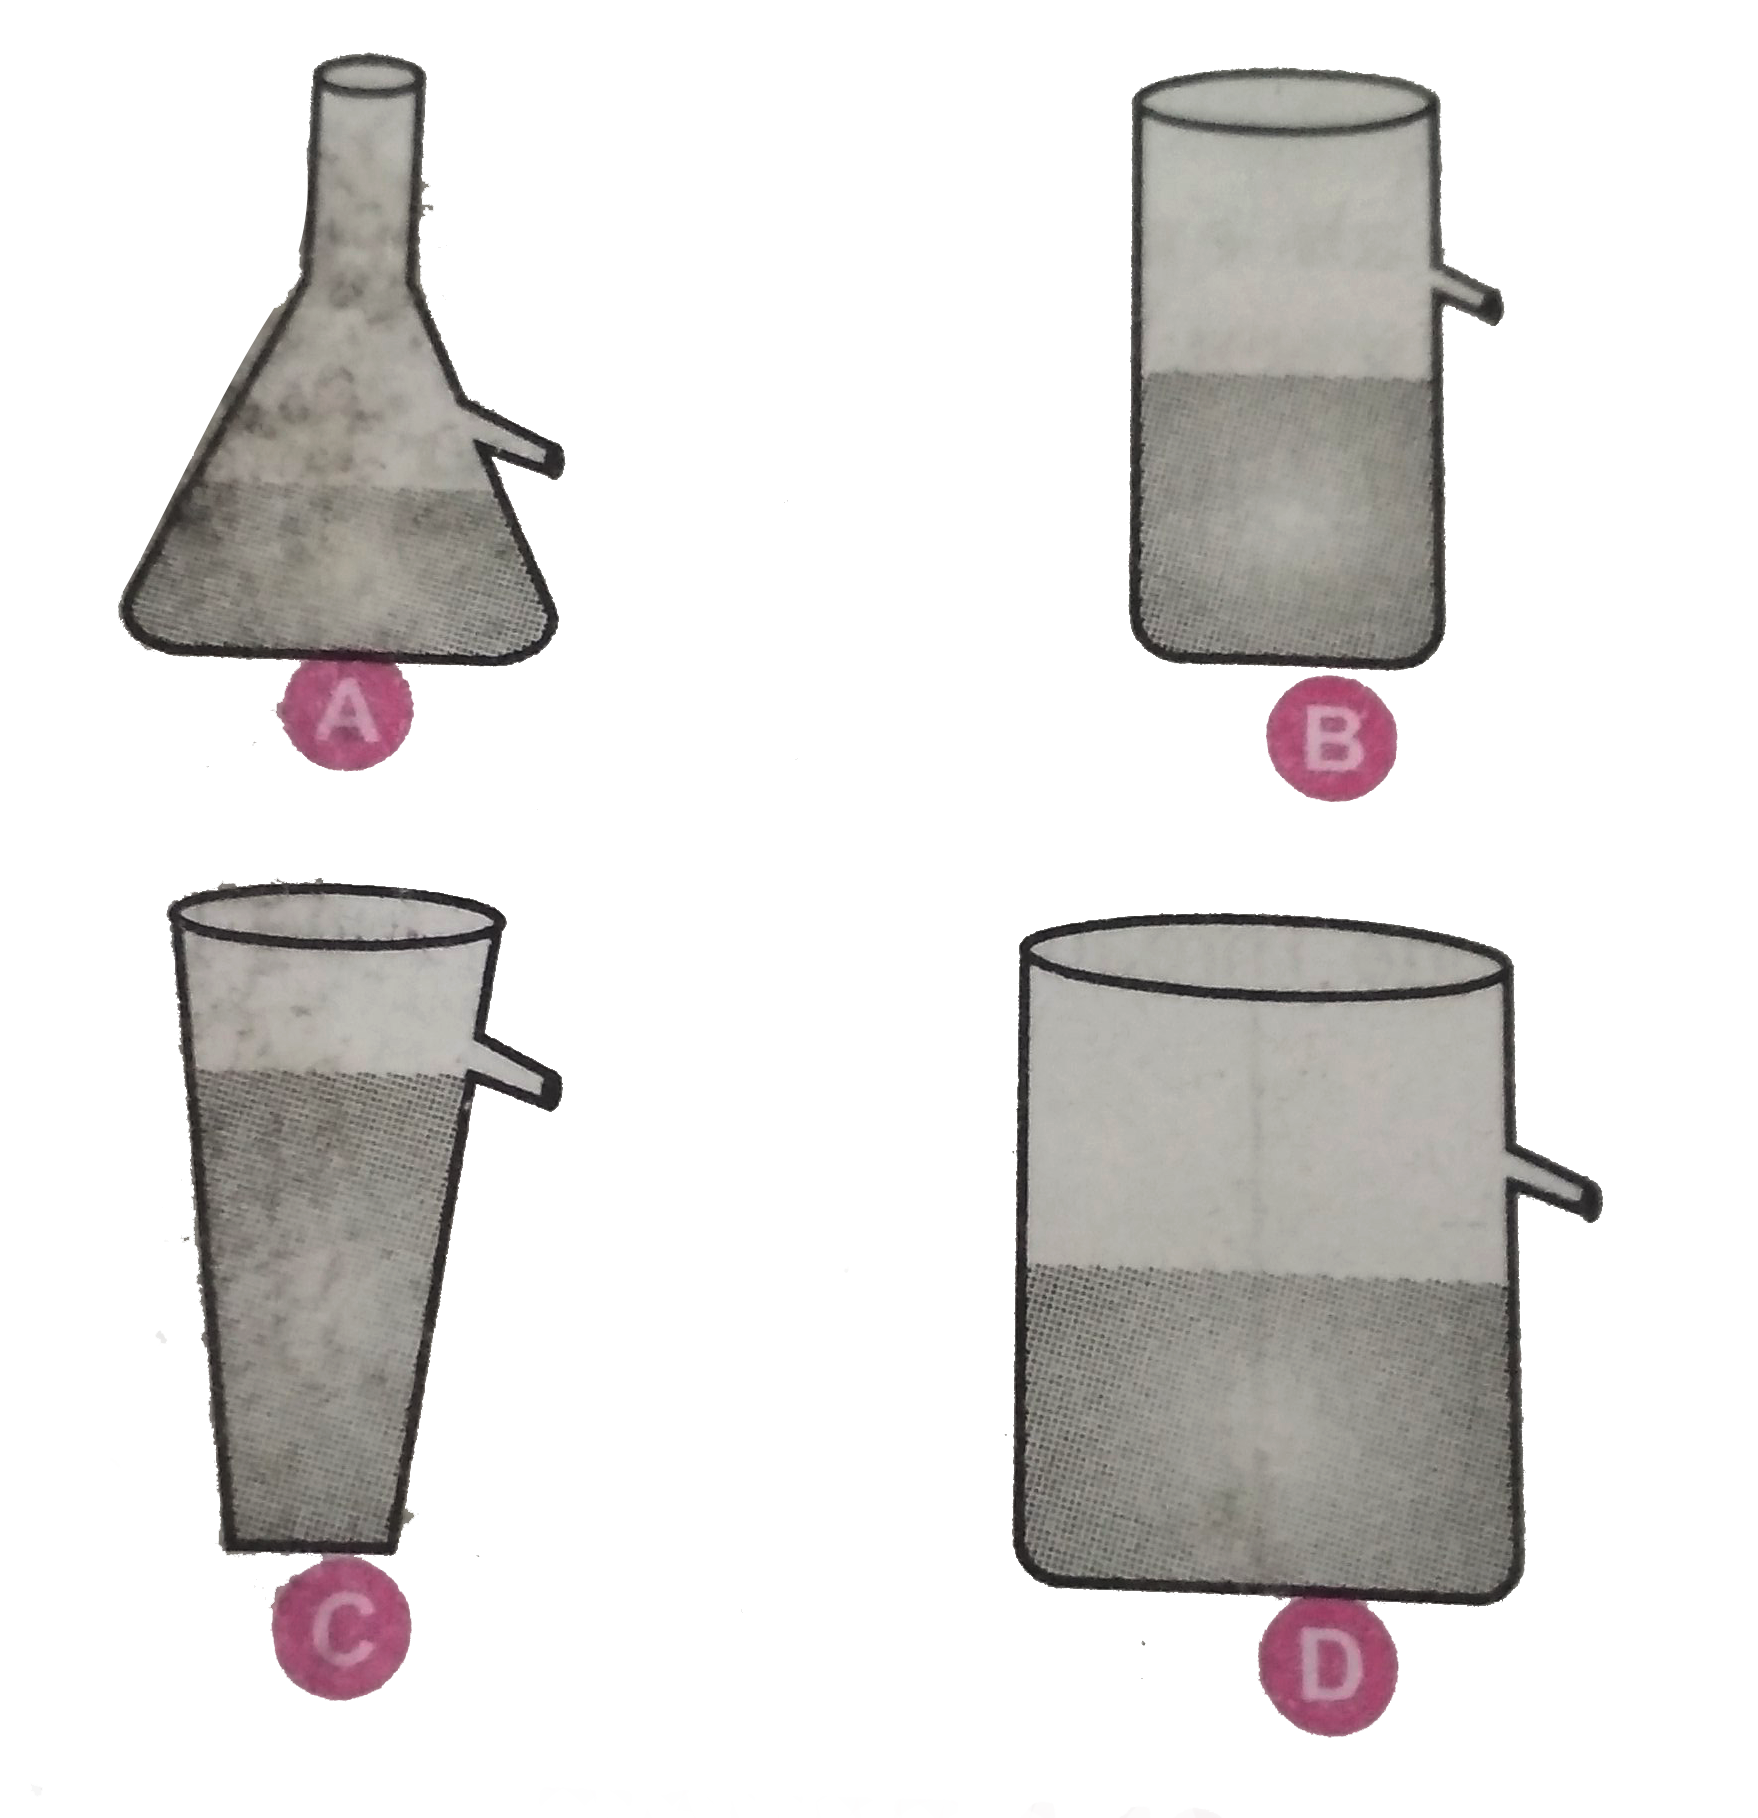
Four students A, B, C and D while performing an experiment on establishing the relation between the loss of weight of a small solid when fully immersed In tap water and the weight of water displaced by it, used four different shapes of overflow-cans containing water
The arrangement, the would give correct results, is that of student:
A
B
C
D
The correct Answer is:C
The overflow can should be filled upto the spout (the overflow tube) so that water runs out of the spout when the body (a small solid) is immerded in the overflow-can during the course of the experiment.
Topper's Solved these Questions
Similar Questions
One day all the students of class IX were performing physics experiments in the science laboratory. Just then, the physics teacher, Mr. Vinay, came to the laboratory with a sheet of tin weighing about half a kilogram. Mr. Vinay gathered all the students and in their presence put this sheet of tin in a big tub of water. The sheet of tin sank in water and settled at the bottom of tub. Mr. Vinay now turned to the students and asked who could transform this sheet into the simplest form (or shape) which would float in water. He allowed them to use any other required tools/materials from the laboratory for this purpose. Mohan offered to make an appropriate object from this tin sheet which could float in water and not sink. He took just half an hour to make this object. The teacher placed this object in the same tub of water. It started to float in water. The teacher was very happy. He appreciated the effort made by Mohan.
(a) Why did the sheet of tin sink in water?
(b) What do you think is the simplest form of object made by Mohan from this tine sheet which could float in water?
(c) Why do you think the above object made from tin sheet floats in water?
(d) Name two modes of transport used in rivers and seas which work on the same principle as the tin sheet object made by Mohan.
(e) The tine object made by Mohan was placed, turn by turn in a tub of oil and glycerine. In which of these two liquids, the tin object will float with a greater part of it immersed inside the liquid than water and why?
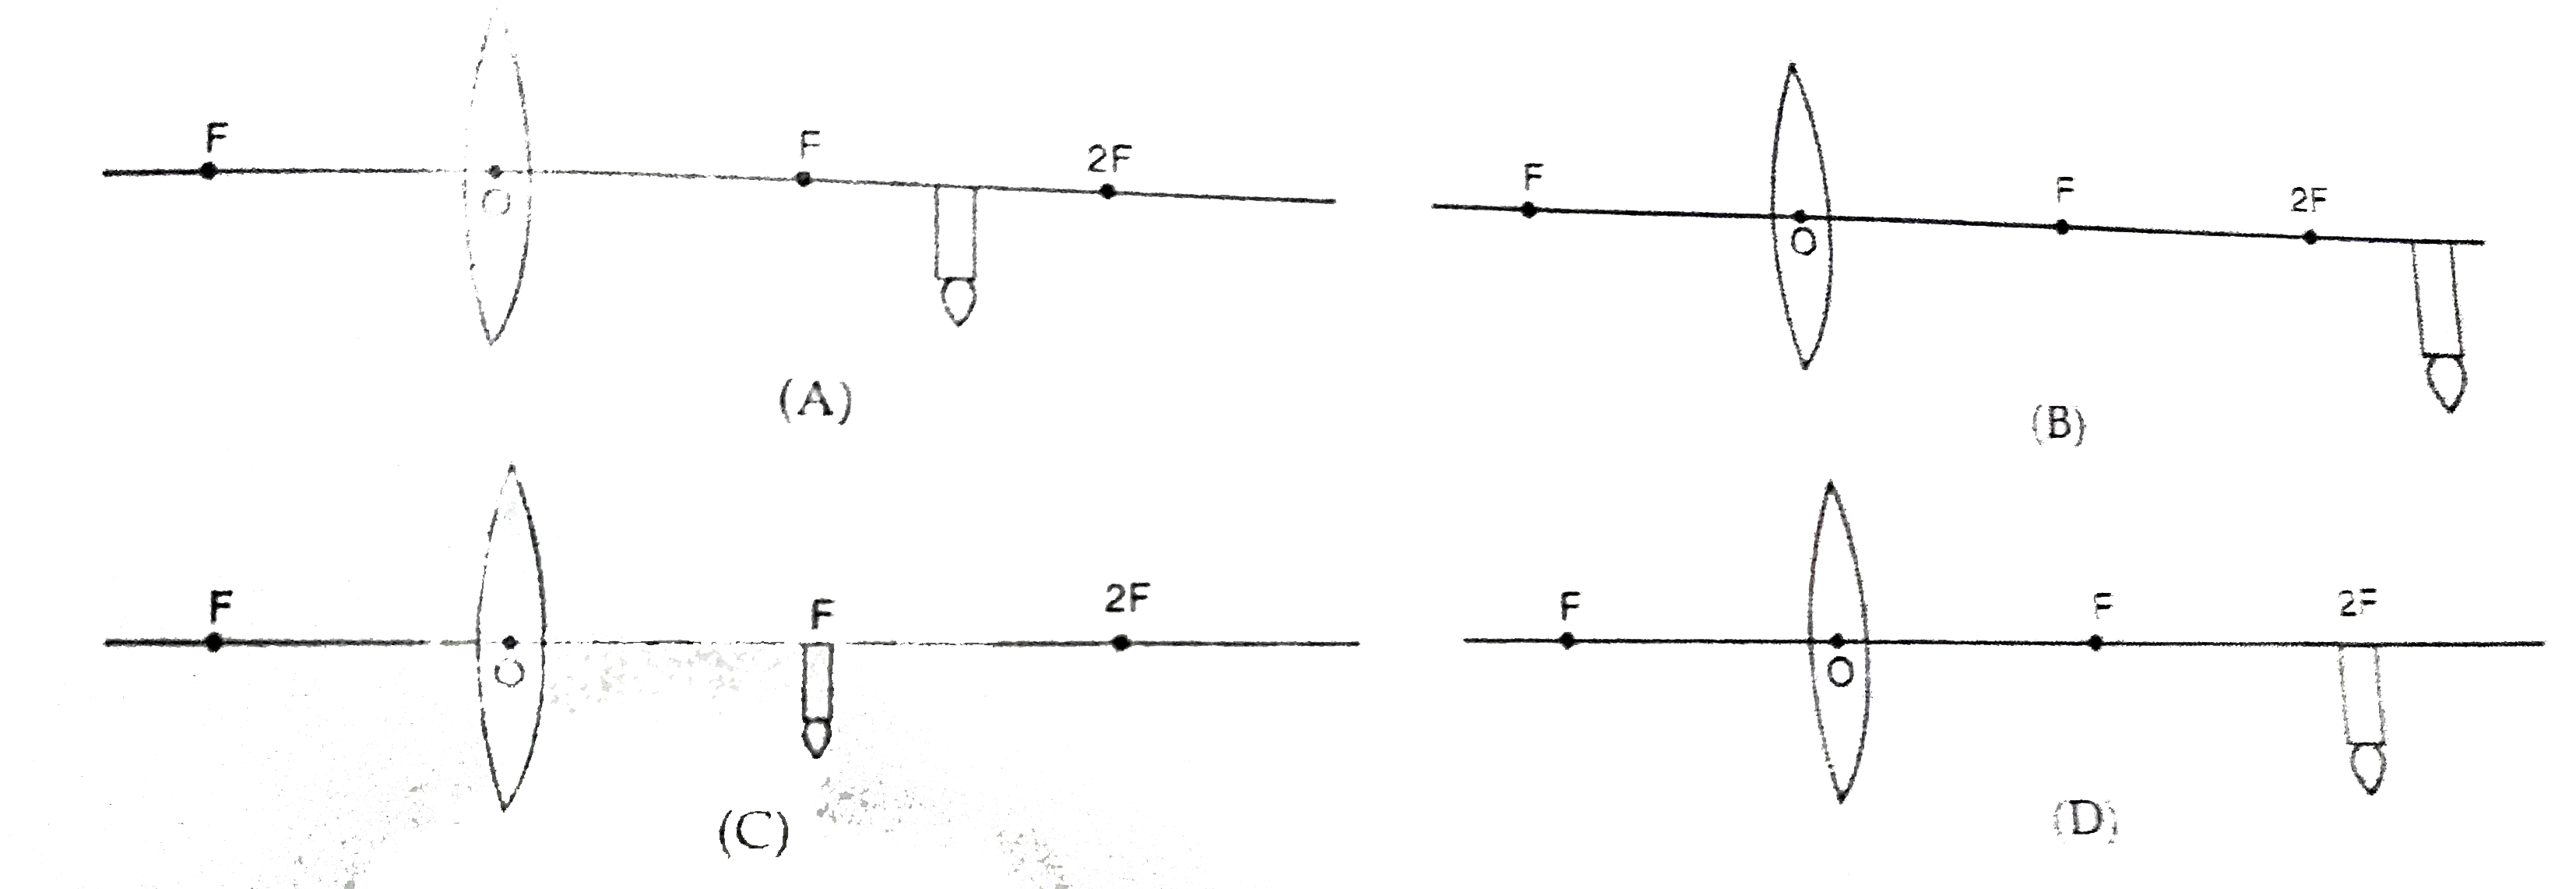
(f) What values are displayed by Mohan in this episode?View SolutionFour students A, B, C and D performed an experiment to determine the focal length of a convex lens by using a lighted candle kept at a considerable distance as the object. They represented the position fo image by drawing the following diagrams :
Which diagram describes the correct position of image of the candle ?
 View Solution
Knowledge Check
- Question 1 - Select One

Four students A, B, C and D while performing an experiment on establishing the relation between the loss of weight of a small solid when fully immersed In tap water and the weight of water displaced by it, used four different shapes of overflow-cans containing water
The arrangement, the would give correct results, is that of student:AABBCCDD - Question 2 - Select One
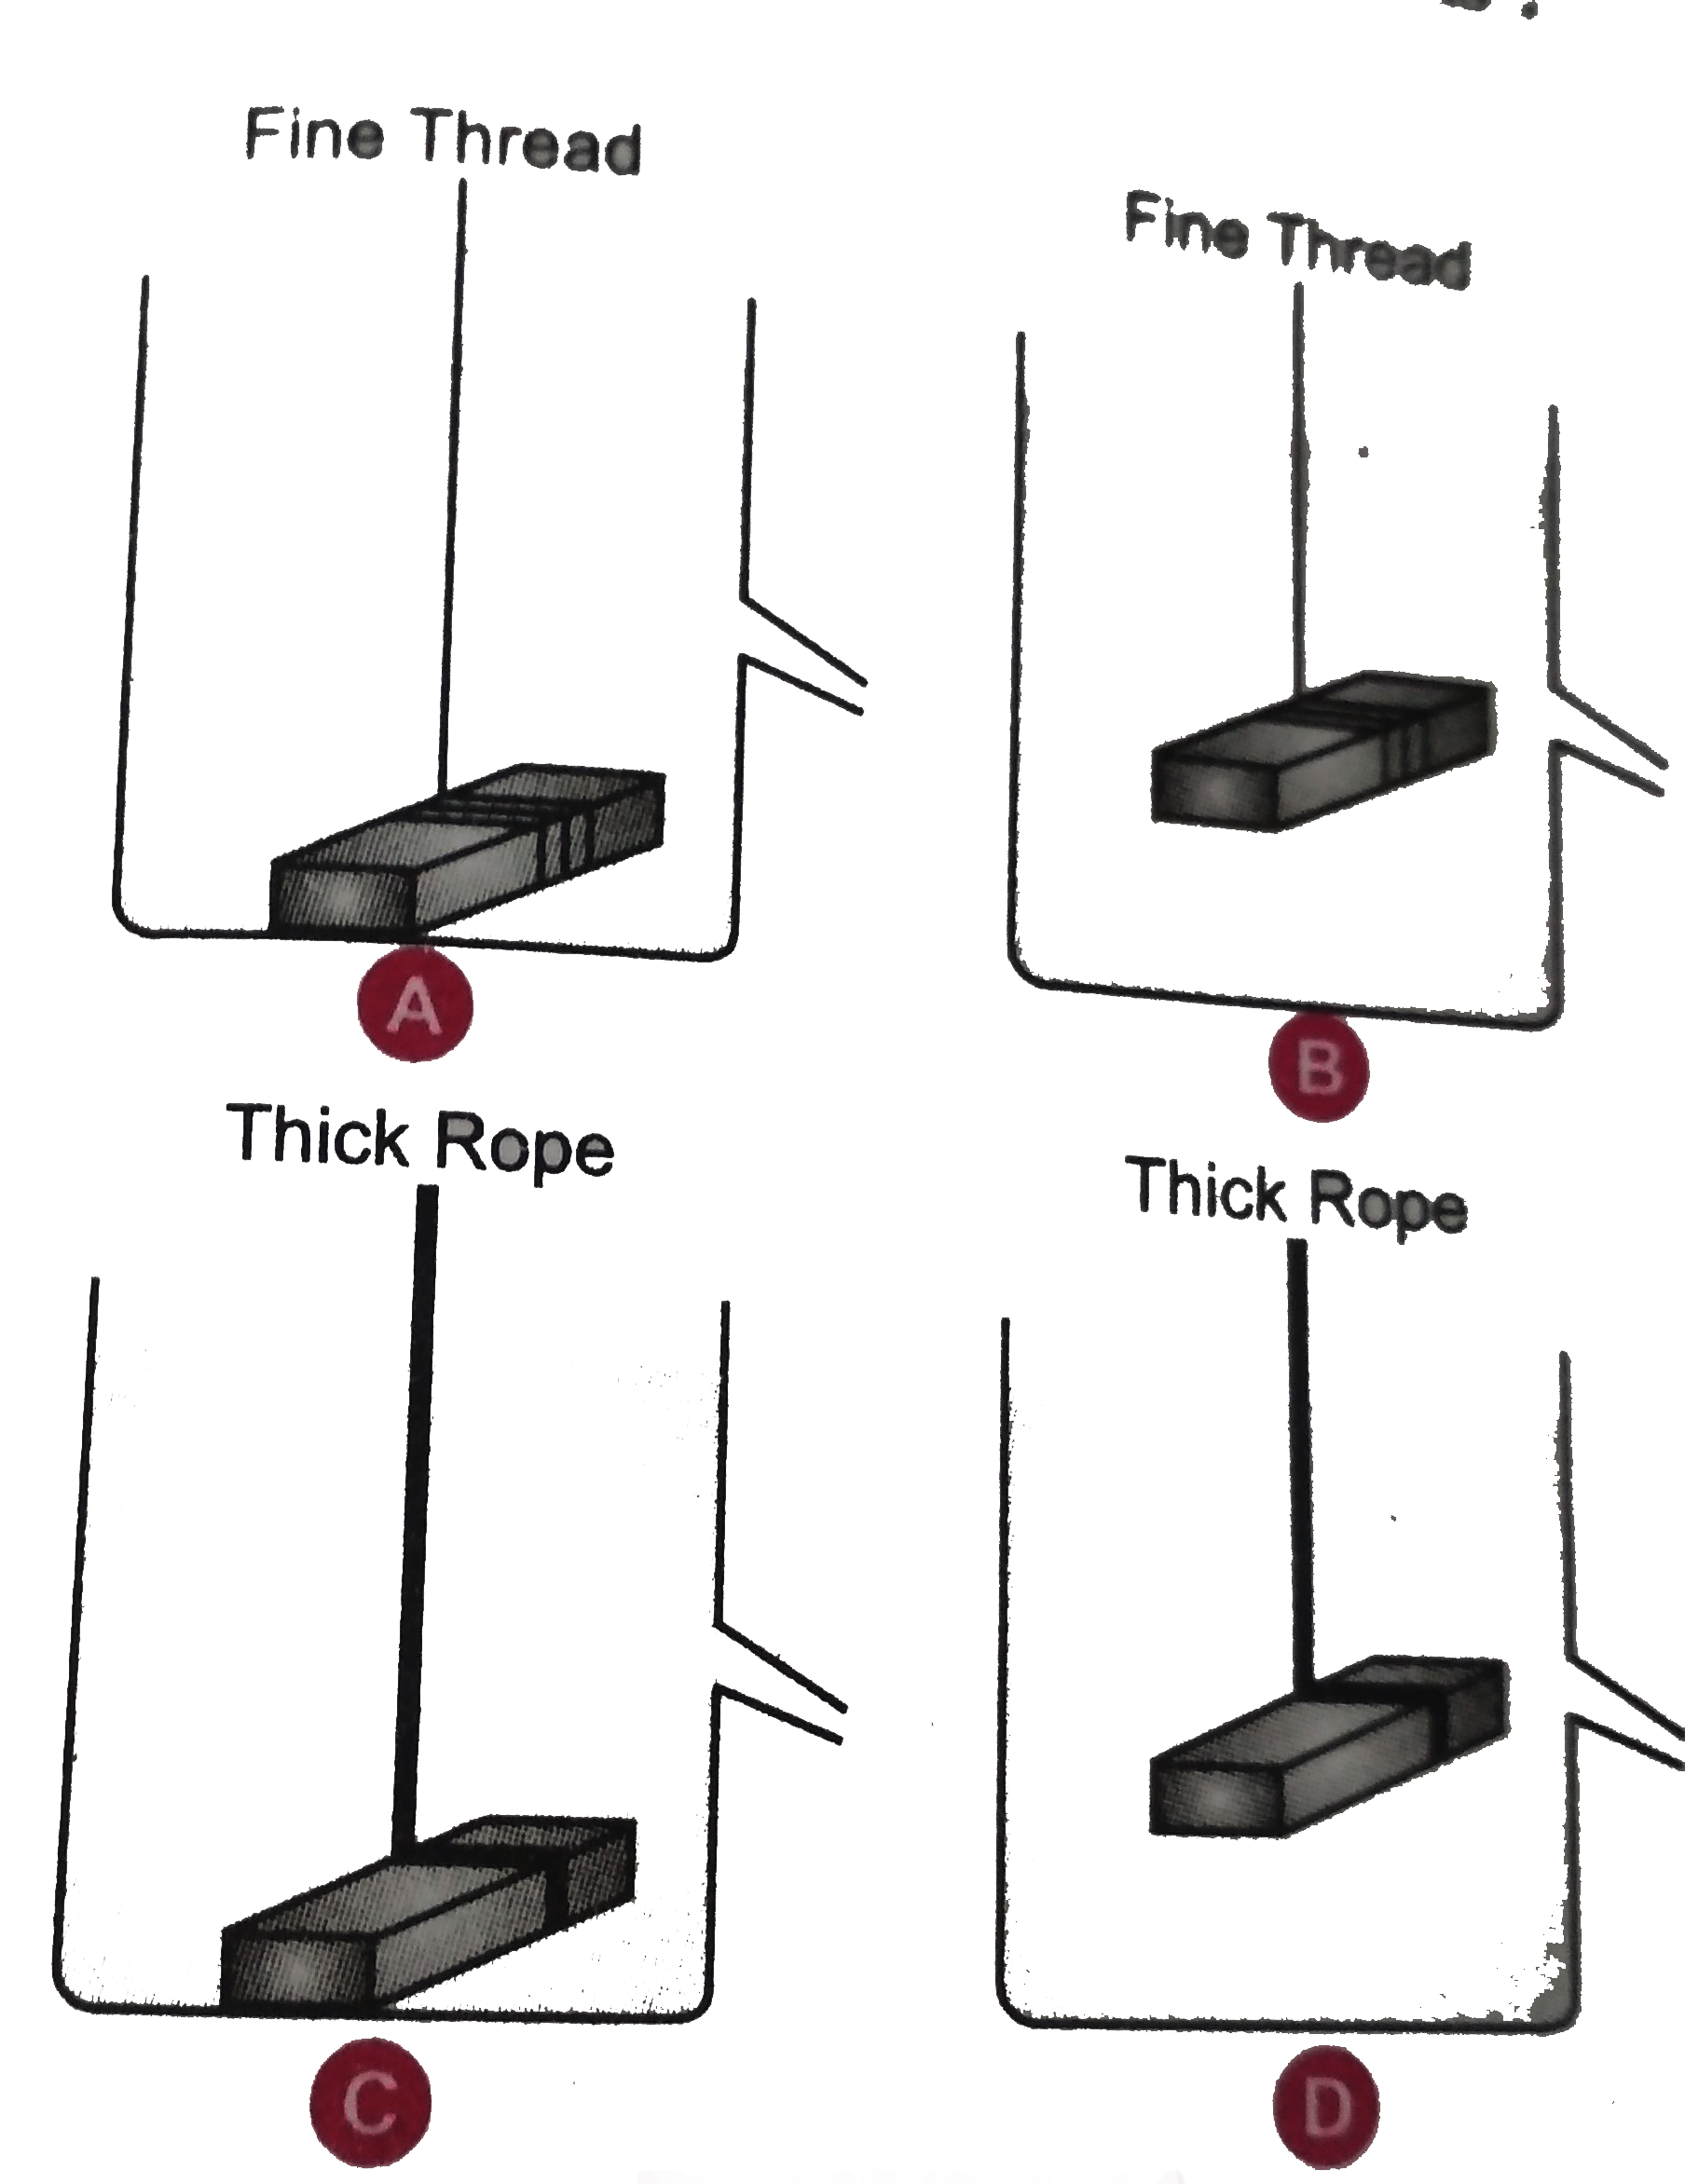
In an experiment of establish relationship between loss in weight of an immersed soild with the weight of water displaced by it, the correct set-up shown in Fig.AABBCCDD - Question 3 - Select One
Four vessels A, B, C and D have different shapes and hold different amount of water. Which of the following is correct.
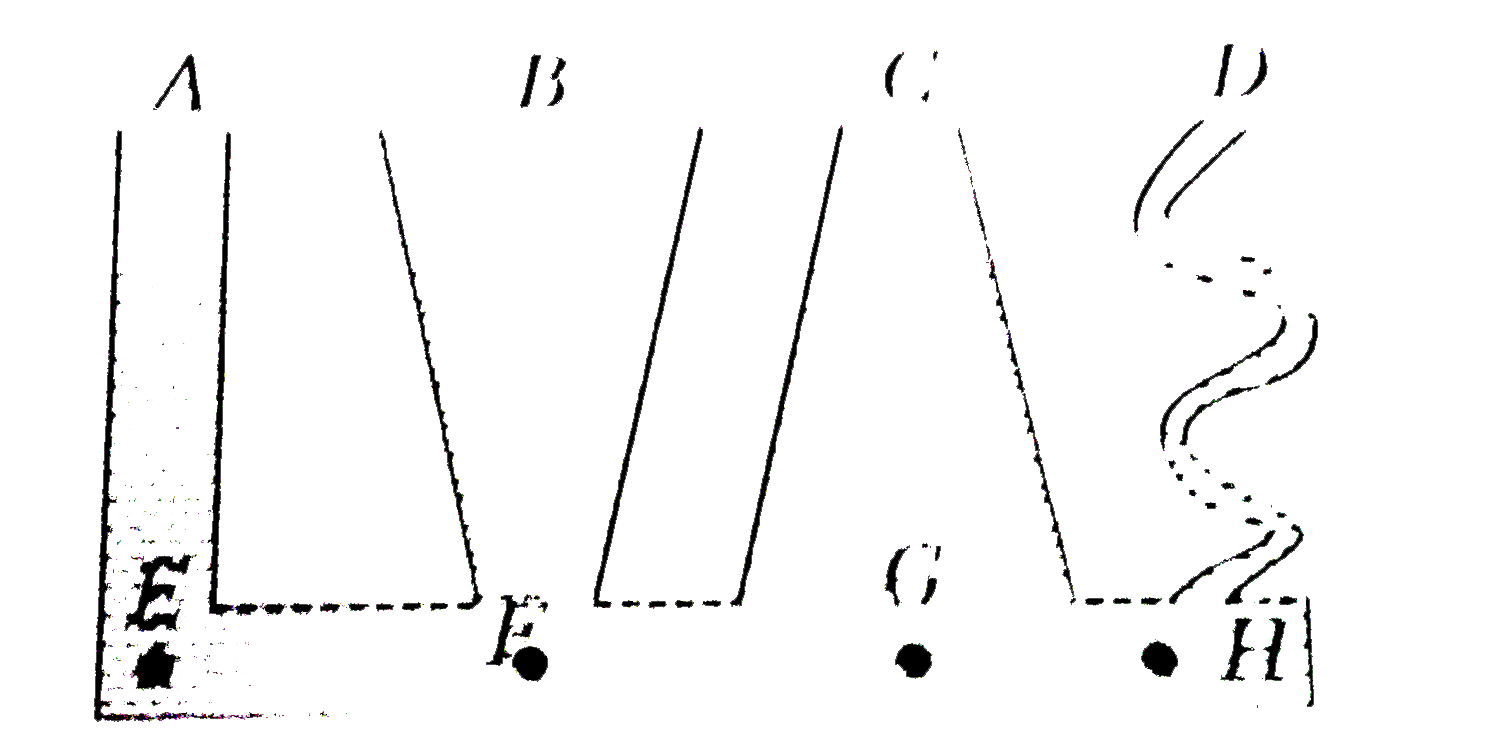 APE>PF>PG>PHBPE<PF<PG<PHCPE=PF=PG=PHDPE=PF>PG=PH
Four students A, B, C and D performed the experiment to determine the focal length of a concave mirror by obtaining the image of a distant tree on a screen. They measured the distances between the screen and the mirror as shown in the diagrams given below :

The correct value for focal length will be obtained by the student :View SolutionFour student A,B,C and D performed an experiment to detemine the focal length of a concave mirror by using a lighted candle kept at a considerable distance as the object. They represented the position of image by drawing the following diagrams :
Which diagram describes the correct position of the image of the candle ?
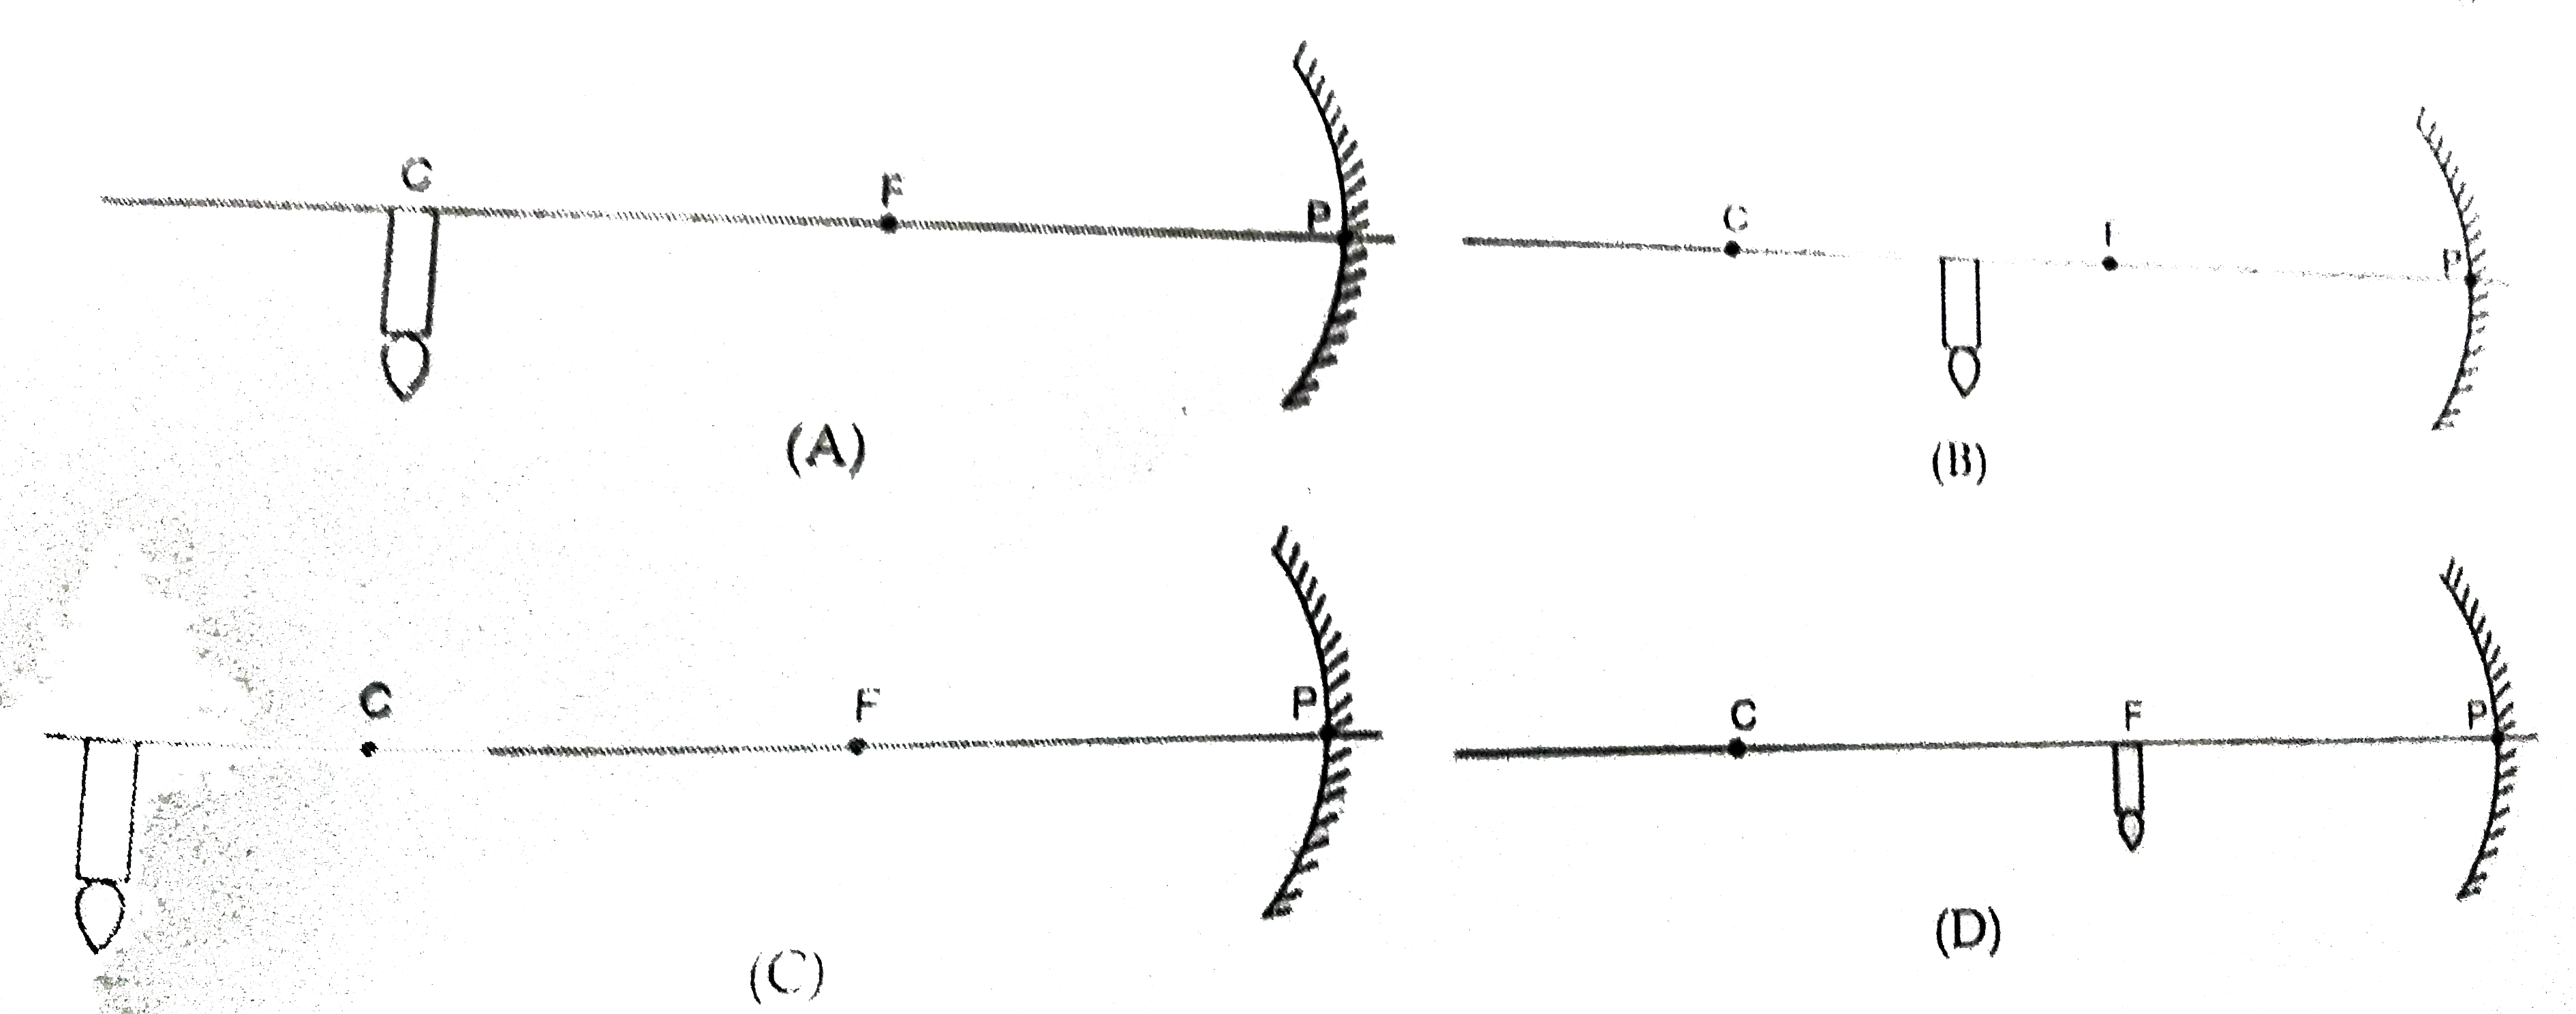 View Solution
Three students A,BandC determined the volume of a solid by immersing it in water in the overflow cans set up The result obtained will be wrong for :
(A)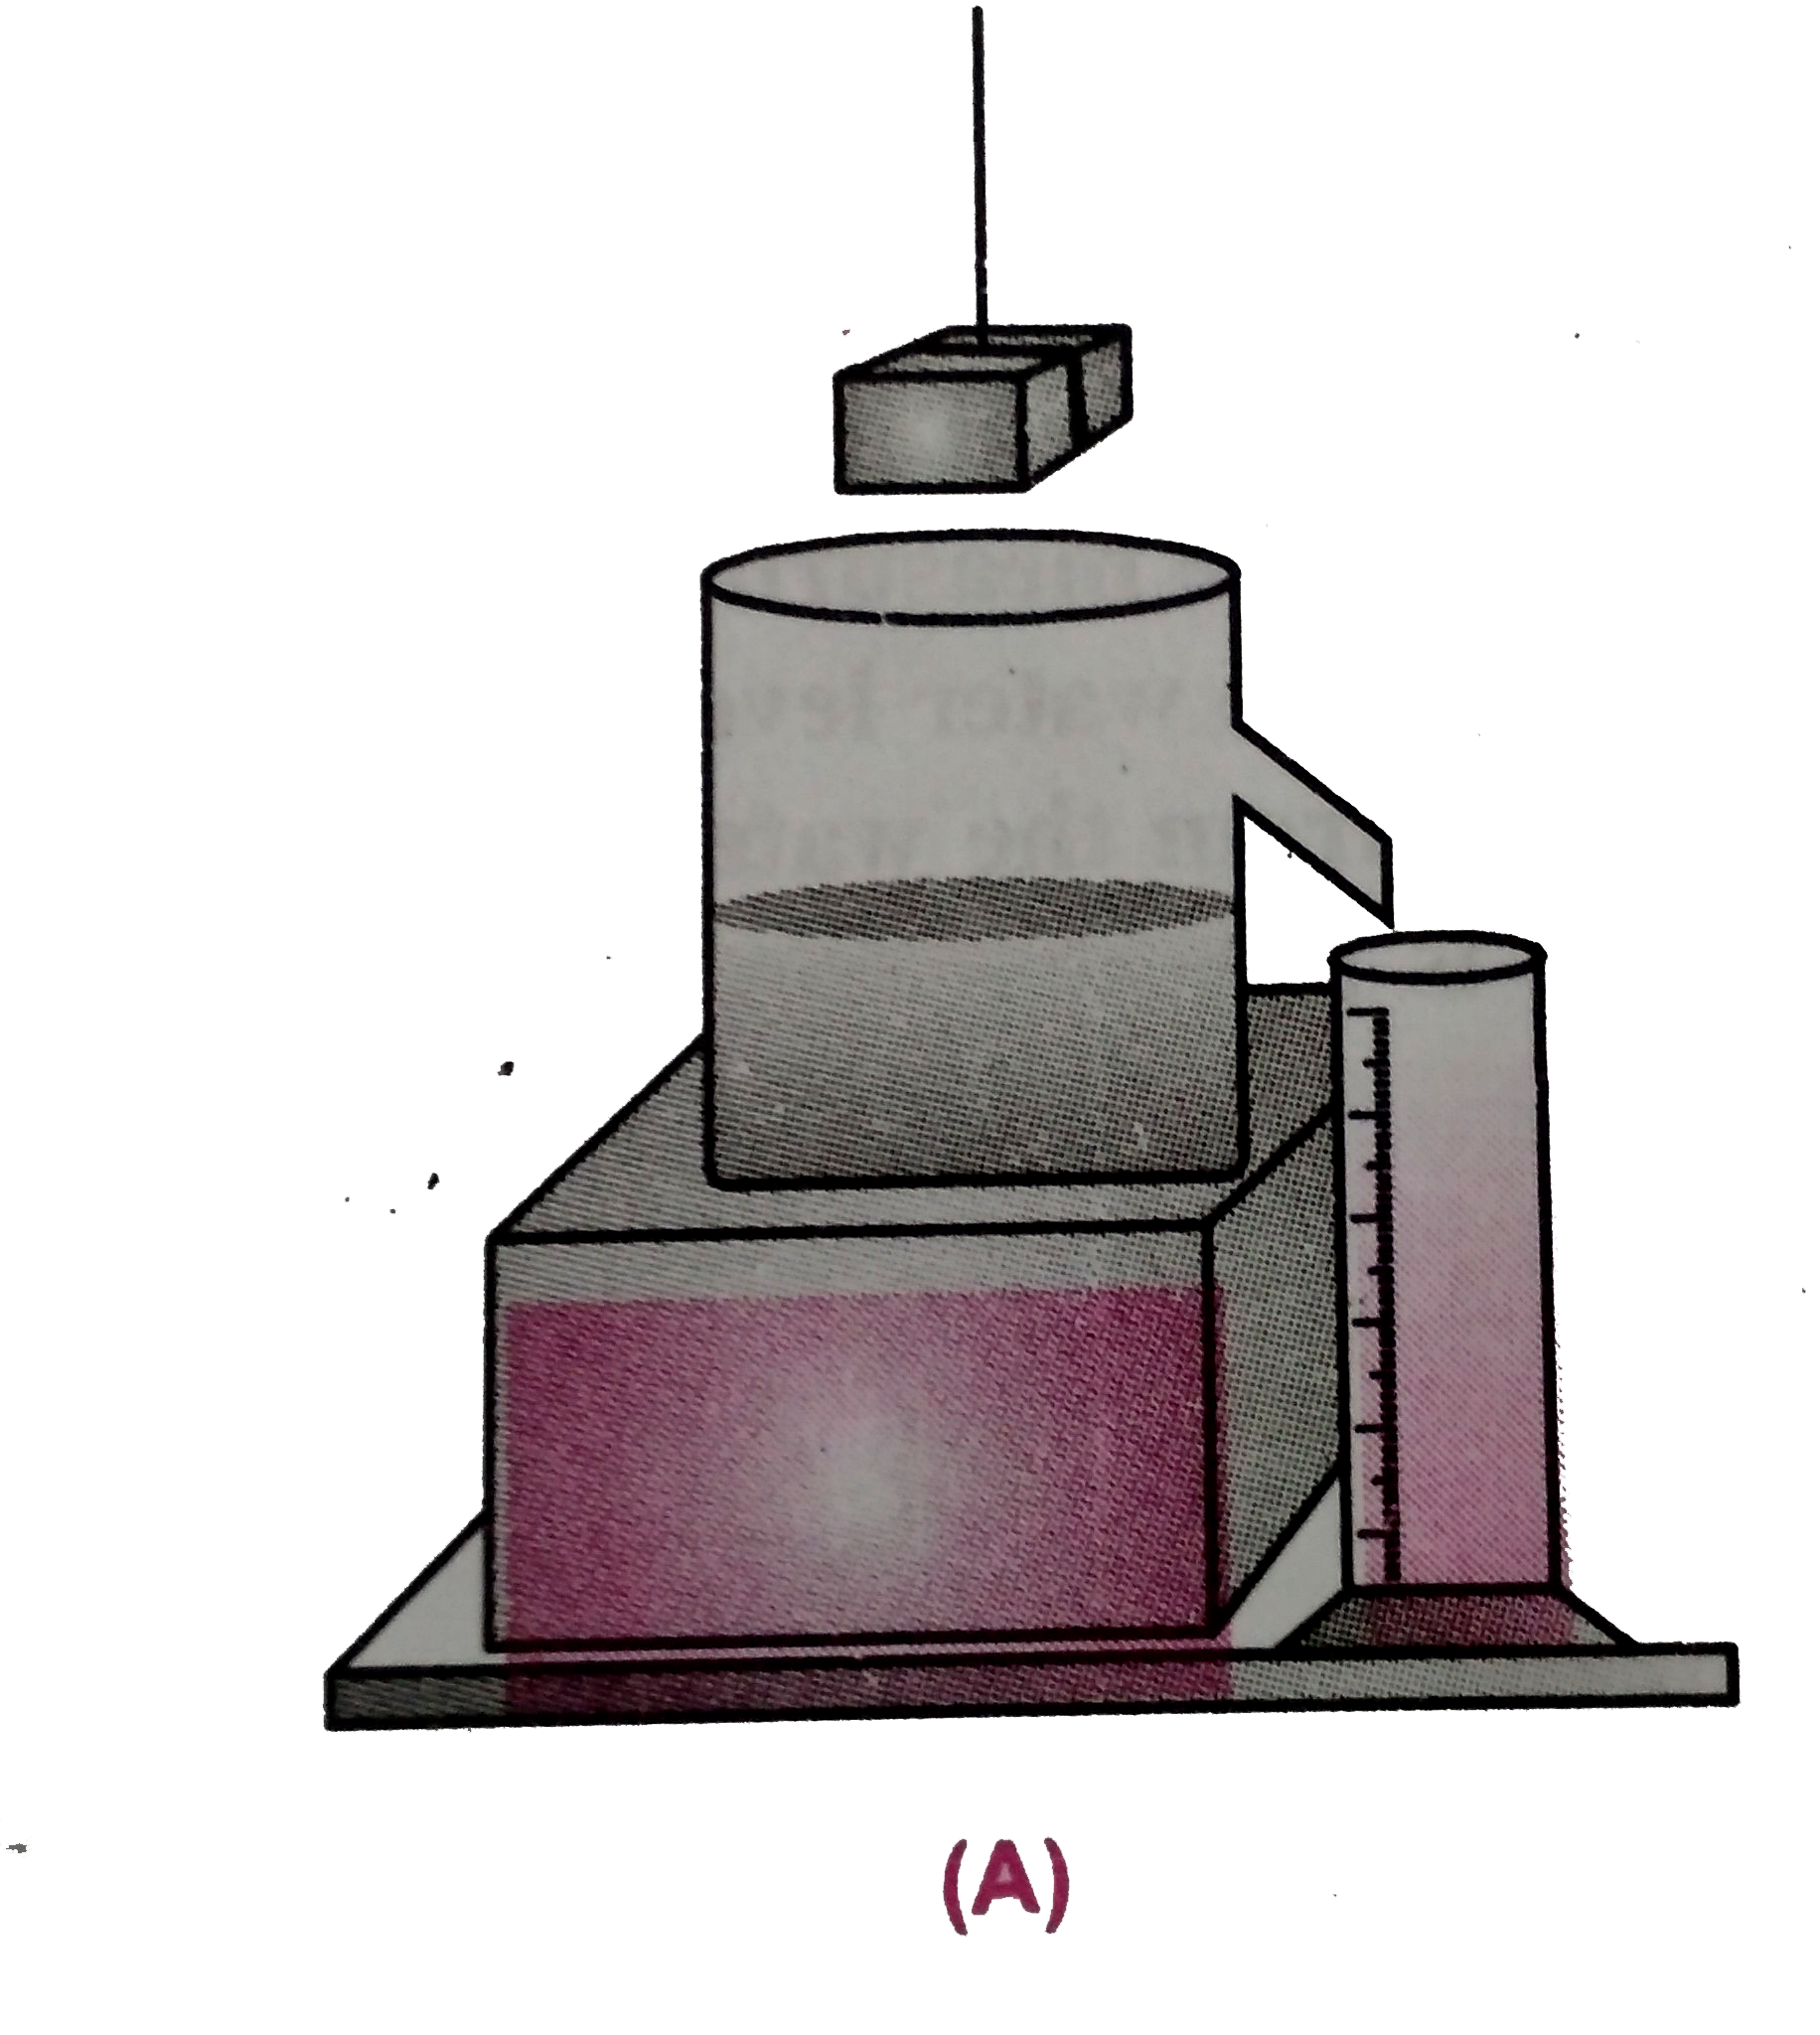 ,
,
(B)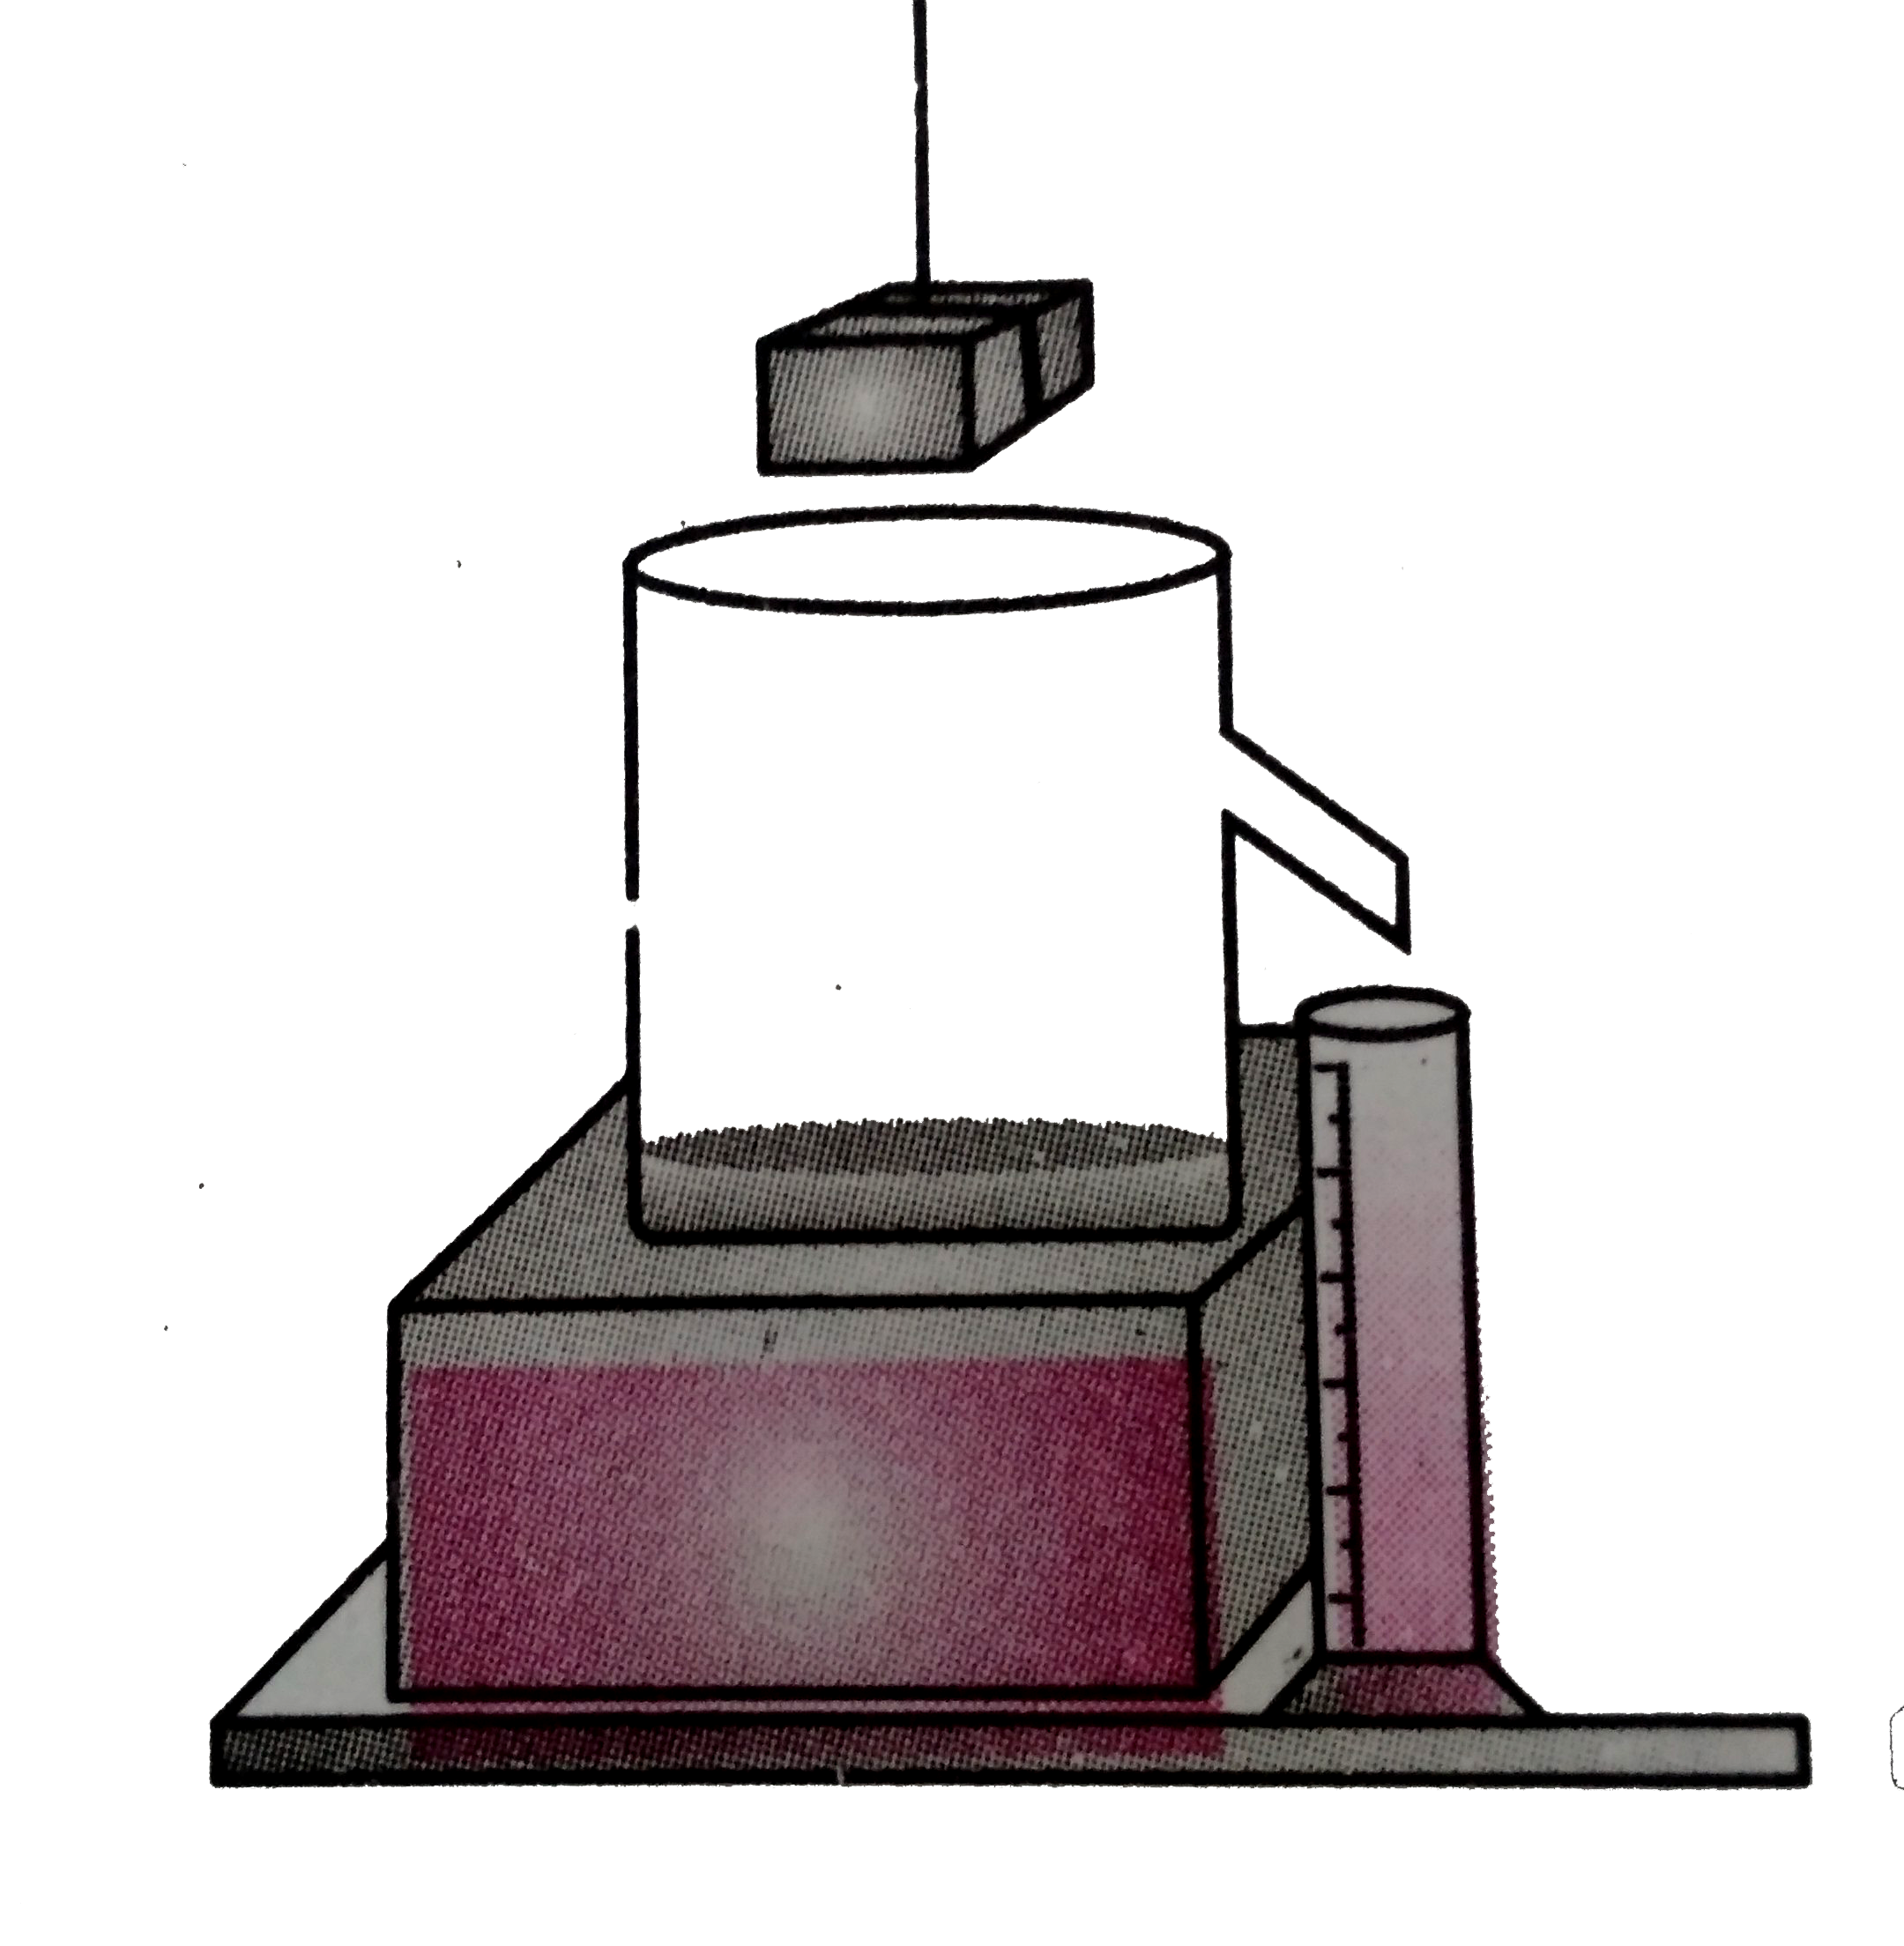 ,
,
(C)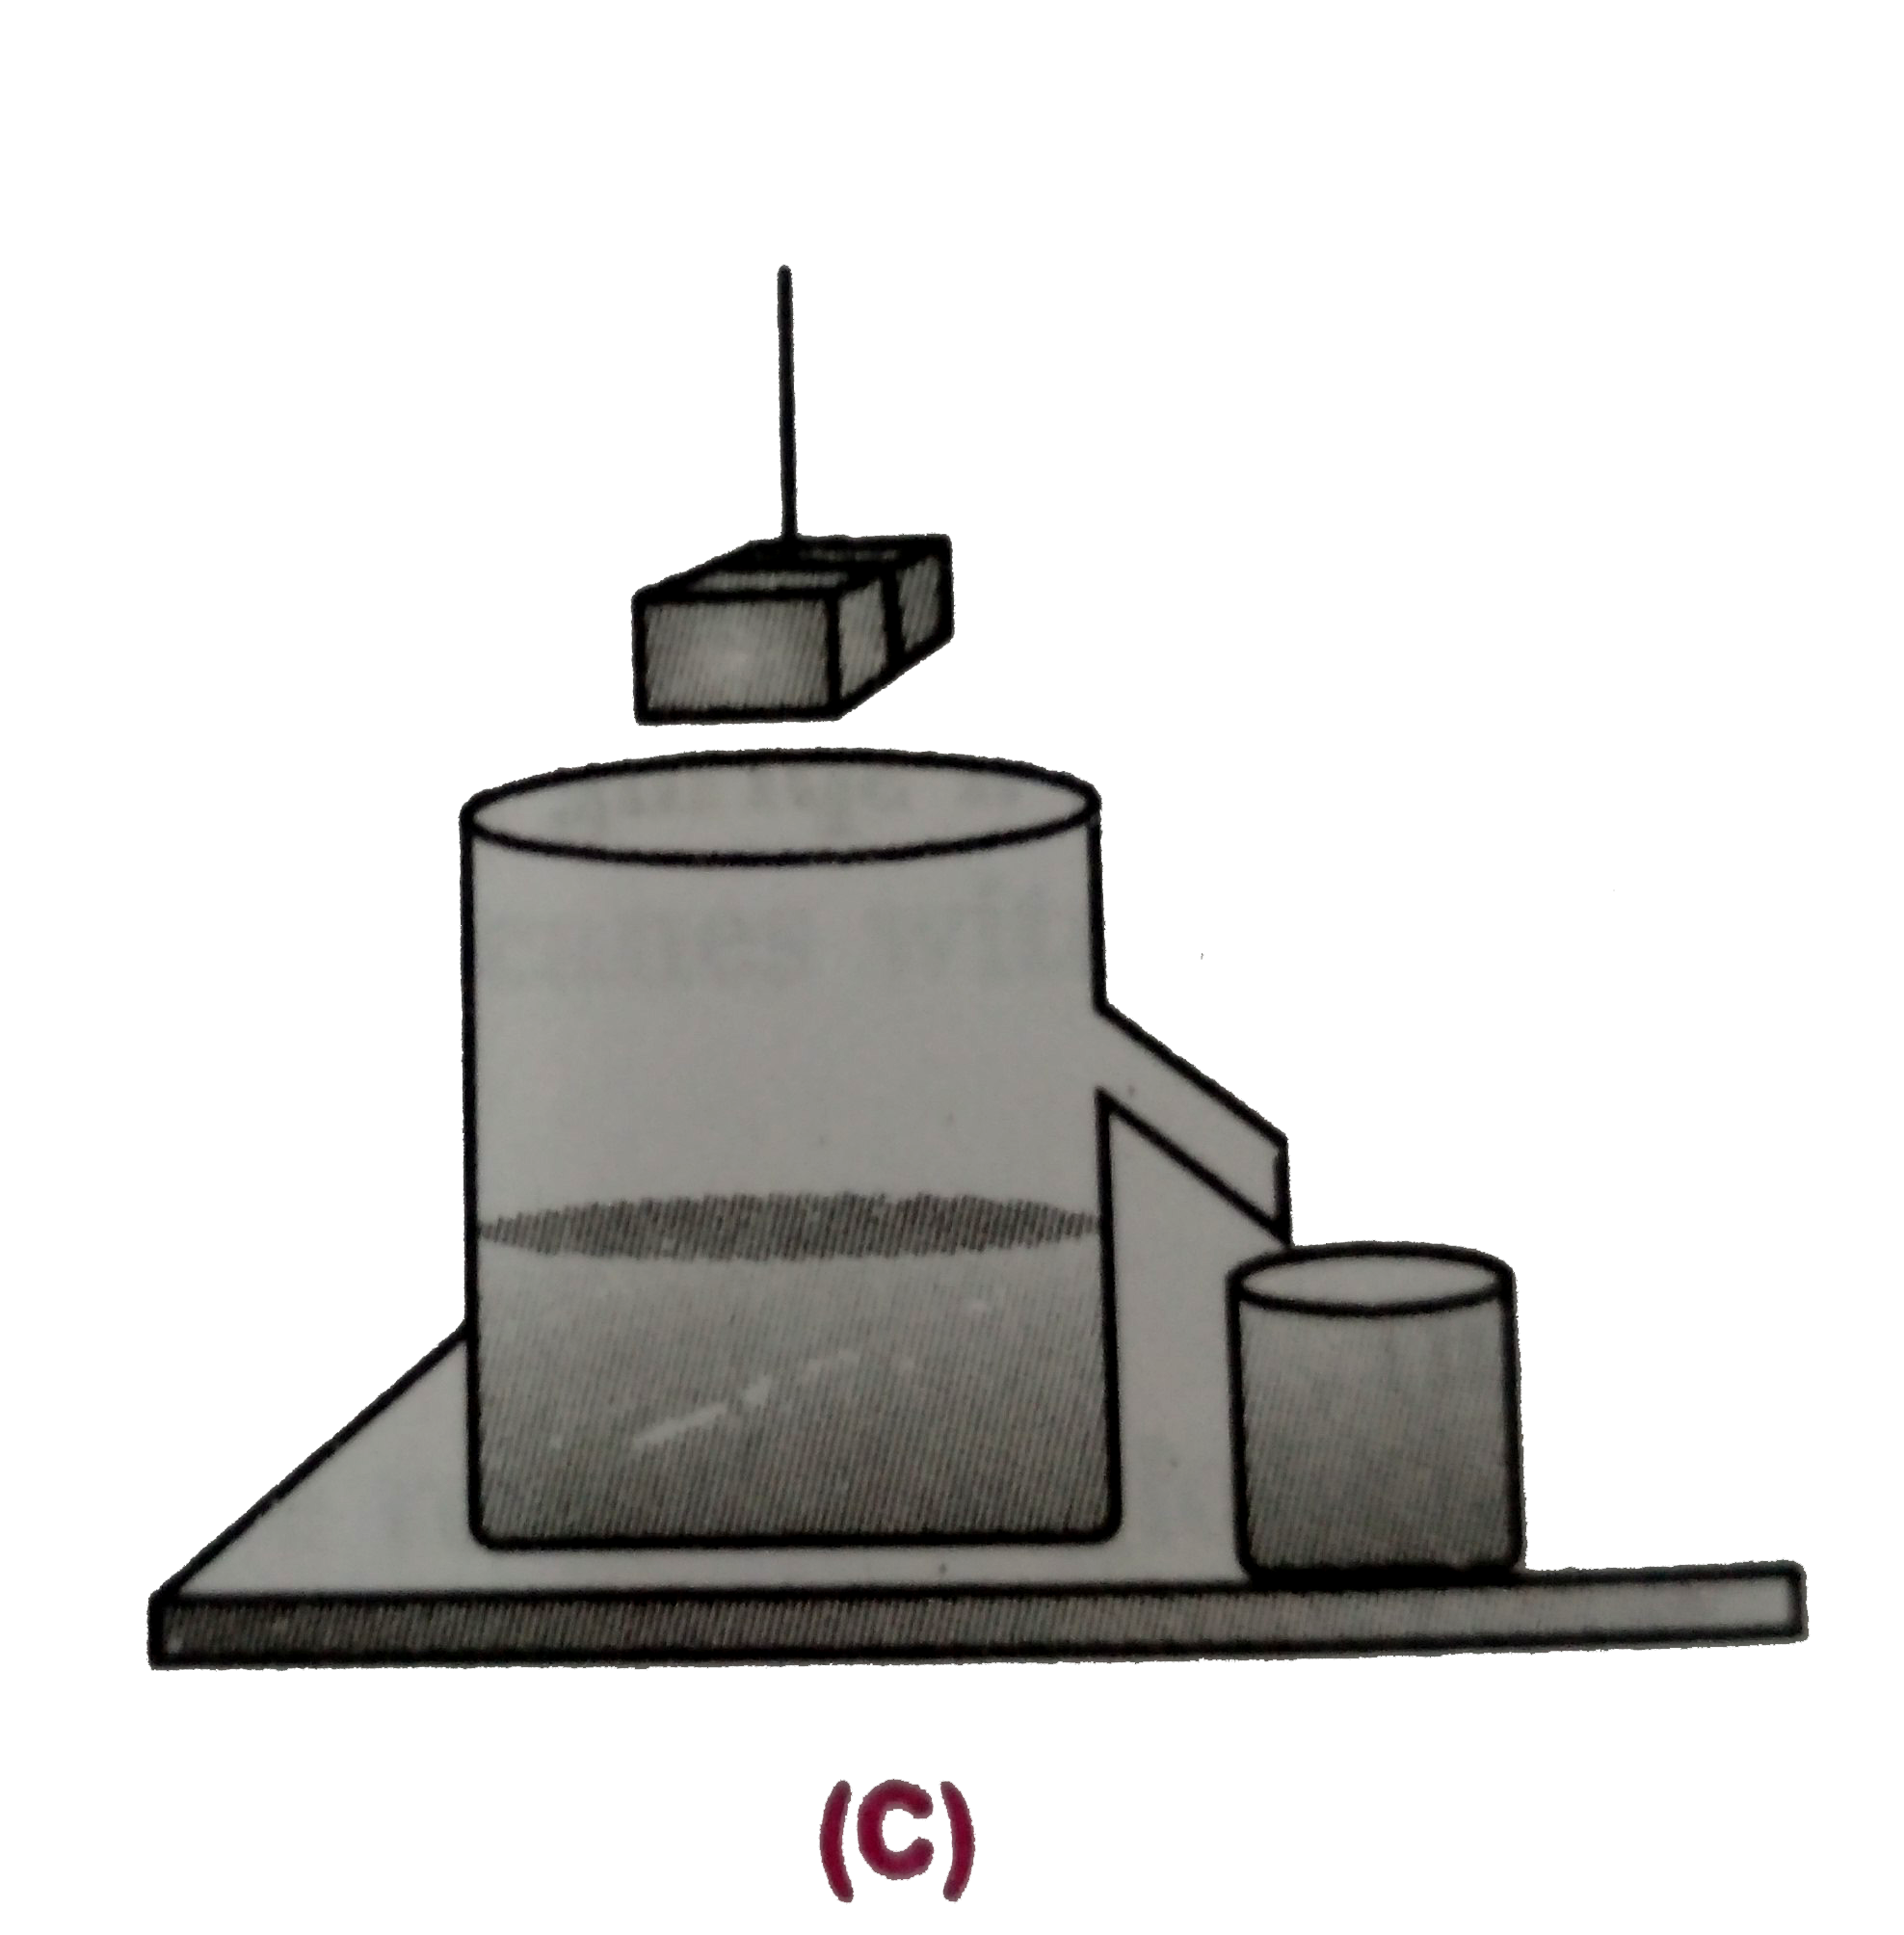 .View Solution
Four students (A), (B), (C) and (D) independently observed the evaporation of water under different conditions, and recorded the temperature of water at regular interval as shown below

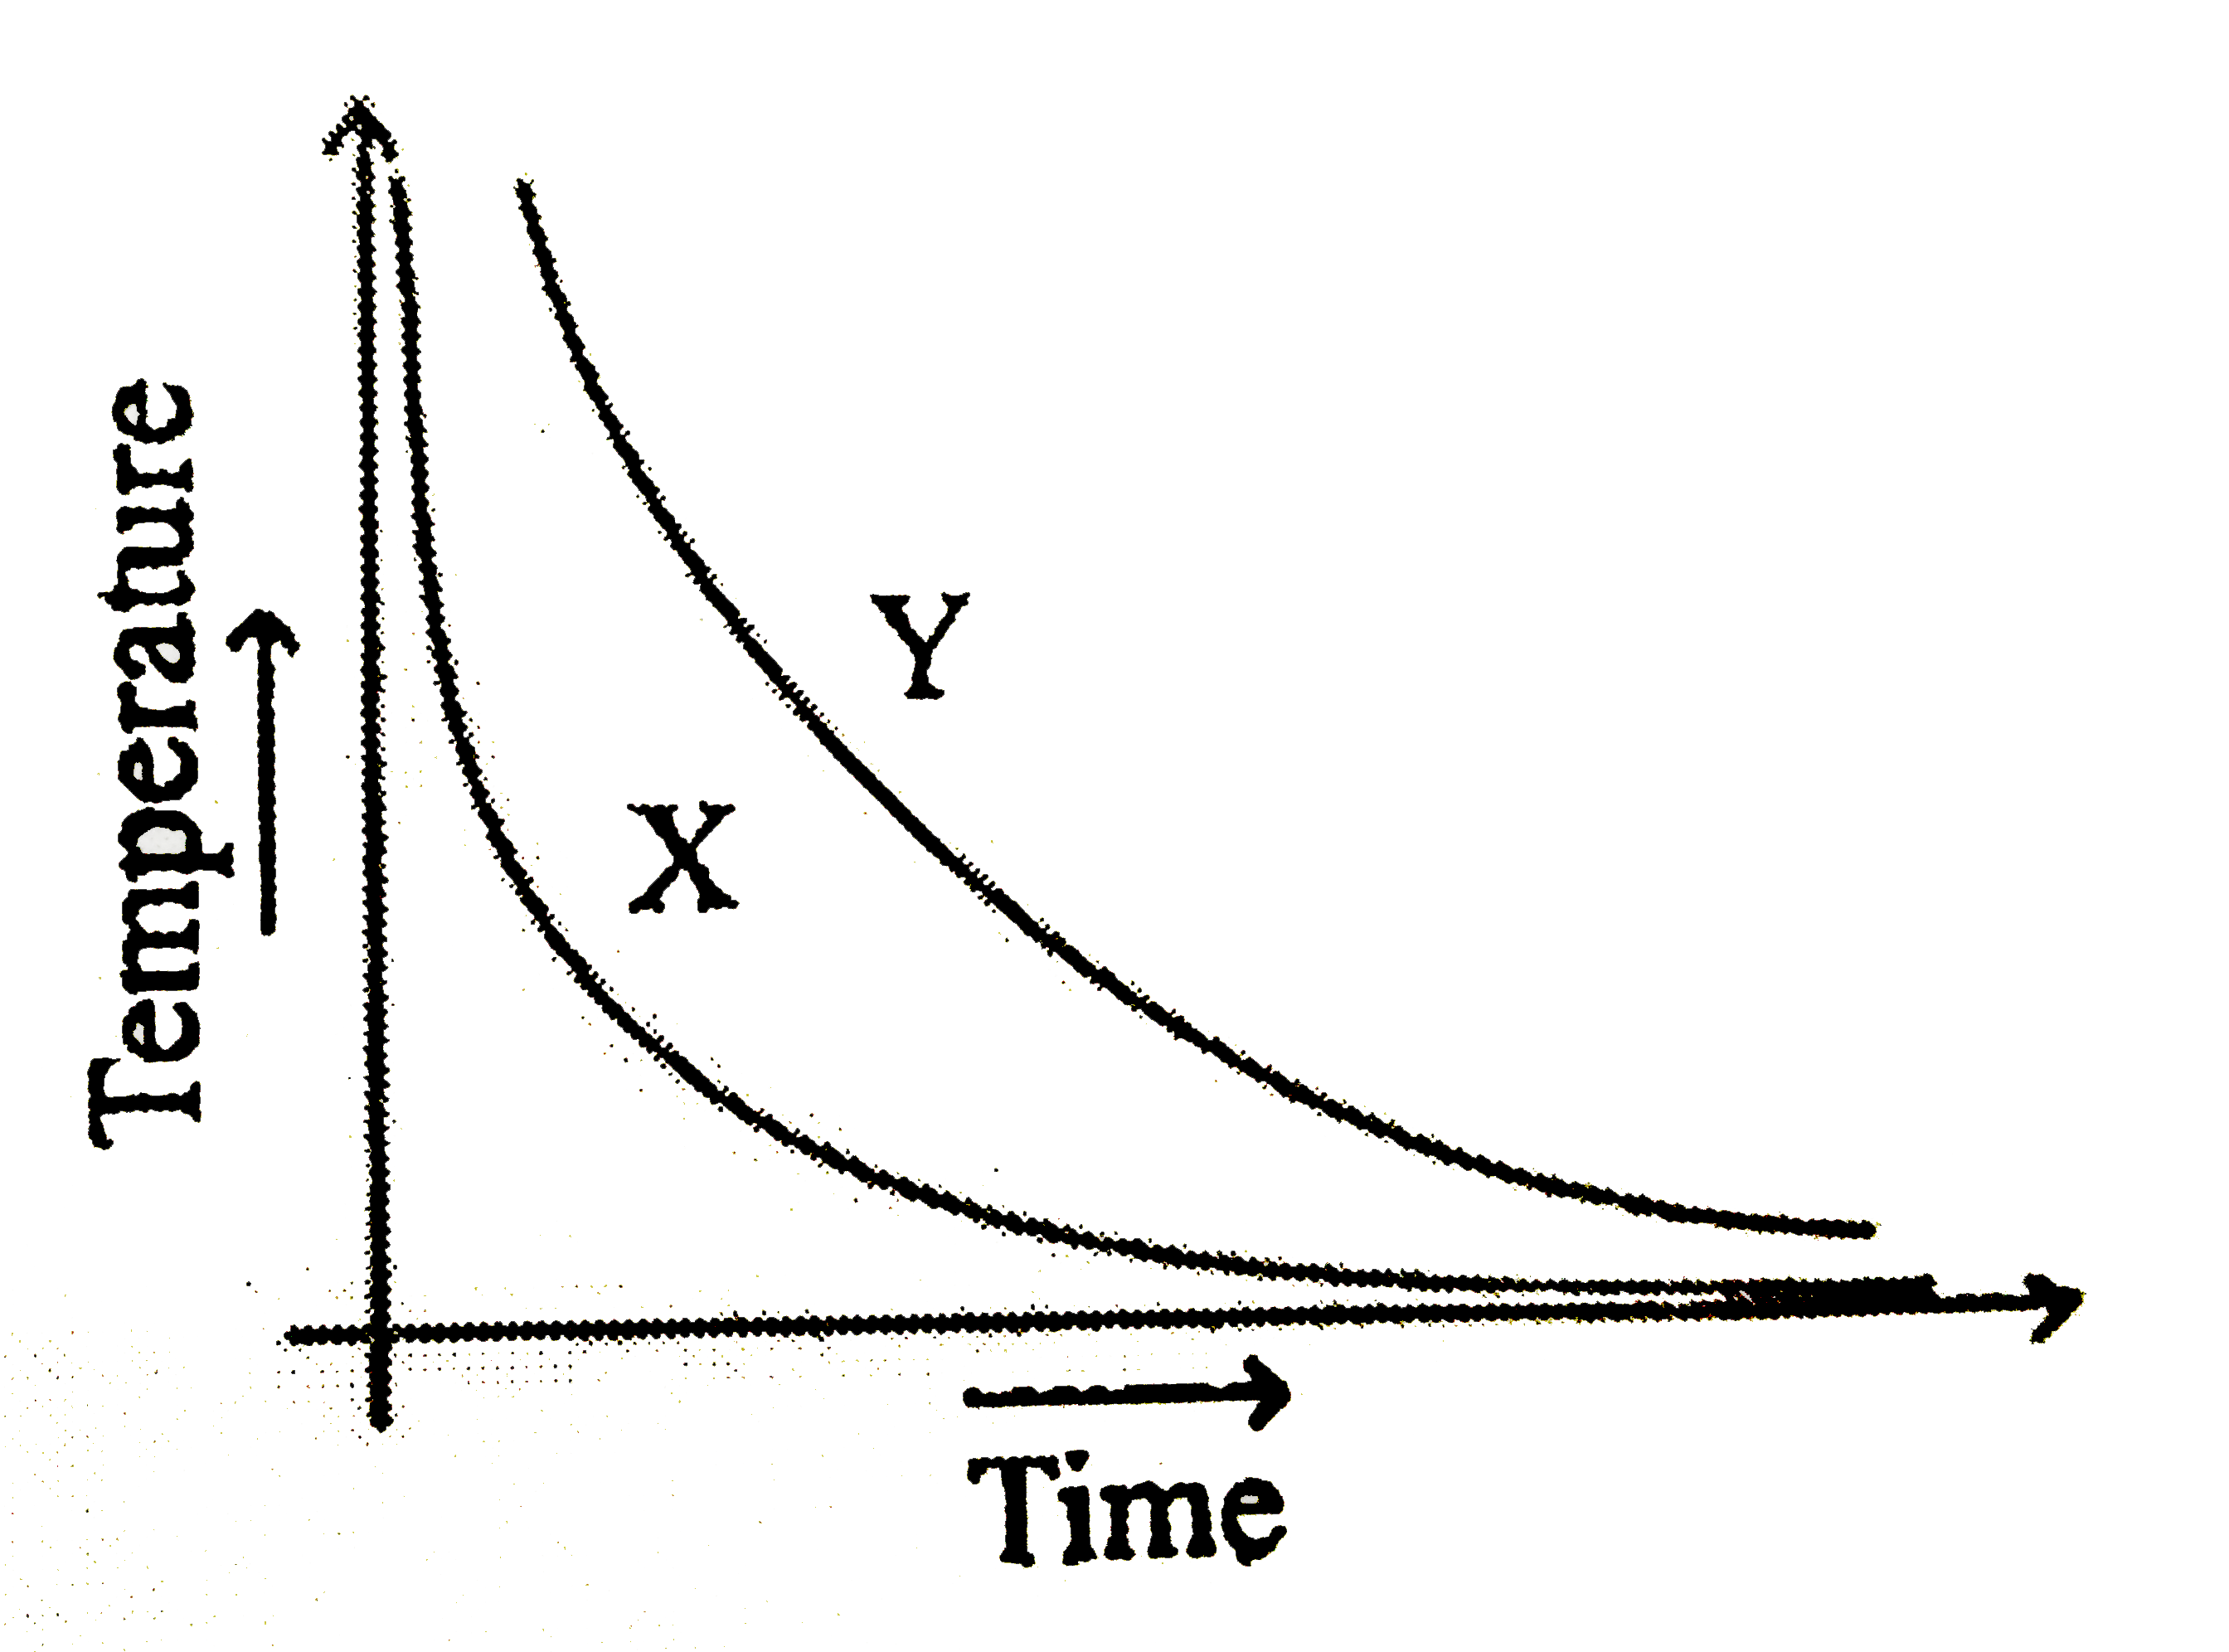
The correct recording of observations is that of the student :View SolutionTwo students X and Y have to do their experiment on plotting the temperature-time graph for a hot body as it cools to room temperature. They do their experiments in the same lab, using completely identical apparatus, take equal amounts of tap water heated up to the same temperature, start their observations simultaneously and note the temperature values at identically spaced intervals of time. Their temperature-time graphs, plotted on a given graph paper, with the same given choices of scales along the axis, are however, as shown: The following could be the reason for this difference:
(A) Use of an overhead fan by student X.
(B) Use of an overhead fan by student Y.
(C) Less frequent stirring of water by student X.
(D) Less frequent stirring of water by student Y.
The most likely reason is:
 View Solution

