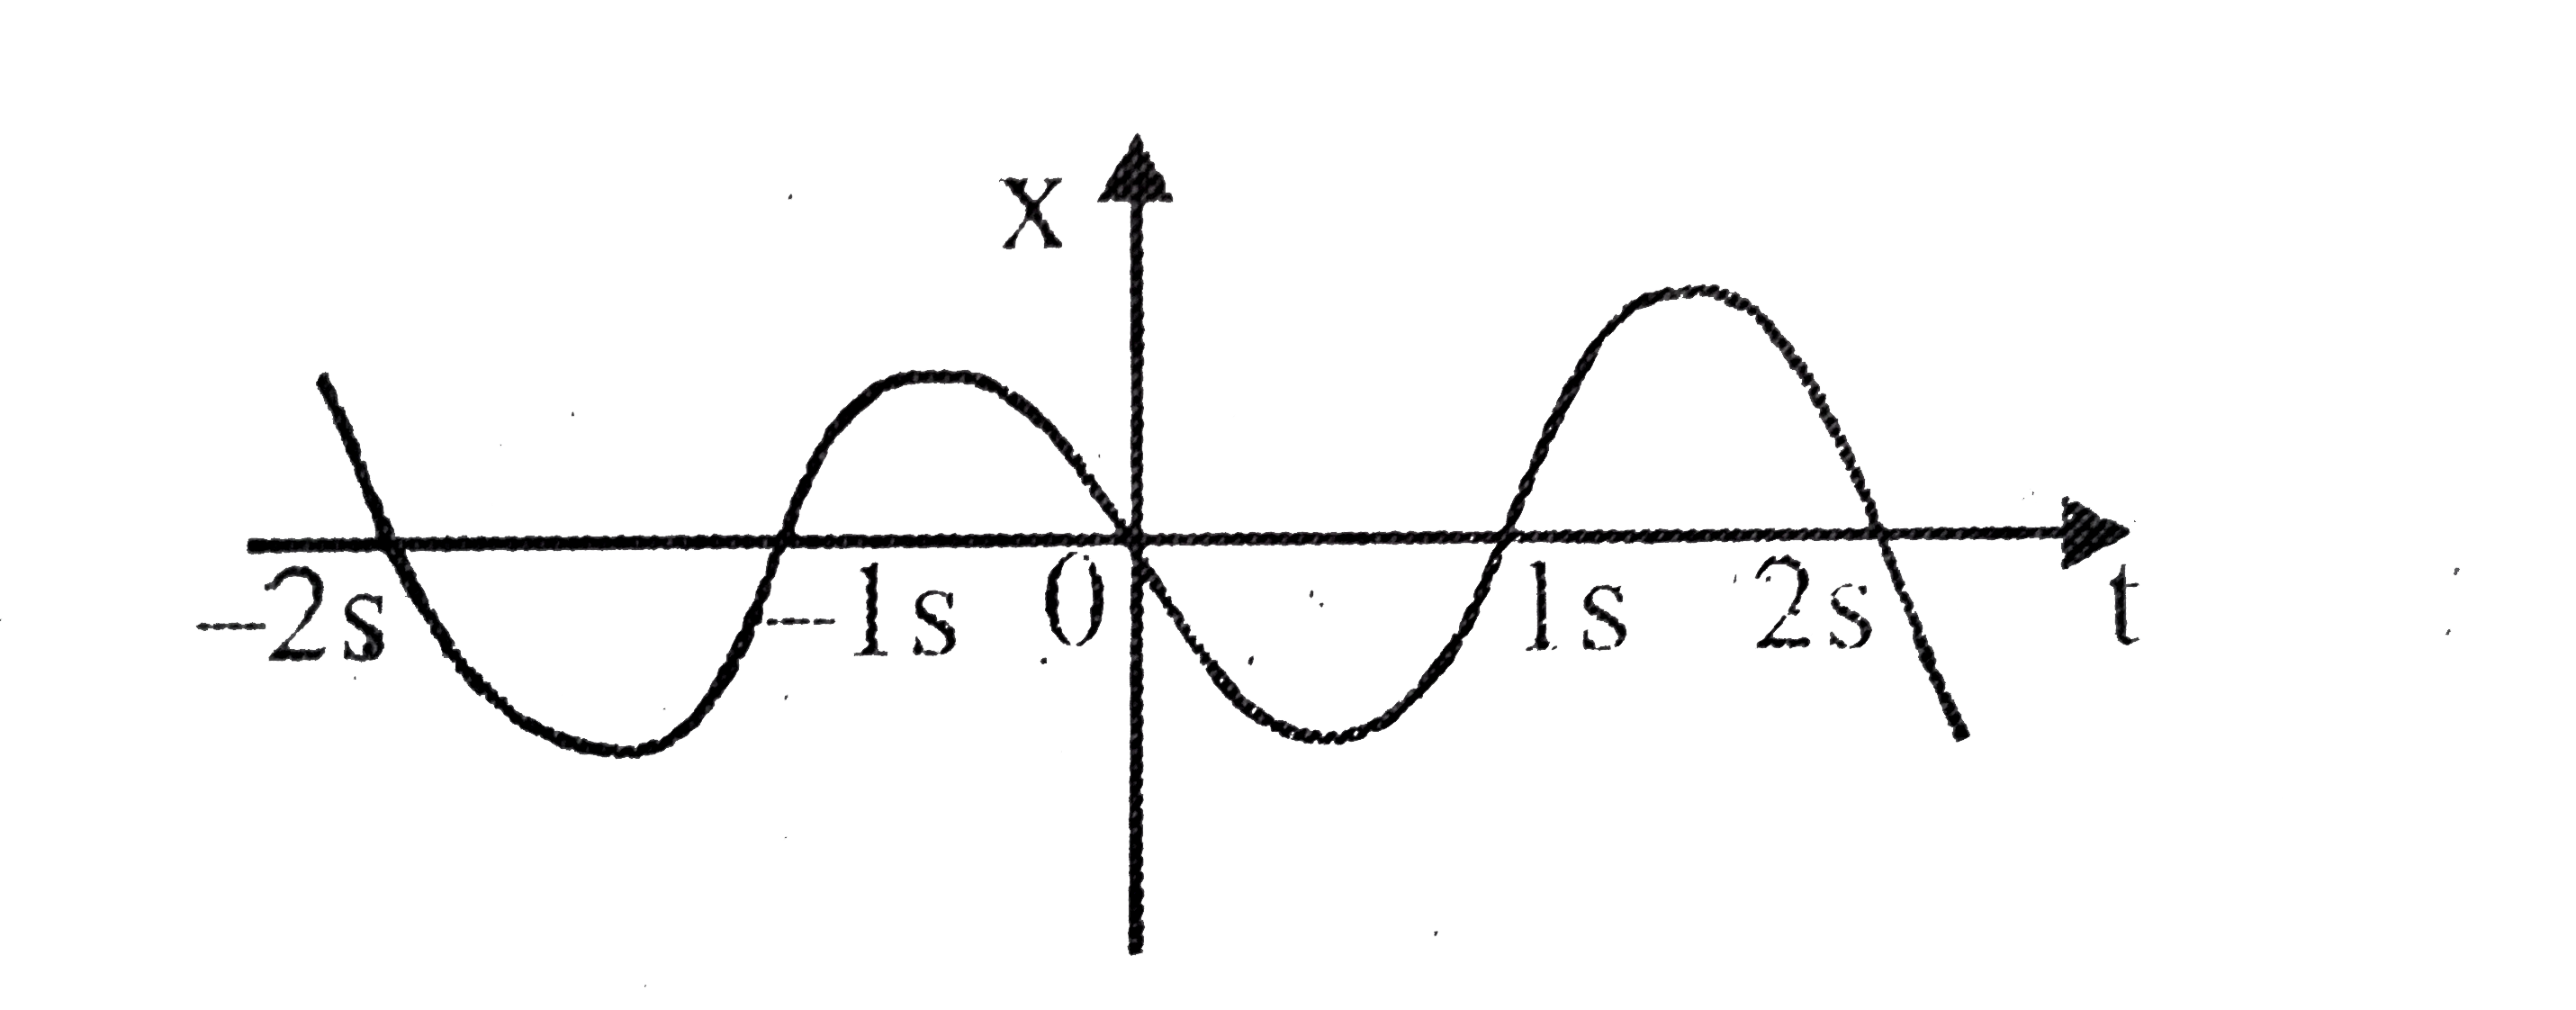
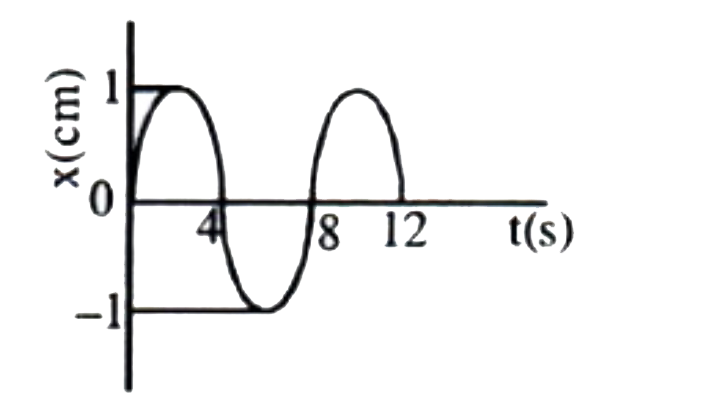
Fig 2 (NCT).8 gives the x−t plot of a particle executing one dimensional simle harmonic motion. Give the signs of position, velocity and acceleration variables of the particles at t=0.3s, 1.2s,−1.2s,
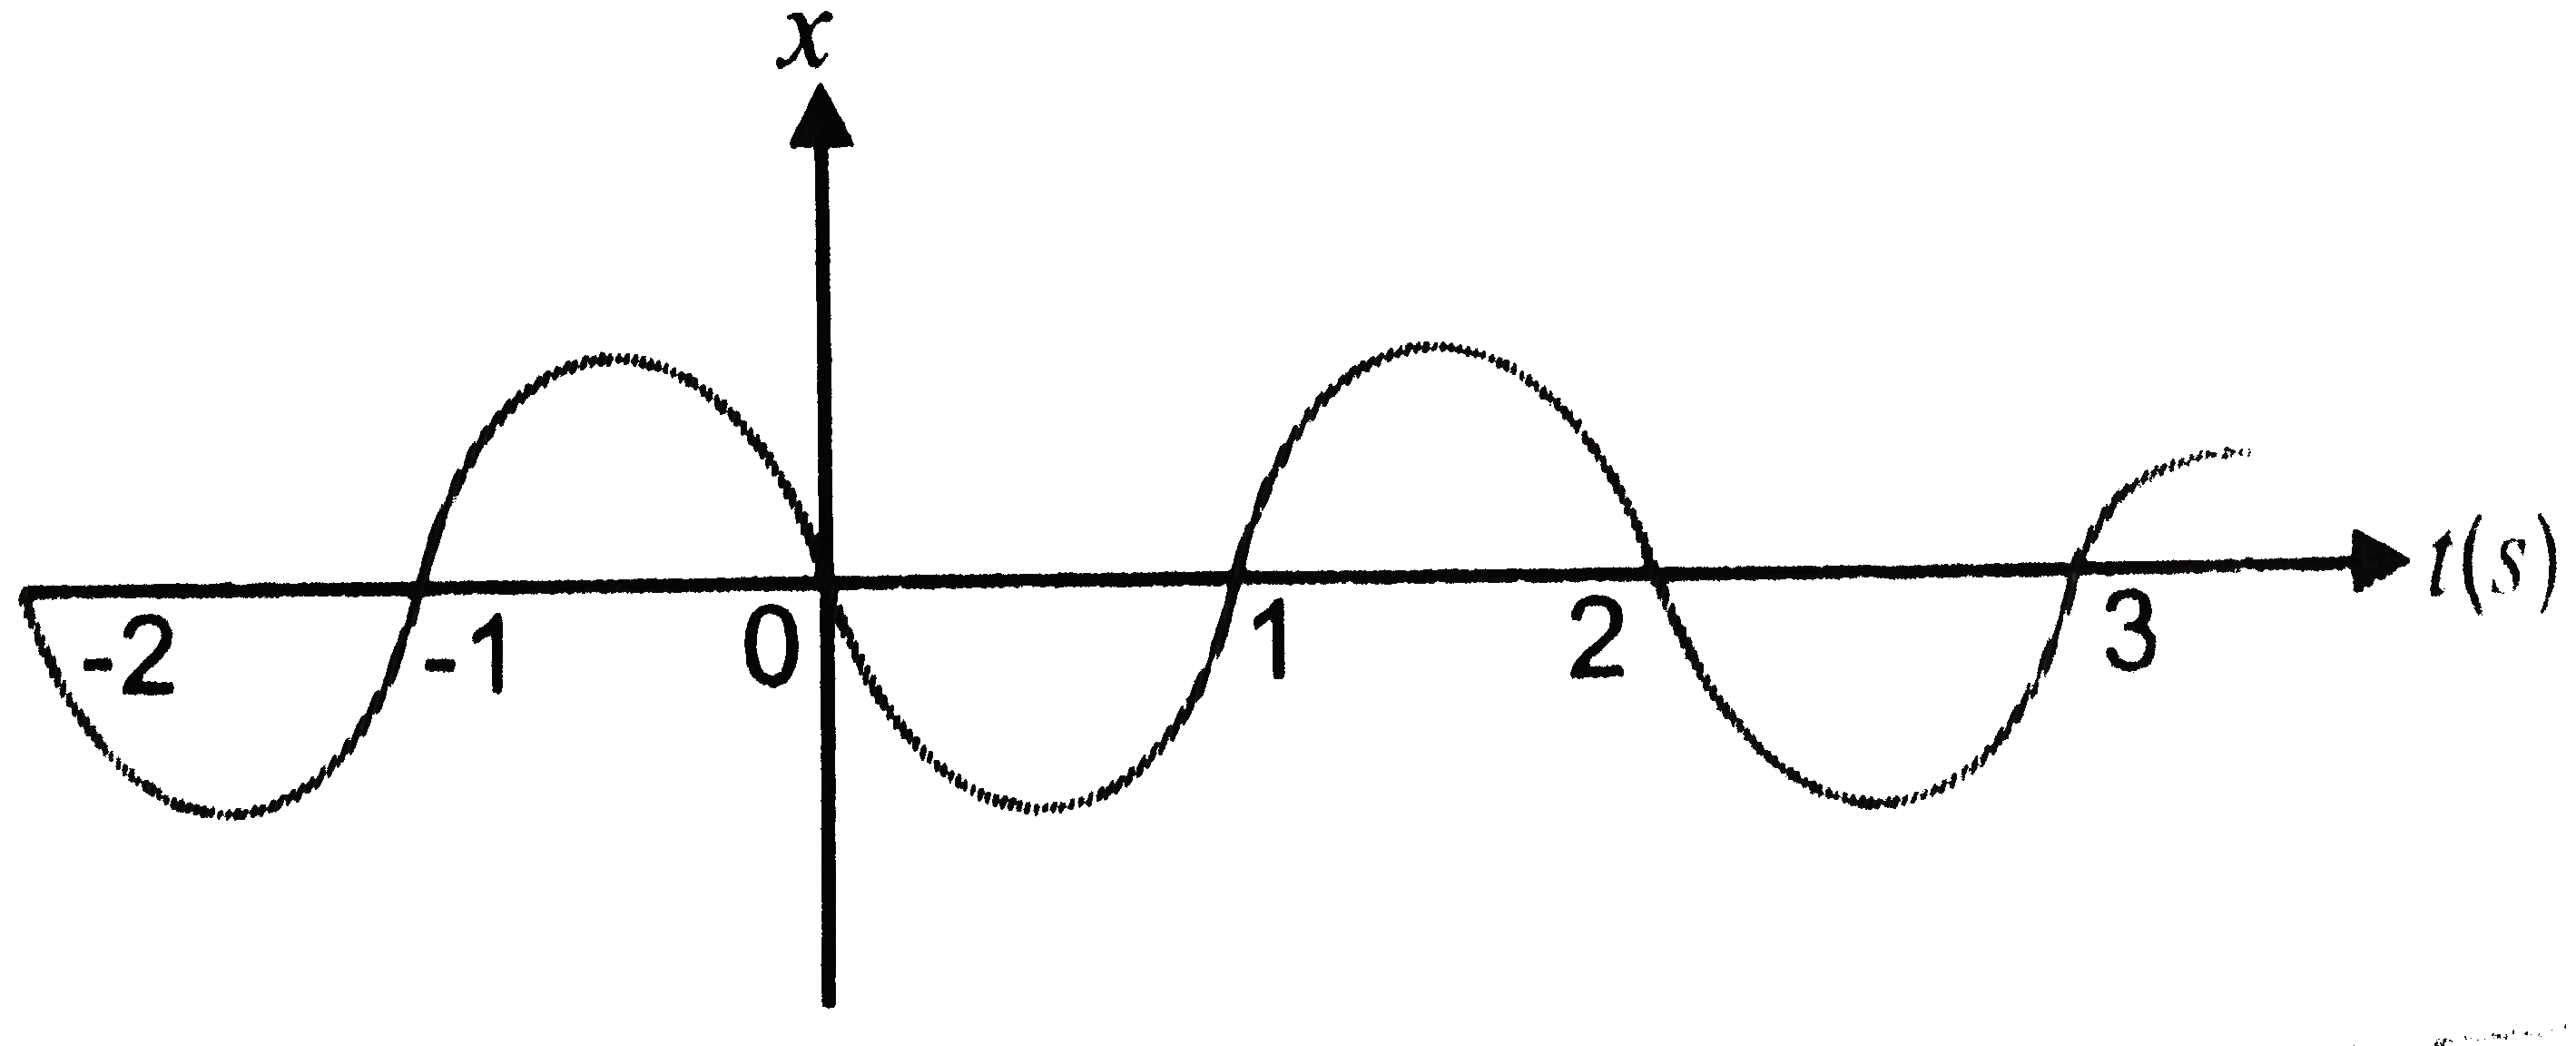
In then S.H.M. acceleration a=−ω∘x , where omega 9i.e. angular frequency ) is constant.
(i) At time t=0.3s, (x) is negative, the slope of x−t plot is negative, hence position and velocity are egative. Since a=−ω2x, hence, acceleration is positive.
(ii) AT time t=1.2s,x is positive, the slope of x−t plot is also positive, hence position and velocity are positive . Since a=−ω2x, hence acceleration is negative.
(iii) Att−1.2s,x. is negative, the slpoe of x−t plot is also negative . But since both (x) and (t) are negative here, hene velocity is positive, Finally acceleartion a is also positive.
Topper's Solved these Questions
- KINEMATICSBOOK - PRADEEPCHAPTER - KINEMATICSEXERCISE - Additional Exercises
13 Videos
- KINEMATICSBOOK - PRADEEPCHAPTER - KINEMATICSEXERCISE - Motion
25 Videos
- KINEMATICSBOOK - PRADEEPCHAPTER - KINEMATICSEXERCISE - Advanced Problems
20 Videos
- GRAVIATIONBOOK - PRADEEPCHAPTER - GRAVIATIONEXERCISE - Assertion-Reason Type Questions
19 Videos
- LAWS OF MOTIONBOOK - PRADEEPCHAPTER - LAWS OF MOTIONEXERCISE - Assertion- Reason Type Questions
17 Videos
Similar Questions
Knowledge Check
A particle executing simple harmonic motion with an amplitude 5 cm and a time period 0.2 s. the velocity and acceleration of the particle when the displacement is 5 cm is
A0.5πms−1,0ms−2B0.5ms−1,−5π2ms−2C0ms−1,−5π2ms−2D0.5πms−1,−0.5π2ms−2The x-t graph of a particle undergoing simple harmonic motion is shown below. The acceleration of the particle of t=4/3s is
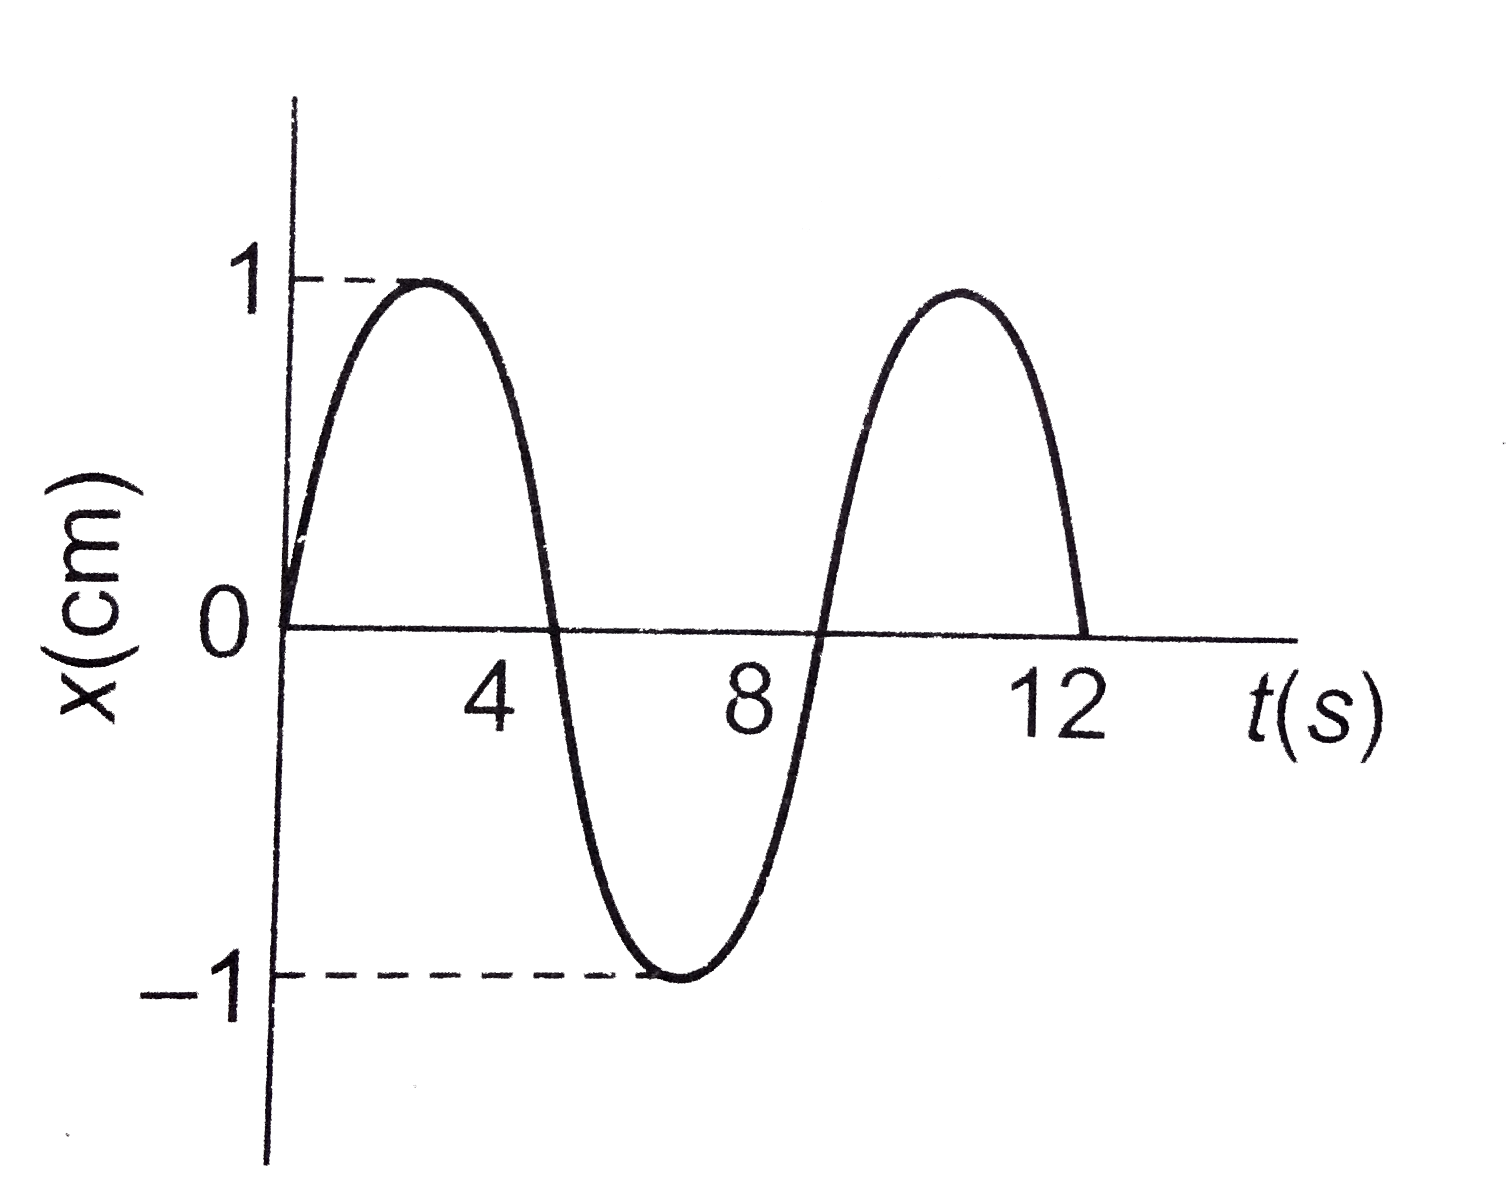 A√332π2cm/s2B−π232cm/s2Cπ232cm/s2D−√332π2cm/s2
The x−t graph of a particle undergoing simple harmonic motion is shown below. The accelertion of the particle at t=4/3s is
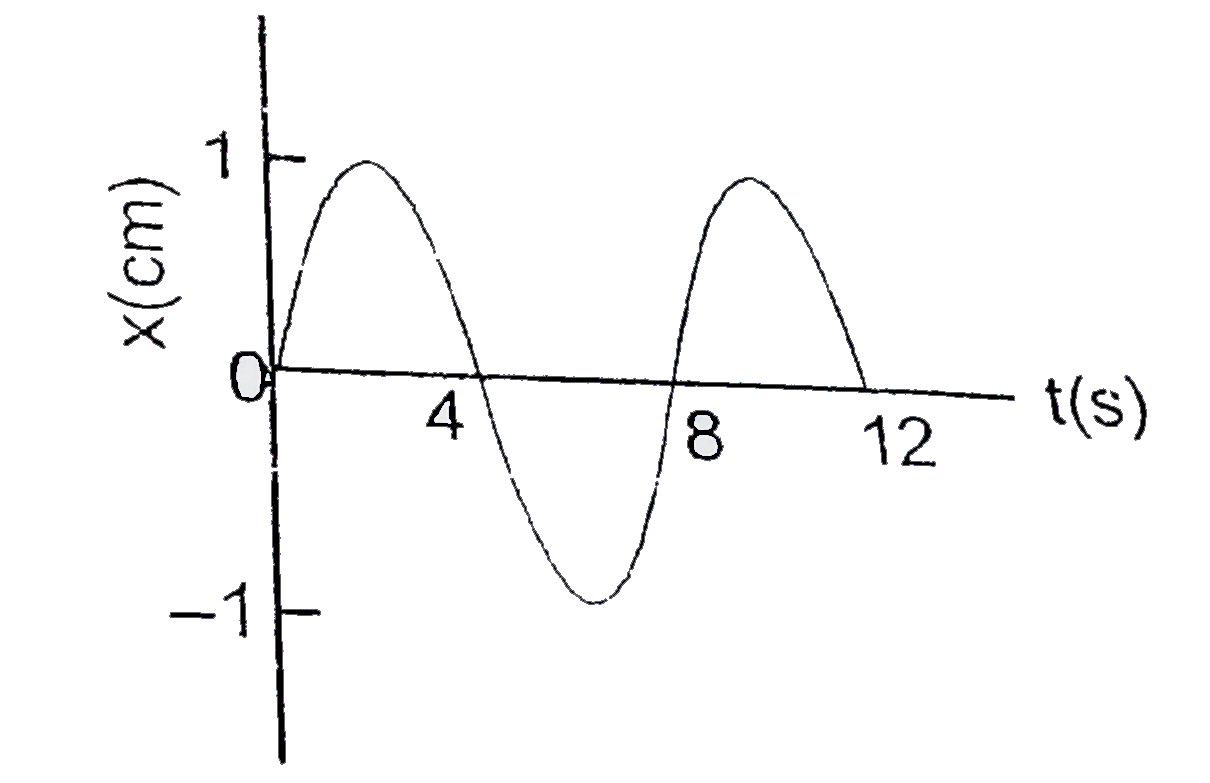 A√332π2cm/s2B−π232cm/s2Cπ232cm/s2D−√332π2cm/s2
If the motion of aparticle is governed by the equation, s=2t3−3t2+2t+2, find the poswition, velocity and acceleration of the particle at time t=2s.
View SolutionA particle is moving with initial velocity 1m/s and acceleration a=(4t+3)ms2. Find velocity of particle at t=2sec.
View SolutionA particle executes simple harmonic motion with a time period of 16s. At time t=4s its velocity is 4ms−1. Find its amplitute of motion.
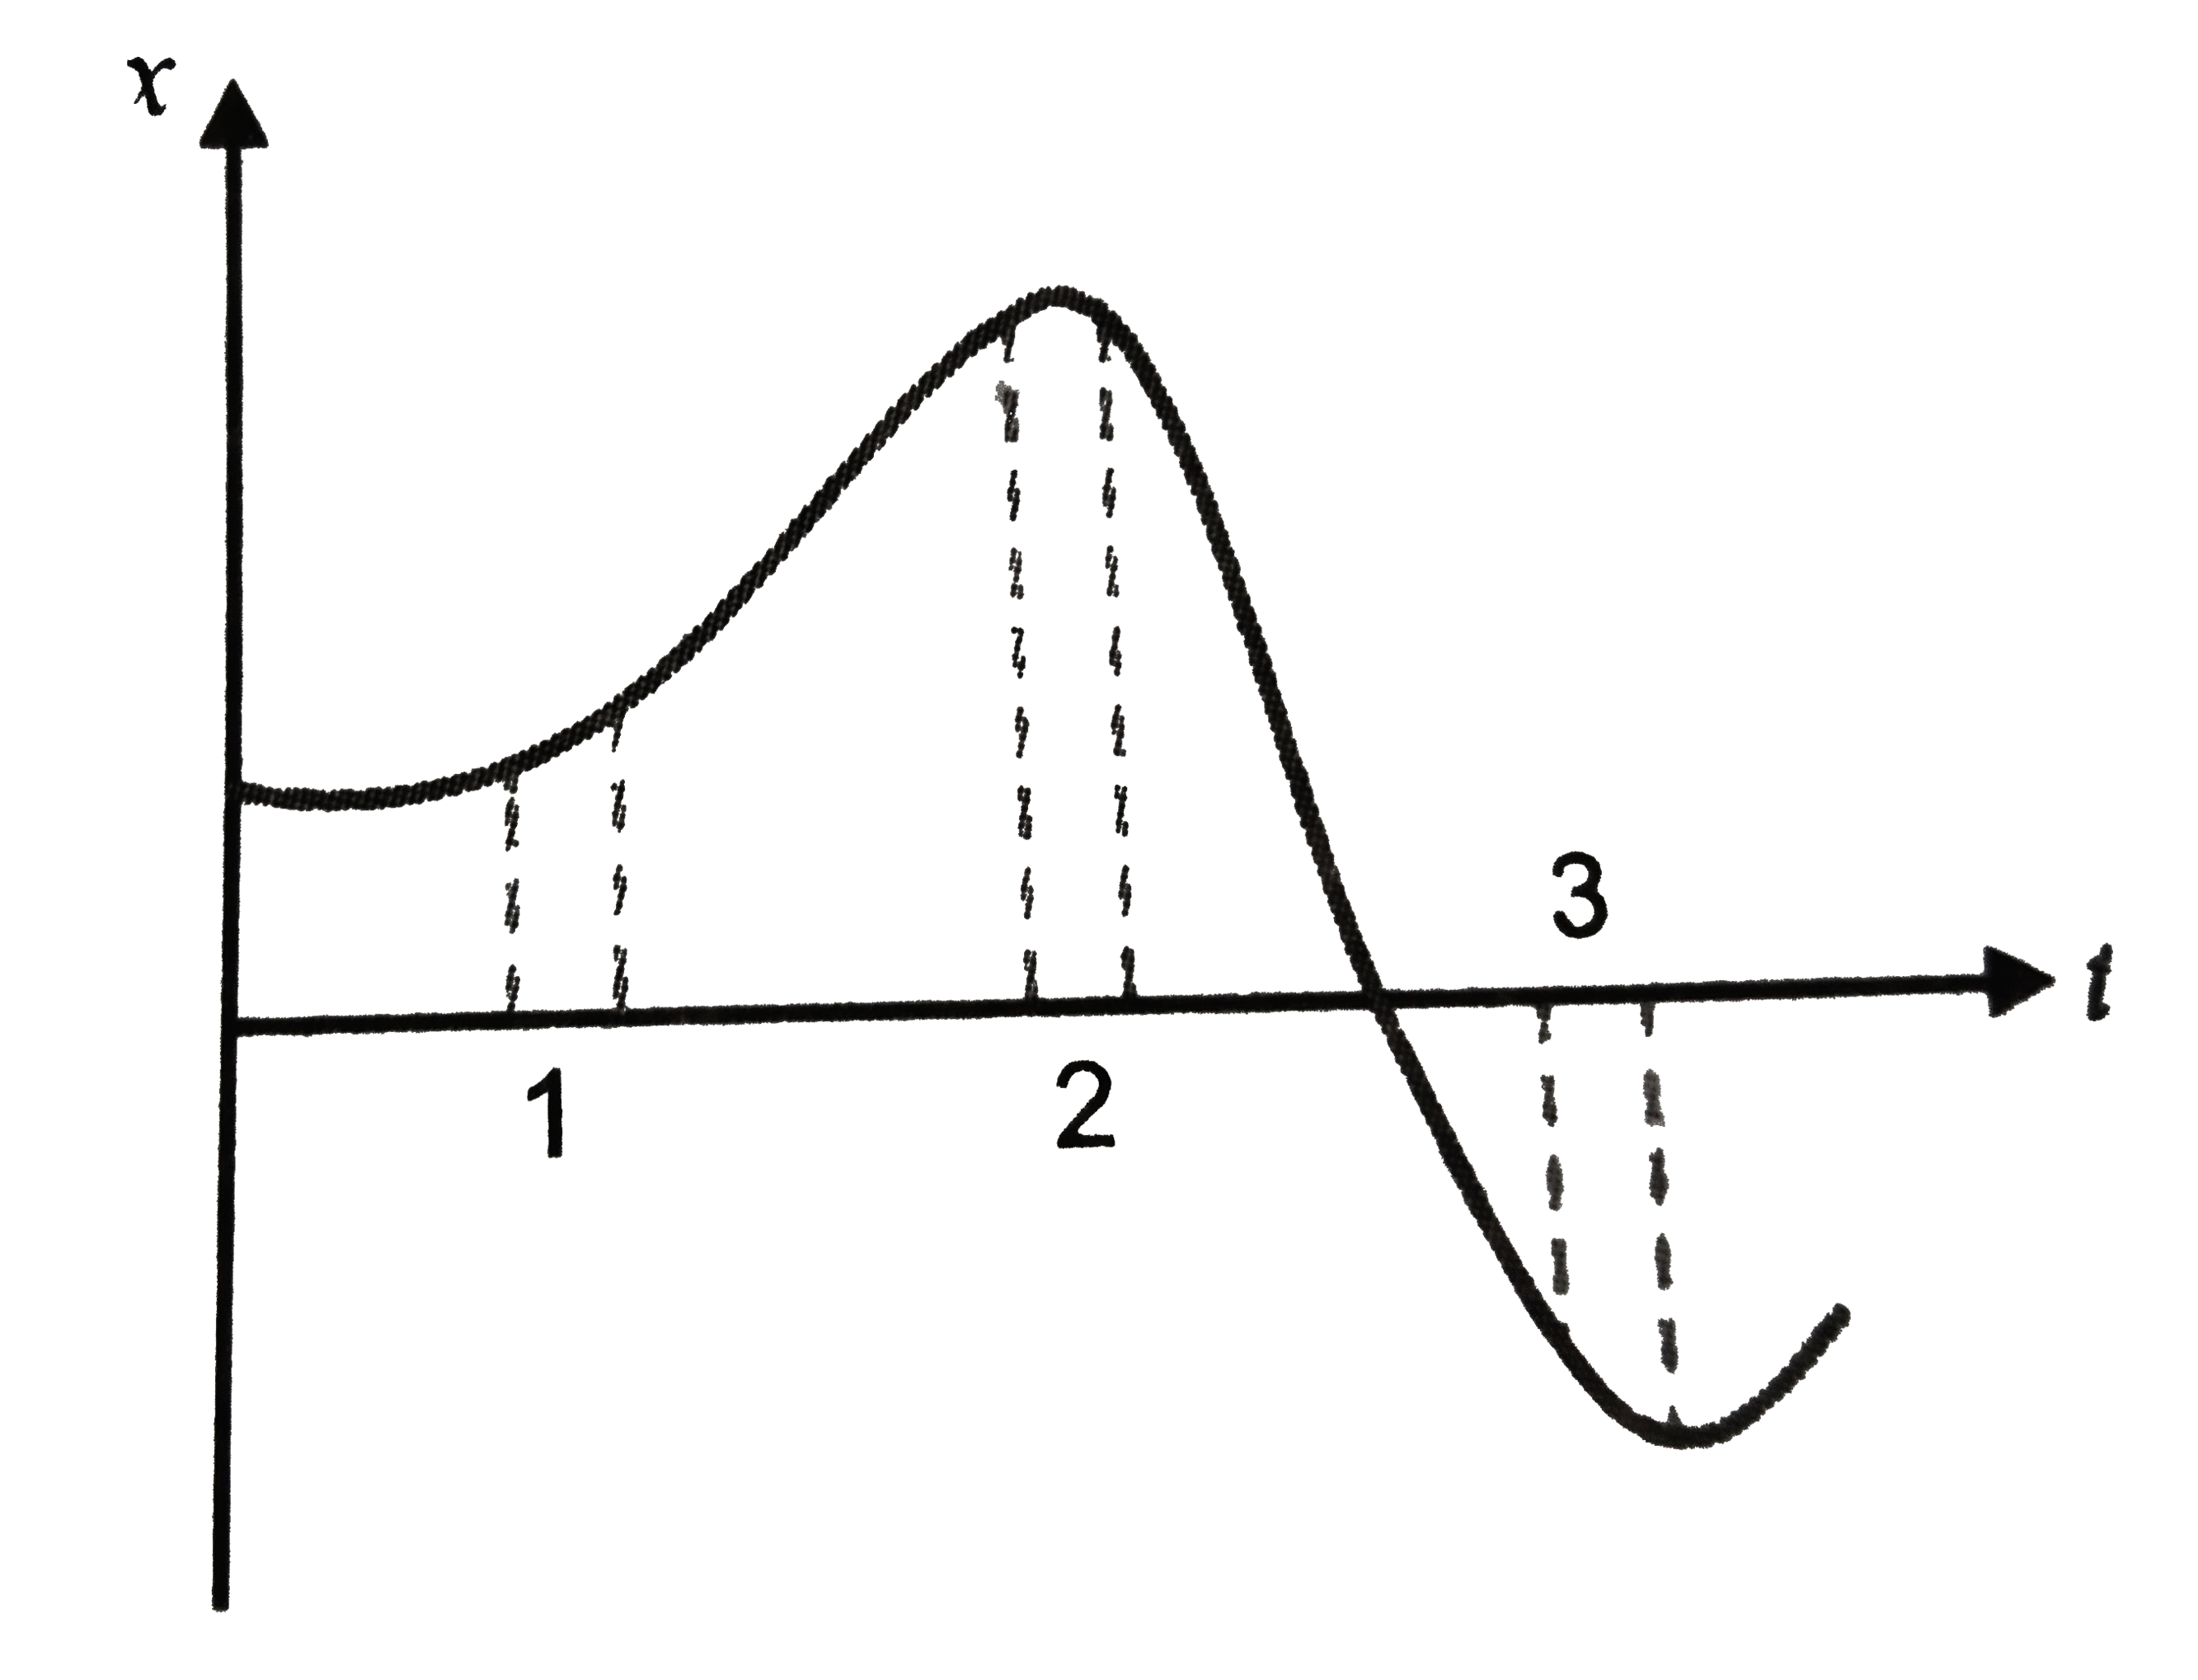
View SolutionFig. 2 (NCT).9 show the x−t plot of a particle in one dimensional motion. Three different equal intervals of time are shown. In which interval the average speed is greatest and in which it is the least ? Give the sign of average speed for each interval.
 .
.
View SolutionThe x−t graph of a particle undergoing simple harmonic motion is shown in figure. Acceleration of particle at t=4/3s is

View Solution

