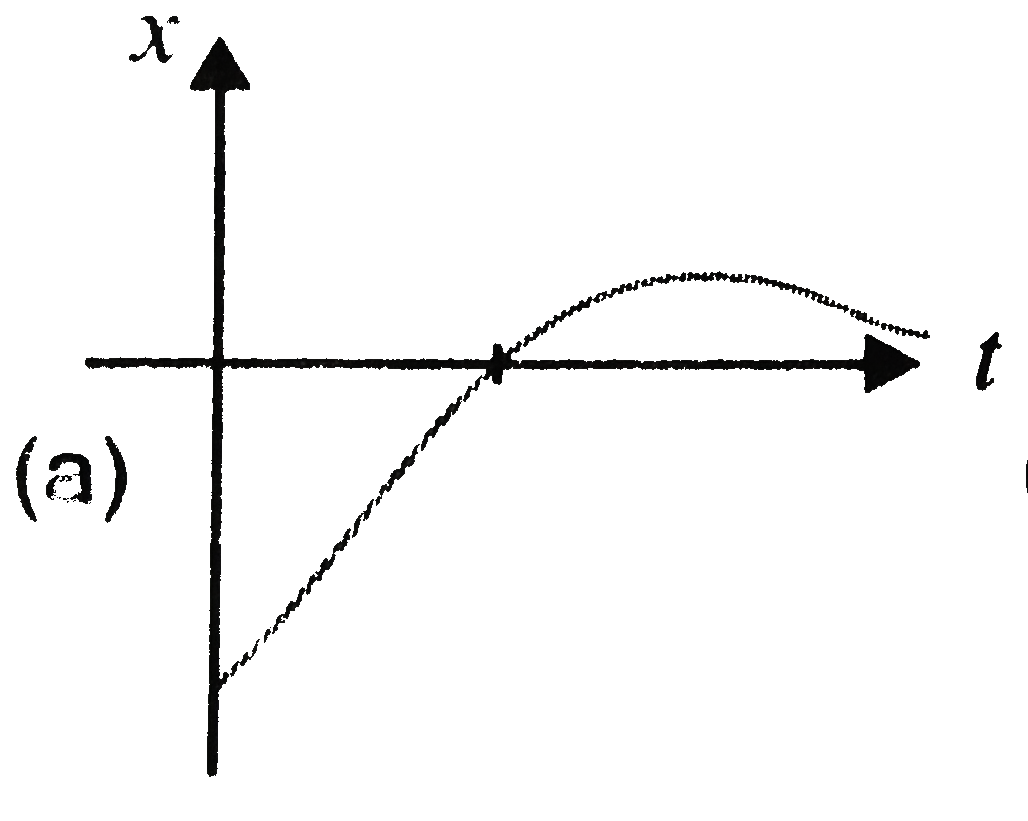
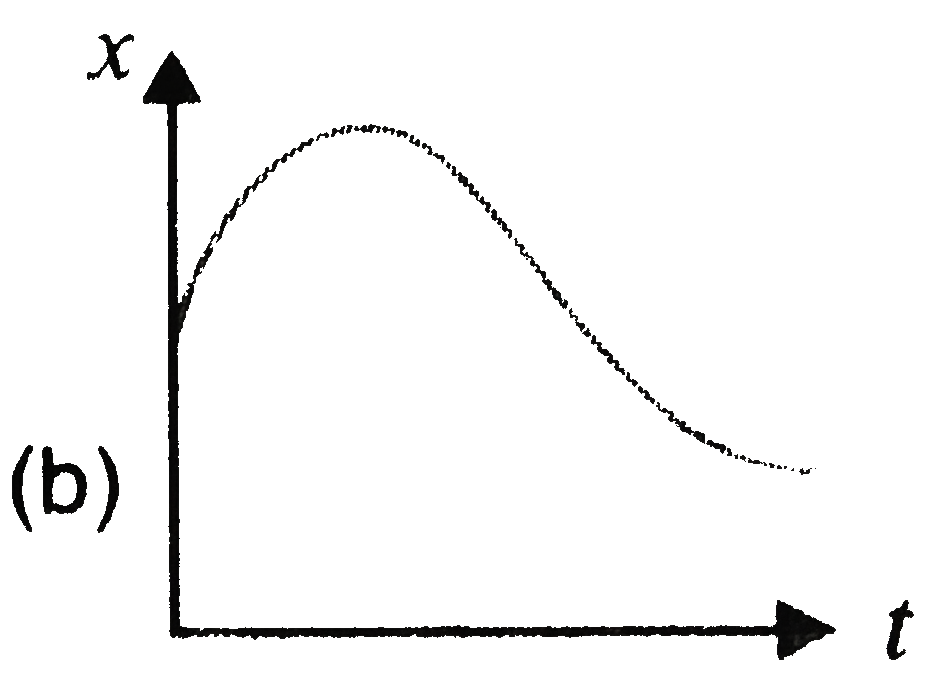
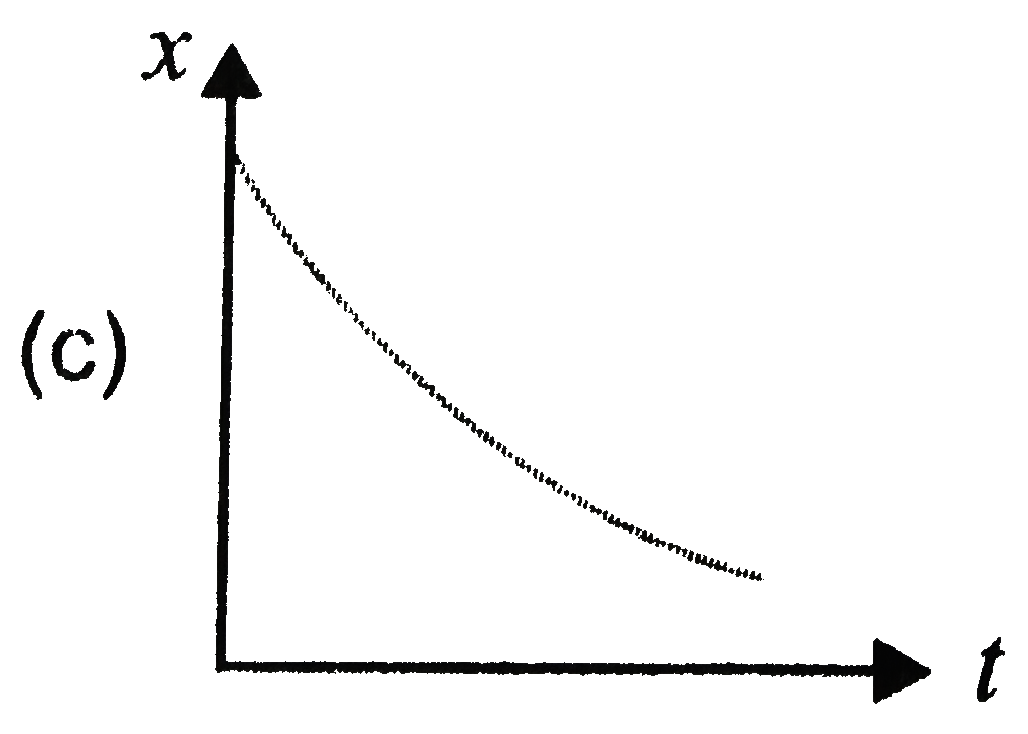
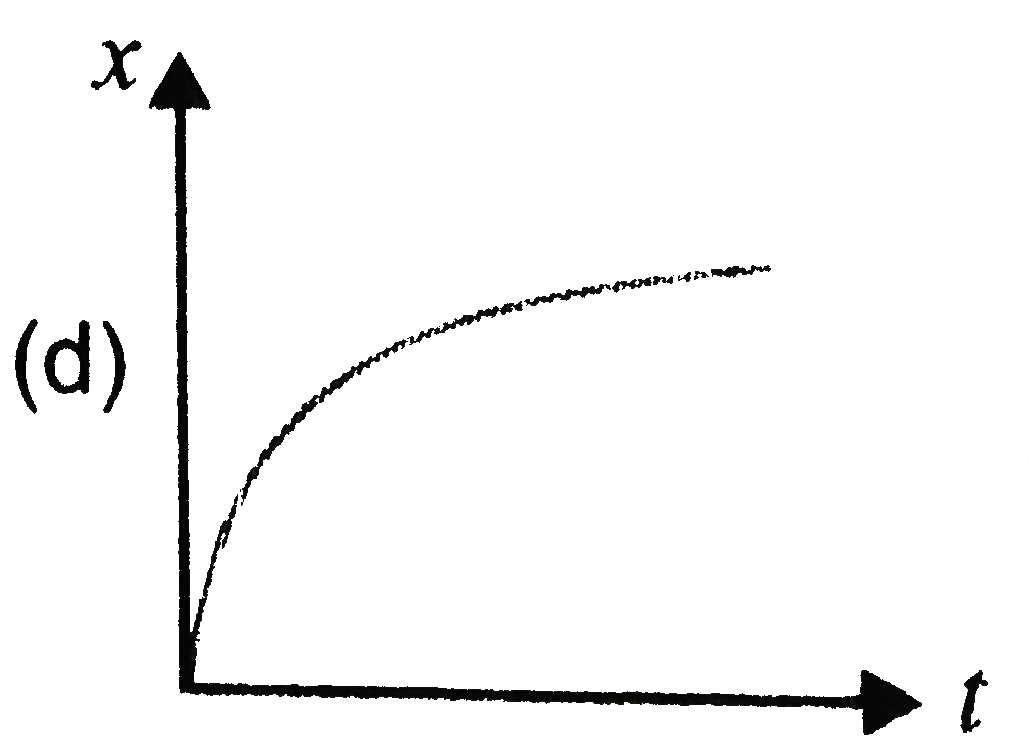
Among the four graphs shown in the figure there is only one graph for which average velocity over the time interval (0,T) can vanish for a suitably chosen T. Which one is it ?
 .
.
 .
.
 .
.
 .
.
The correct Answer is:B
In graph (b) , for one value of displacement, ther are two timeings. As a result of it, for one time the average velocity is positve and for other tiem is equivalnt negative. Due to it, the average velocity for the two timeings (equal to time period) can vanish.
Topper's Solved these Questions
- BOOK - PRADEEPCHAPTER - KINEMATICSEXERCISE - 2 NCERT multiple15videos
KINEMATICS
- BOOK - PRADEEPCHAPTER - KINEMATICSEXERCISE - 3 NCERT multiple161videos
KINEMATICS
- BOOK - PRADEEPCHAPTER - KINEMATICSEXERCISE - 4 Fill in the blanks11videos
KINEMATICS
- BOOK - PRADEEPCHAPTER - GRAVIATIONEXERCISE - Assertion-Reason Type Questions19videos
GRAVIATION
- BOOK - PRADEEPCHAPTER - LAWS OF MOTIONEXERCISE - Assertion- Reason Type Questions17videos
LAWS OF MOTION
Similar Questions
Knowledge Check
- Question 1 - Select One
The current in a 4.0 mH inductor vaires in time as shown in the figure. The corresponding graph of the self induced emf across the inductor over the time interval t=0 to t=12.0 ms is
 A
A B
B C
C D
D
- Question 2 - Select One
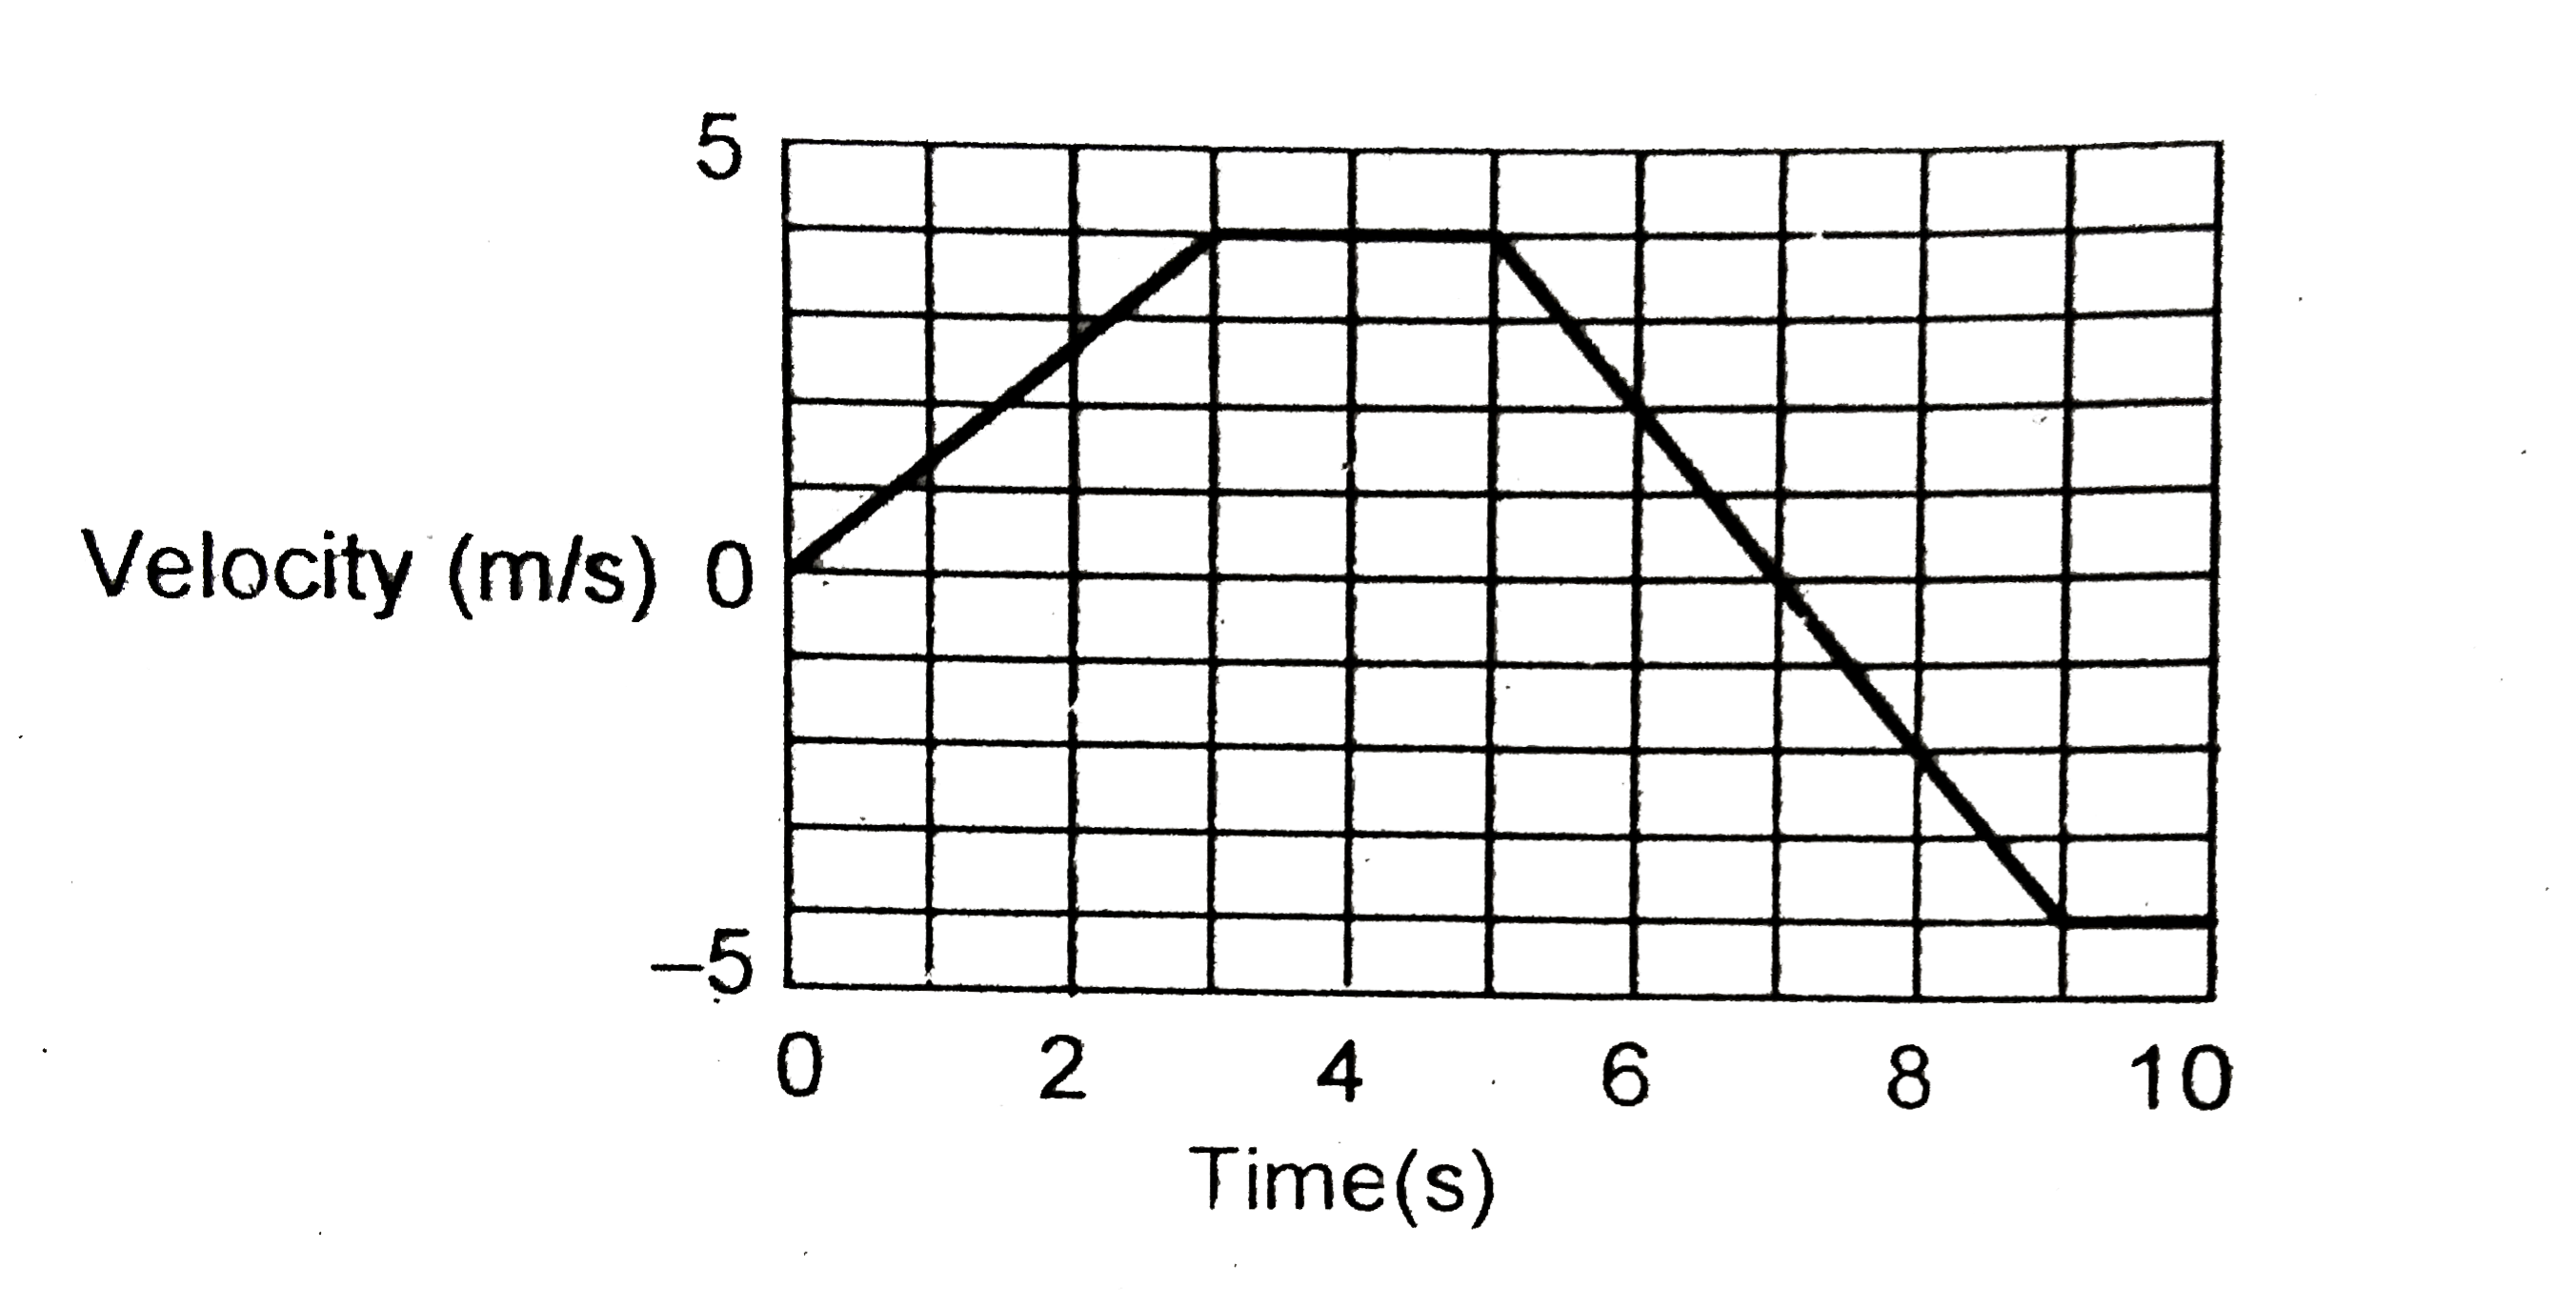
An object starts at the origin in a straight line. Its velocity versus time graph is shown in the figure. Which one of the following choices best gives the proper intervals (s) of time for which the object is moving away from the origin?AOnly for times 0s<t<3sBOnly for times 0s<t<5sConly for times 3s<t<5sDOnly for times 0s<t<7s - Question 3 - Select One
For which of the following graphs the average velocity of a particl moving along a straight line for time interval (0,t) must be negative−
A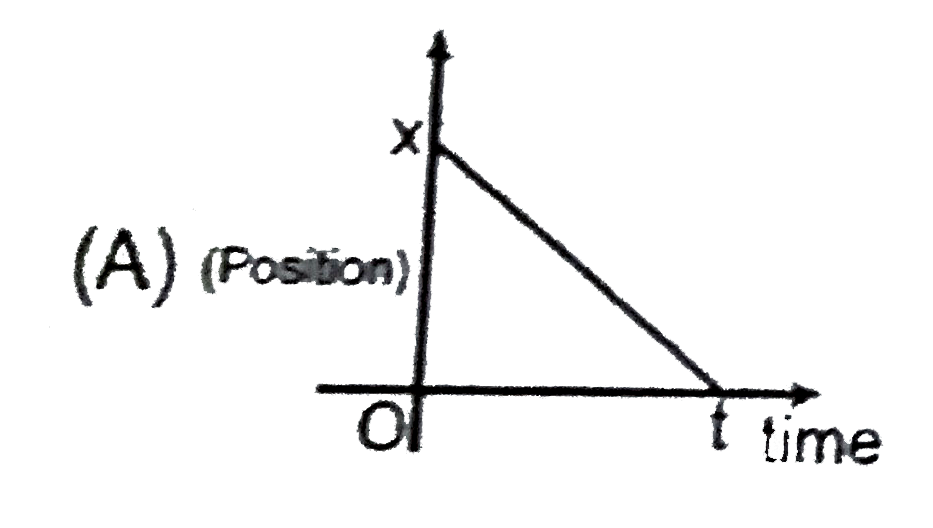 B
B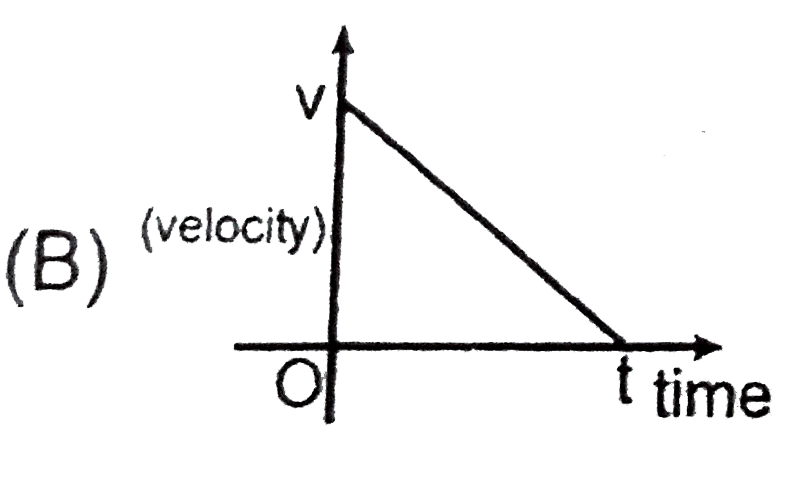 C
C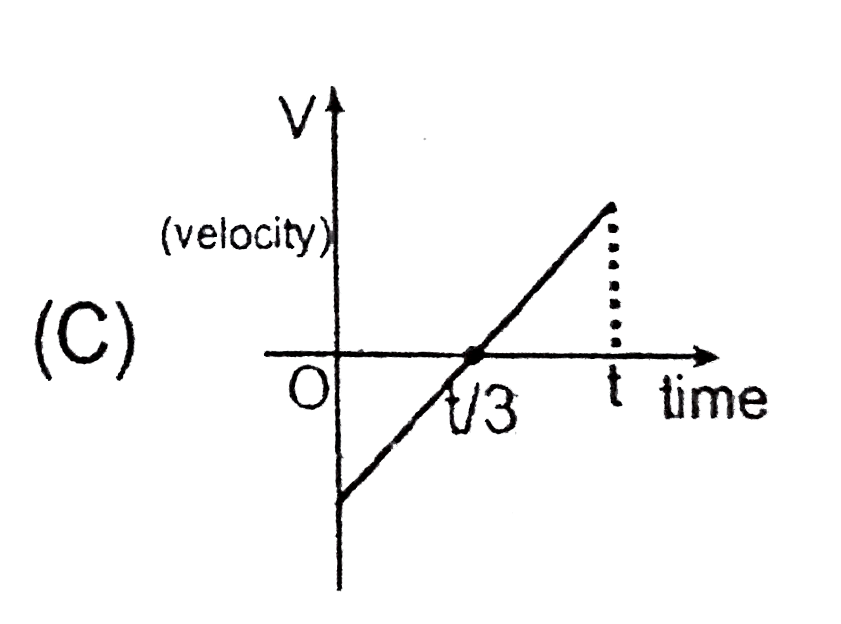 D
D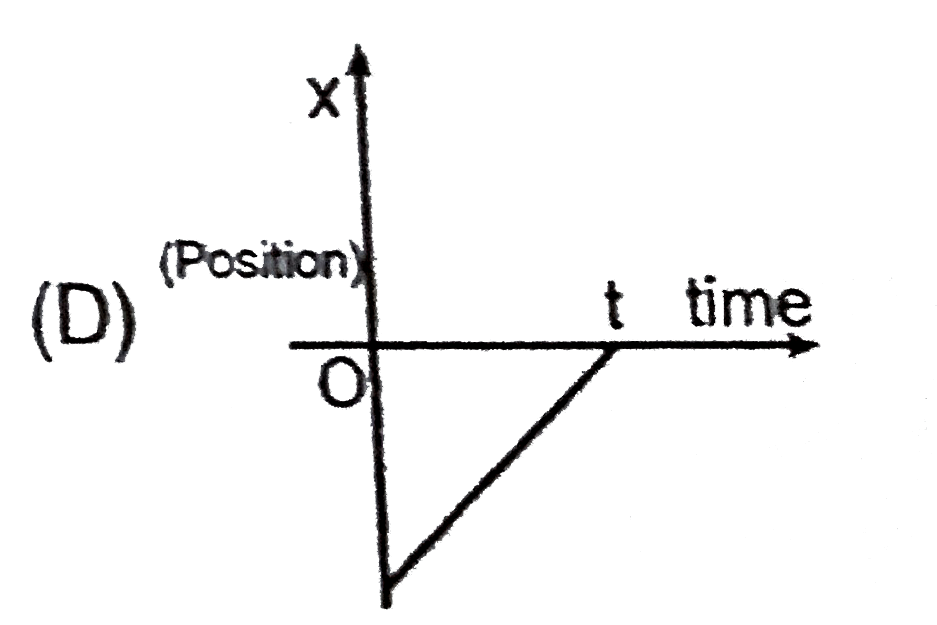
A material particle is moving along a straight line in such a manner that its velocity varies as shown in the figure. At which moment in time numbered successively on the time axis will the acceleration of the particle be maximal? How should one use the graph to determine the average velocity of motion over the time interval from t1 to t2 ?
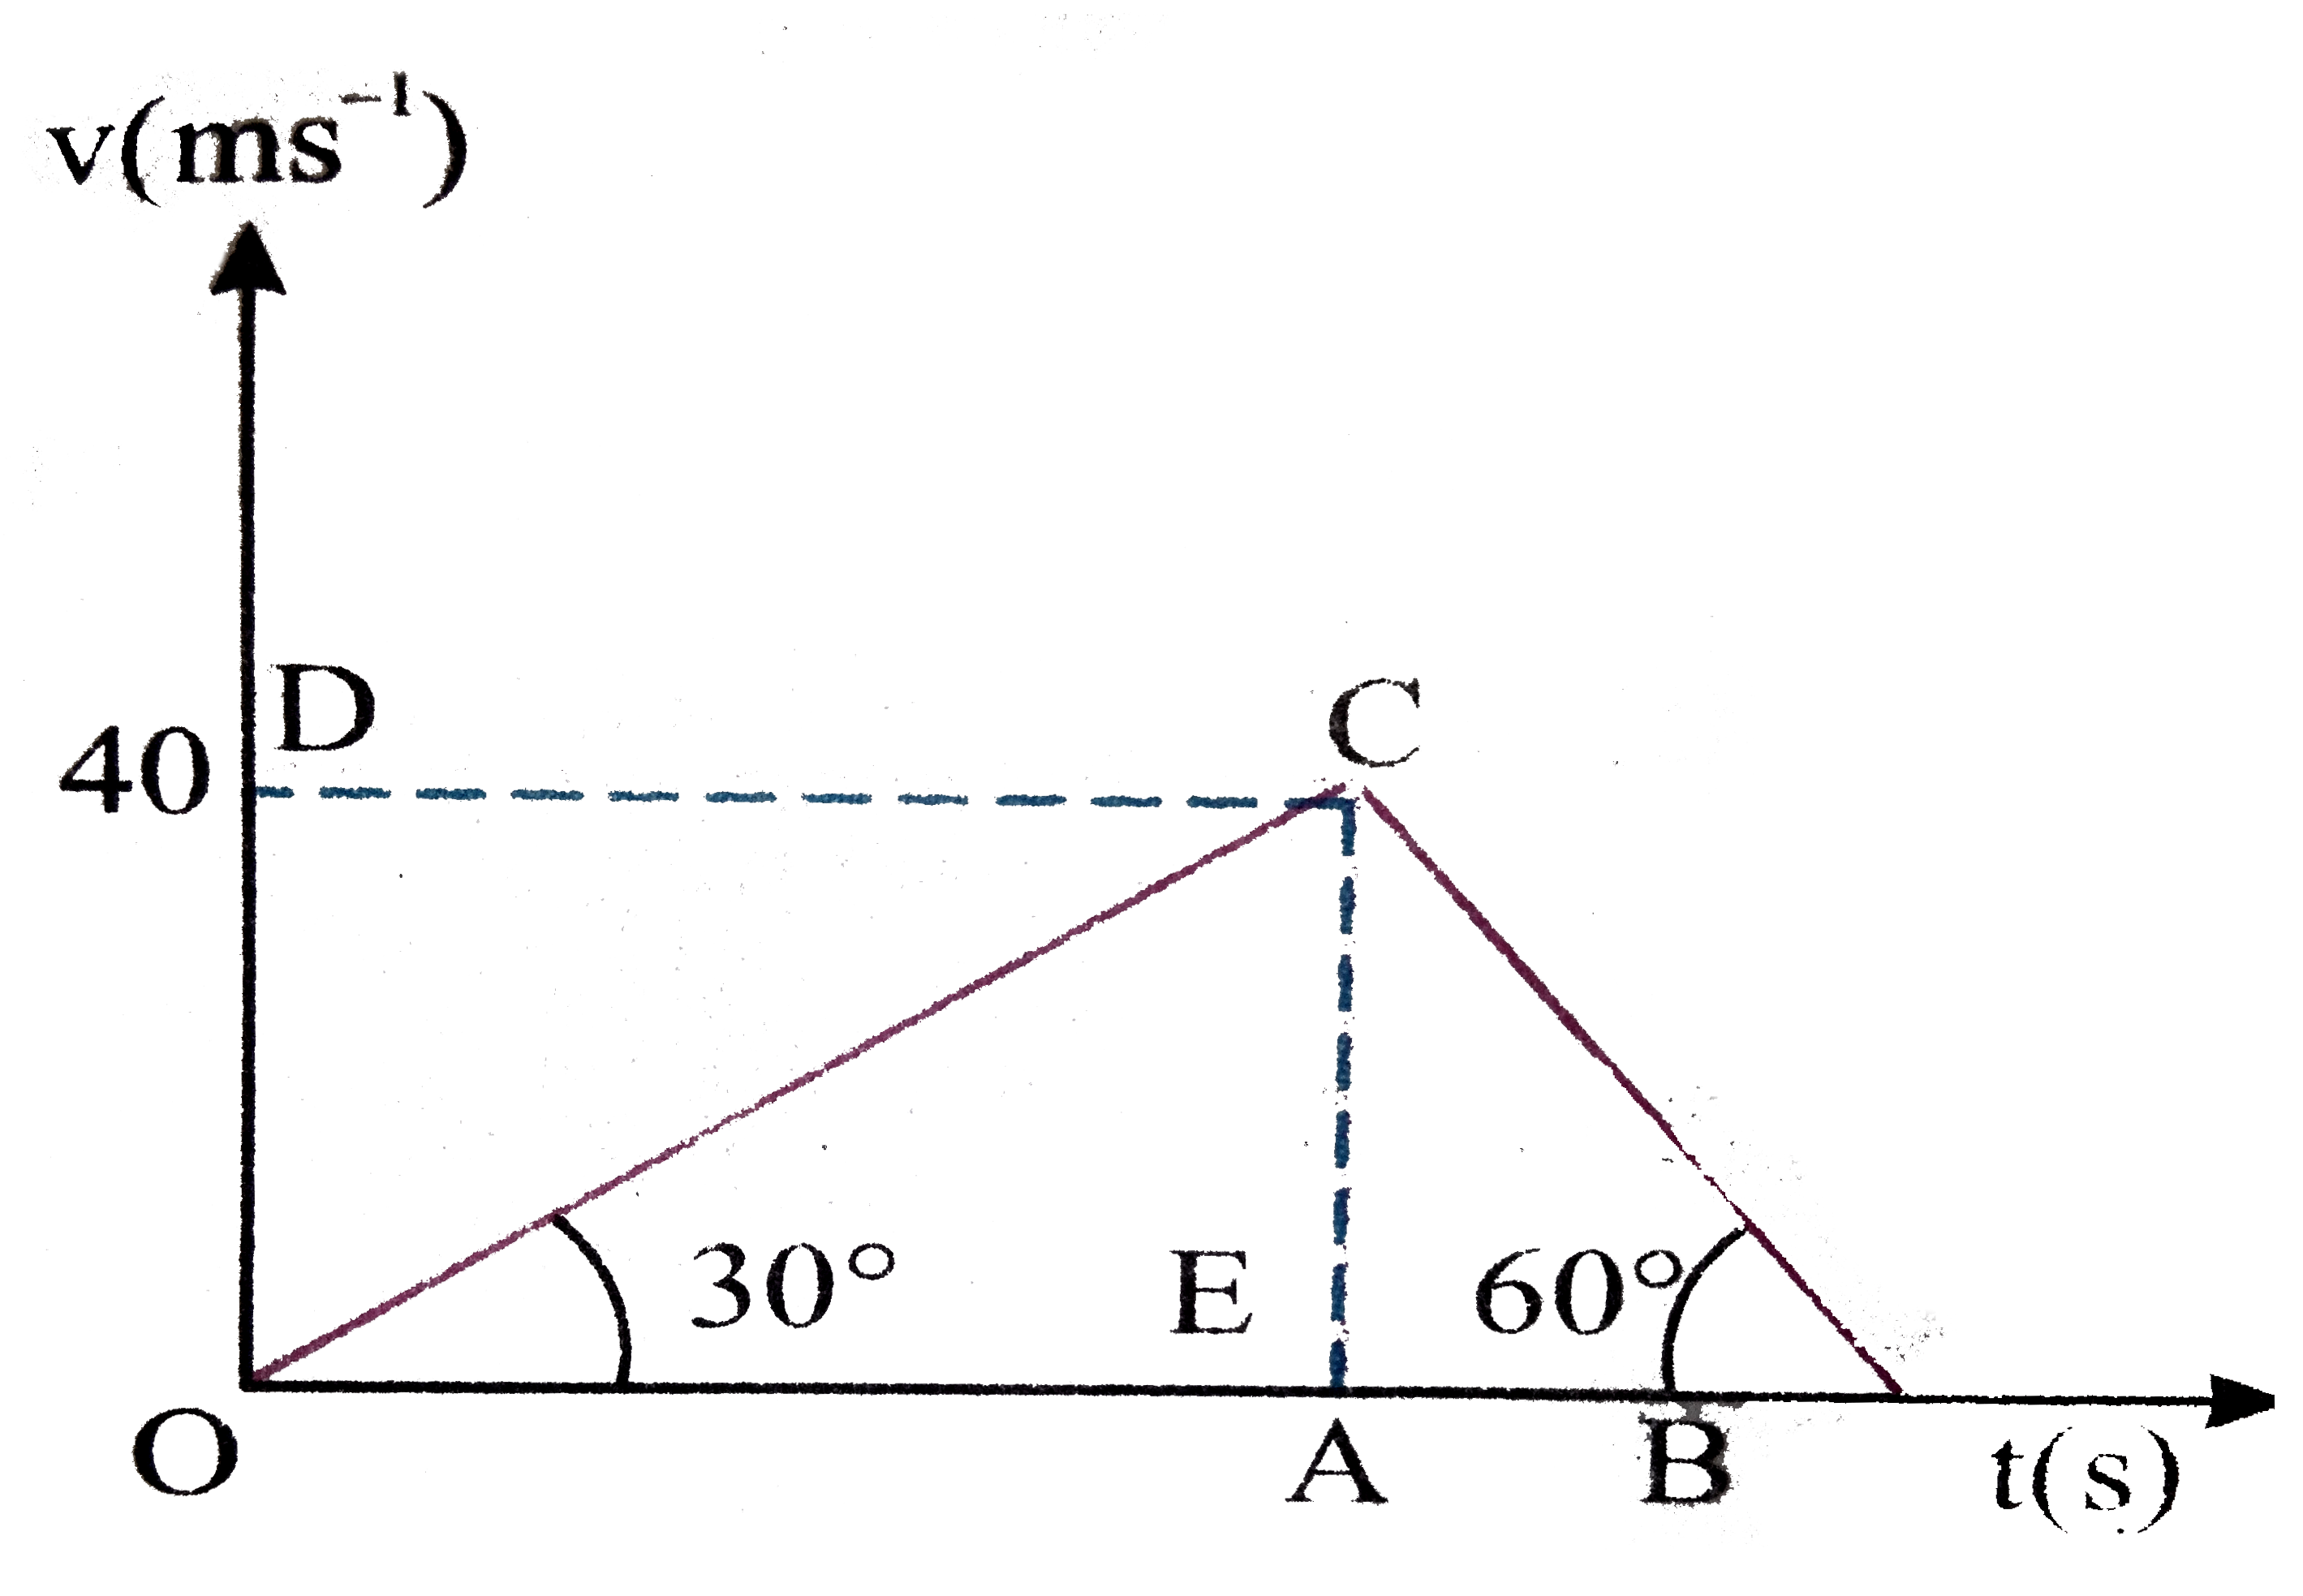
View SolutionThe velocity-time graph of a body is shown in figure. The ratio of magnitude of average acceleration during the intervals OA and AB is
 View Solution
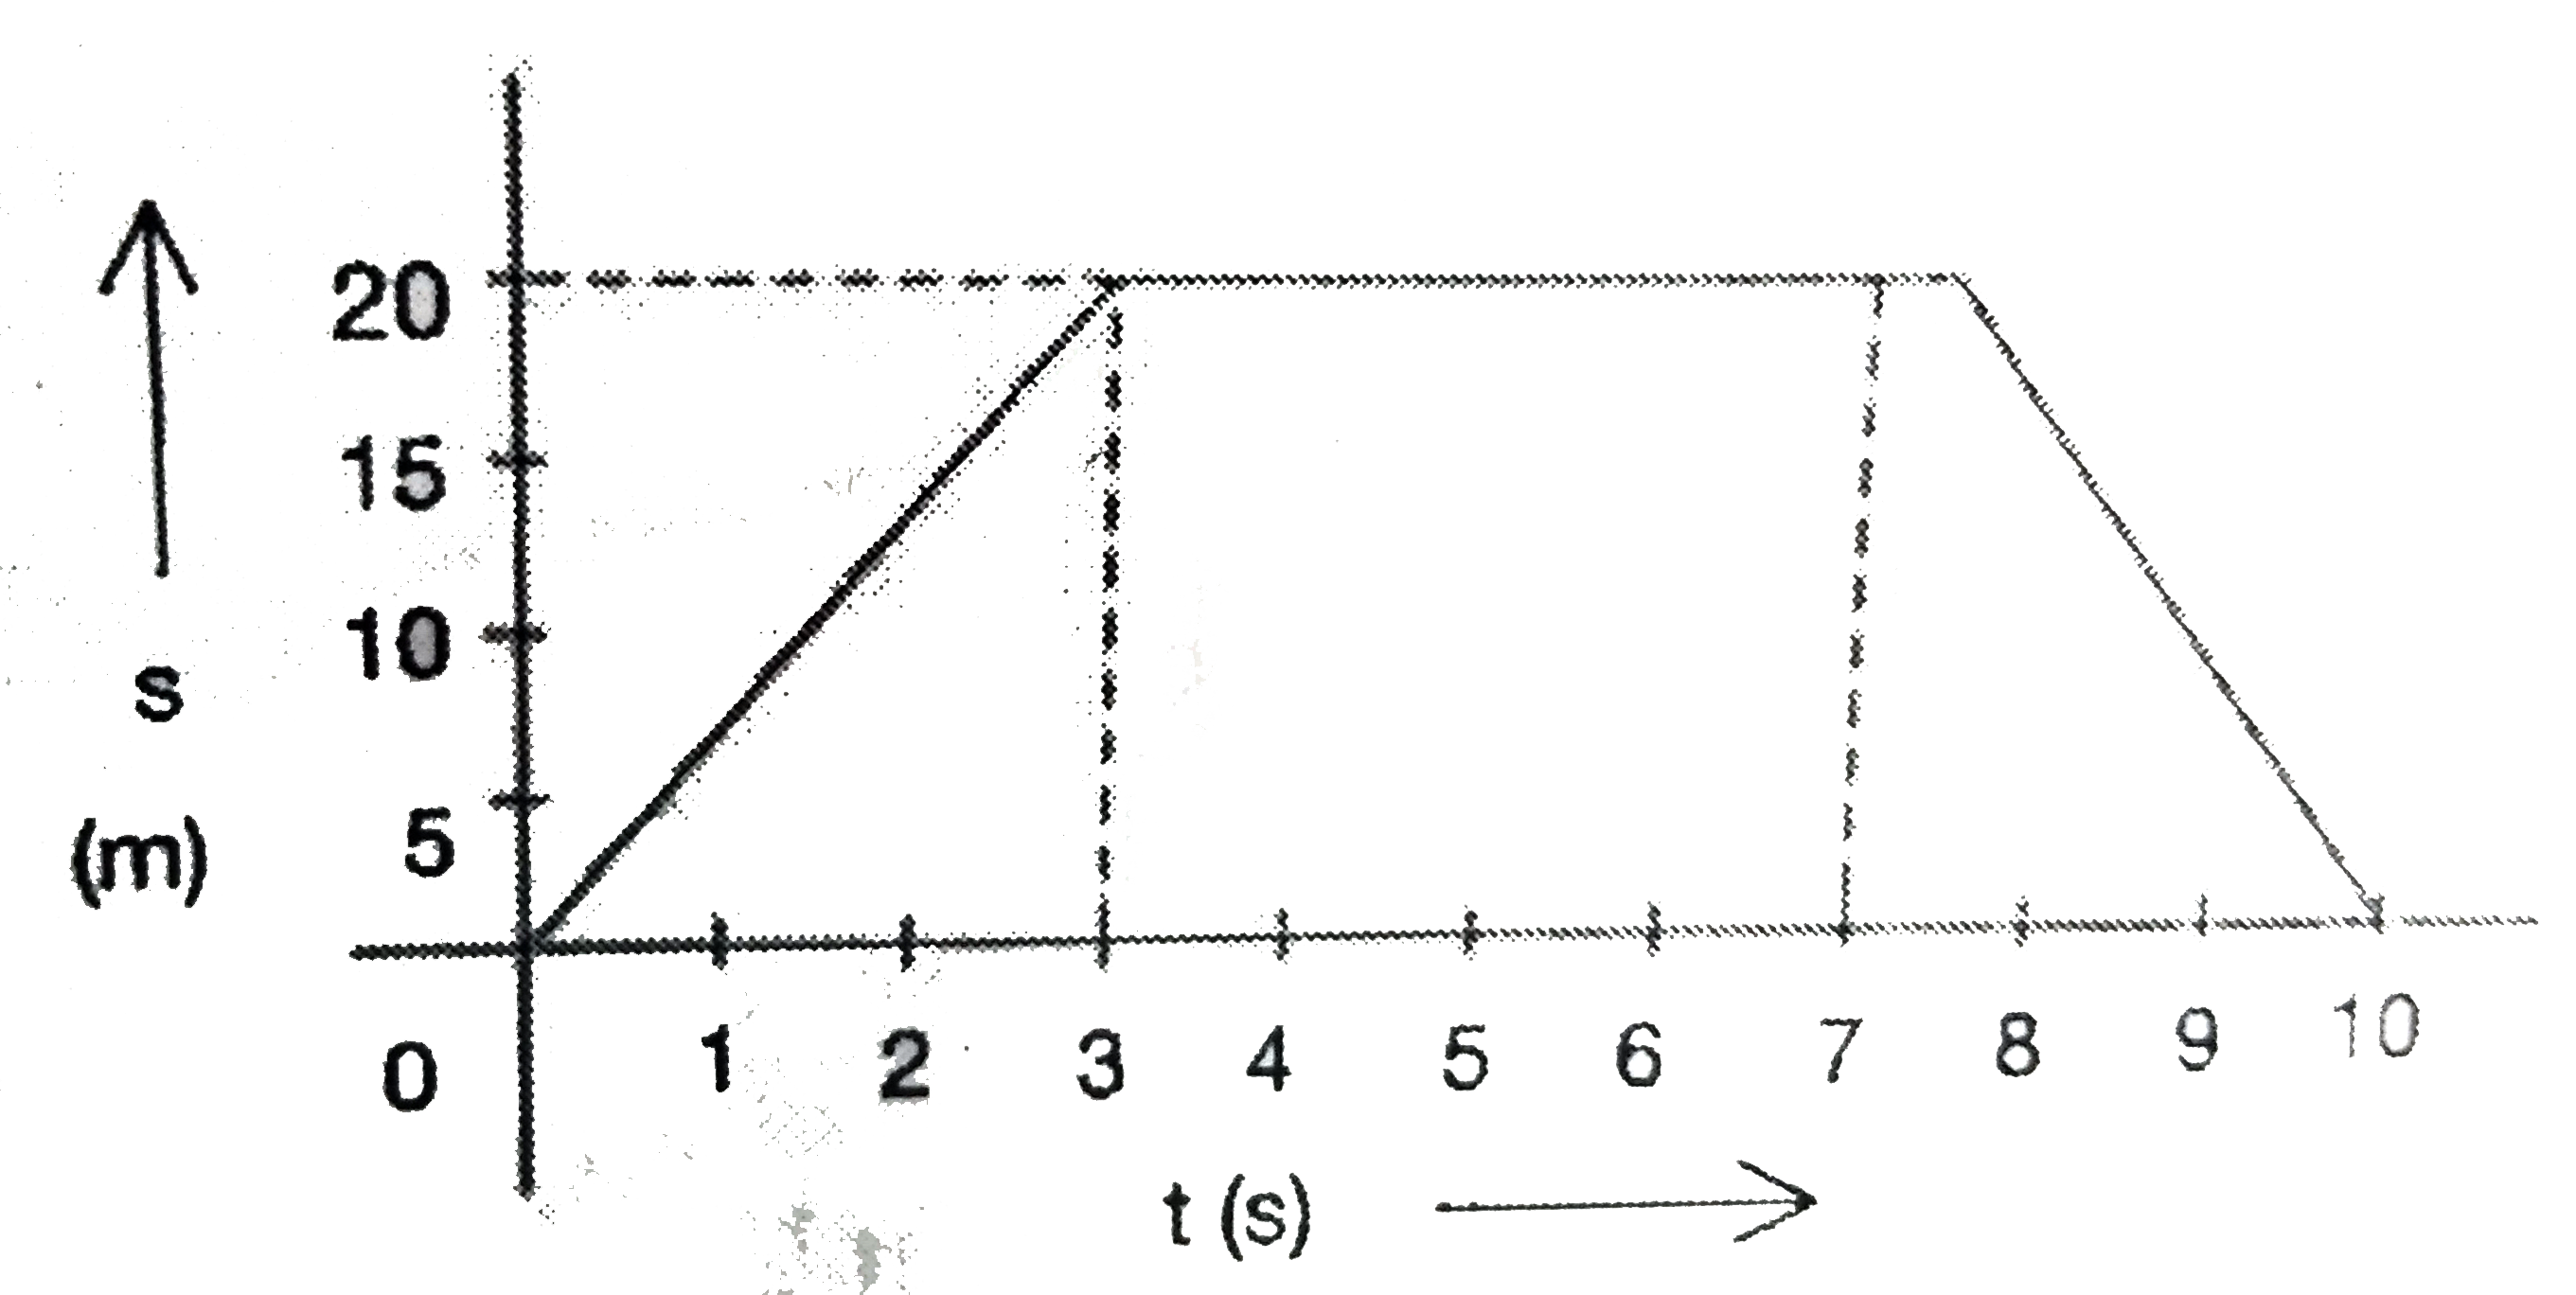
The →s−t graph of a body is a shown in the figure The time for which the body is in motion is________ second
 View Solution
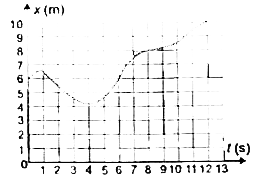
Position - time graph for a particle is shown in figure. Starting from t = 0, at what time t, the average velocity is zer?
 View Solution
The acceleration time graph of a body moving in a straight is shown in figure.
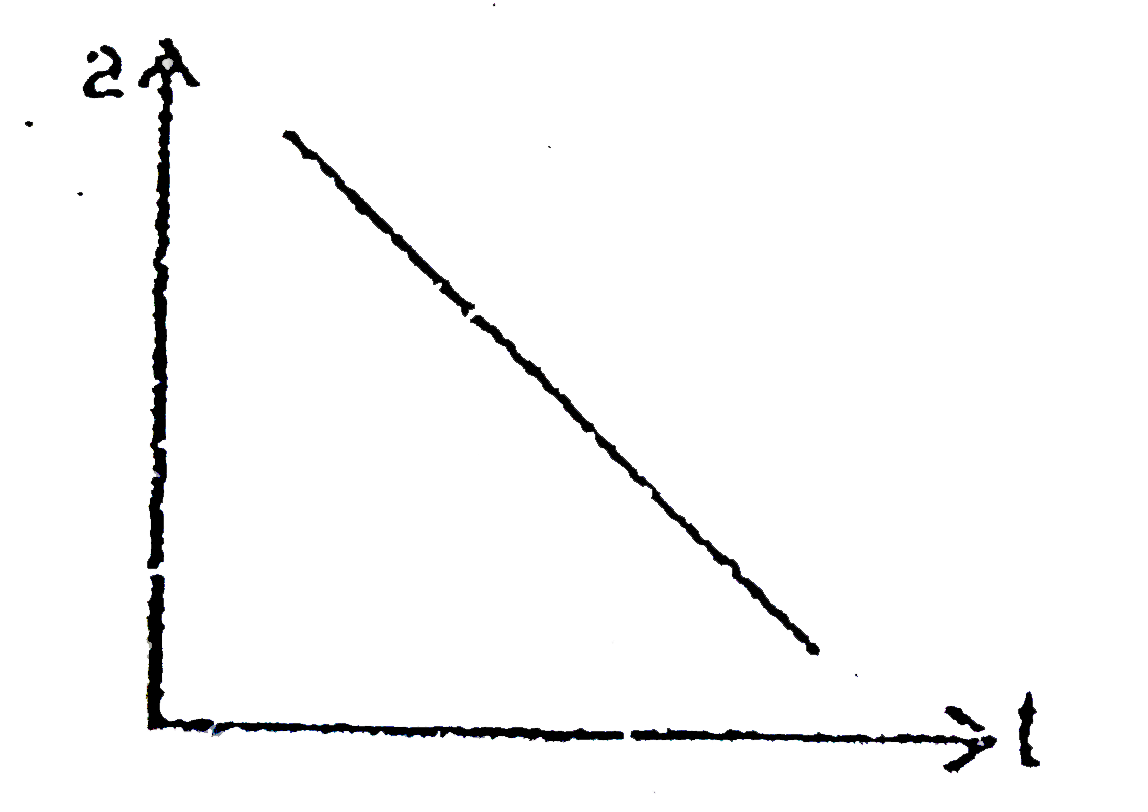
Assertion :− Velocity of the body is continously increasing over the time interval shown.
Reason :− Acceleration is positive for all shown value of t.View Solution


